Month: June 2013

  • April 2013 Results

    April was the most grueling month I’ve experienced since starting pebblewriter.com. The month started only 6 points below the all-time high of 1576 and ended at the trend line connecting that high with the year 2000 high of 1552. Nearly every session begged the question: will SPX make a new all-time high?

    Seventeen of the 22 sessions in entire month saw trading within 10 points of at least one of the lines. What’s more, the average daily range was 16.5 points. About 60% of the sessions involved a change in direction. If it had been a basketball game, they’d have carried both teams off the court after reaching 180-179 in quadruple overtime.

    It was a blur of whipsaw days, sleepless nights and an almost embarrassing number of trades — about three per day. We had many sizable gains as well as our single biggest loss since inception: 1.59%. By the time all the dust settled, we were up 14.45% for the month versus 2.03% for the S&P 500 — our 3rd best month yet.

    LESSONS LEARNED

    All in all, it was a very instructional month — reinforcing some things I’ve been doing and arguing against others.  Two issues I’ve been studying are interim trades and holding positions overnight.

    The overnight ramp jobs and reversals were deadly.  It was only marginally beneficial to maintain a position overnight or over a weekend. And the whipsawing got so bad that I was a little paranoid by the end of the month.  Performance might have benefited from looser stops and going to cash overnight and over weekends.

    There were also days I should have stayed with the trend and ignored the bounces or “interim trades.” On the 18th, for example, I let a short trade run while playing short-term bounces to offset the losses.  By the time I covered the short on the 23rd, my three winning trades of +2.45% offset the 4 losing trades totaling -1.85%.  But, I could have earned 2.5% by simply switching sides when the short signal faltered.

    GOING FORWARD

    As we discussed last month, the trickiest part of Harmonic Patterns is the .886 – 1.000 range (once a Bat Pattern completes, will there be a new high?)  Now that the question of a new high is settled, we should see more directional moves and less chop in the market — reducing day trading and permitting more swing trades.

    The road ahead continues to look bumpy.  Sentiment is lousy as many market participants seem to feel stocks are overpriced, but are leering of abandoning BTFD. Corporate earnings look fine on an EPS basis, but have mostly missed on revenues and outlook.  The economic picture continues to be worrisome, with weakness across the board.

    All eyes will continue to be on the Fed, which seems to hold the market’s future in its hands.

    GLTA.

  • Charts I’m Watching: Jun 7, 2013

    Everything’s pointed up this morning. Best to get long and not question the why’s and wherefore’s.  In retrospect, I shouldn’t have questioned the fact that SPX was completing the patently obvious pattern yesterday.

    The USDJPY got a sizable bounce off the .786 overnight…

    …and should have room to move.

    The S&P futures are nearing the point of exhaustion after a huge ramp in the past hour.

    The .786 is just ahead at 1635.21, as is the purple channel .25 line.

    UPDATE:  9:32 AM

    SPX just tagged its .886 from the 1598 bottom yesterday and should at least backtest the yellow midline.  Good place to short here at 1632.41…

    …which is also the .382 of the entire move off the 1687 top.  Stops around 1635.

    continued for members(more…)

  • Charts I’m Watching: Jun 6, 2013

    The futures have reversed big overnight gains thanks to Draghi’s candor and hesitancy to throw the quantitative kitchen sink at the EZ economic weakness.  The eminis, which were up to 1616.75, have settled back to about flat to slightly negative.

    The EURUSD hit our target of the white .786 at 1.3148 with ease and is bumping up against the white channel .25 line fairly deep in a rising wedge.  Further gains to the .886 or higher might be in store, but might not be as easy to come by.

    The dollar has pushed below key support at the purple channel bottom and red channel .25 line and its own rising wedge is in danger of breaking down.

    We covered our short position near the close yesterday after SPX reached our primary target of 1608, but noted the distinct possibility of a drop to 1593.

    I’ll play along with any weakness on the opening, as that possibility has not diminished in the least.

    But, the line in the sand is about 1605, and I do expect at least a bounce if not an outright reversal.

    More in a few…

    UPDATE:  9:33 AM

    I’ll revert back to the long side here at the channel bottom (1606), with stops at 1605.  Charts in a moment…

    UPDATE:  9:45 AM

    That was a very quick tag at 1605.19 — close enough.  The key to the upside will be breaking out of the falling wedge, while support is well-defined by the intersection of the two channel bottoms.

    I’ll leave the grey harmonic grid up until the coast is clear.  It is motivated by the larger purple grid’s .618 (from 1536 to 1687) which would be expected to provide a substantial bounce if reached intraday.

    The 15-min RSI shows the resistance to be expected (white midline) at the wedge’s upper bound….

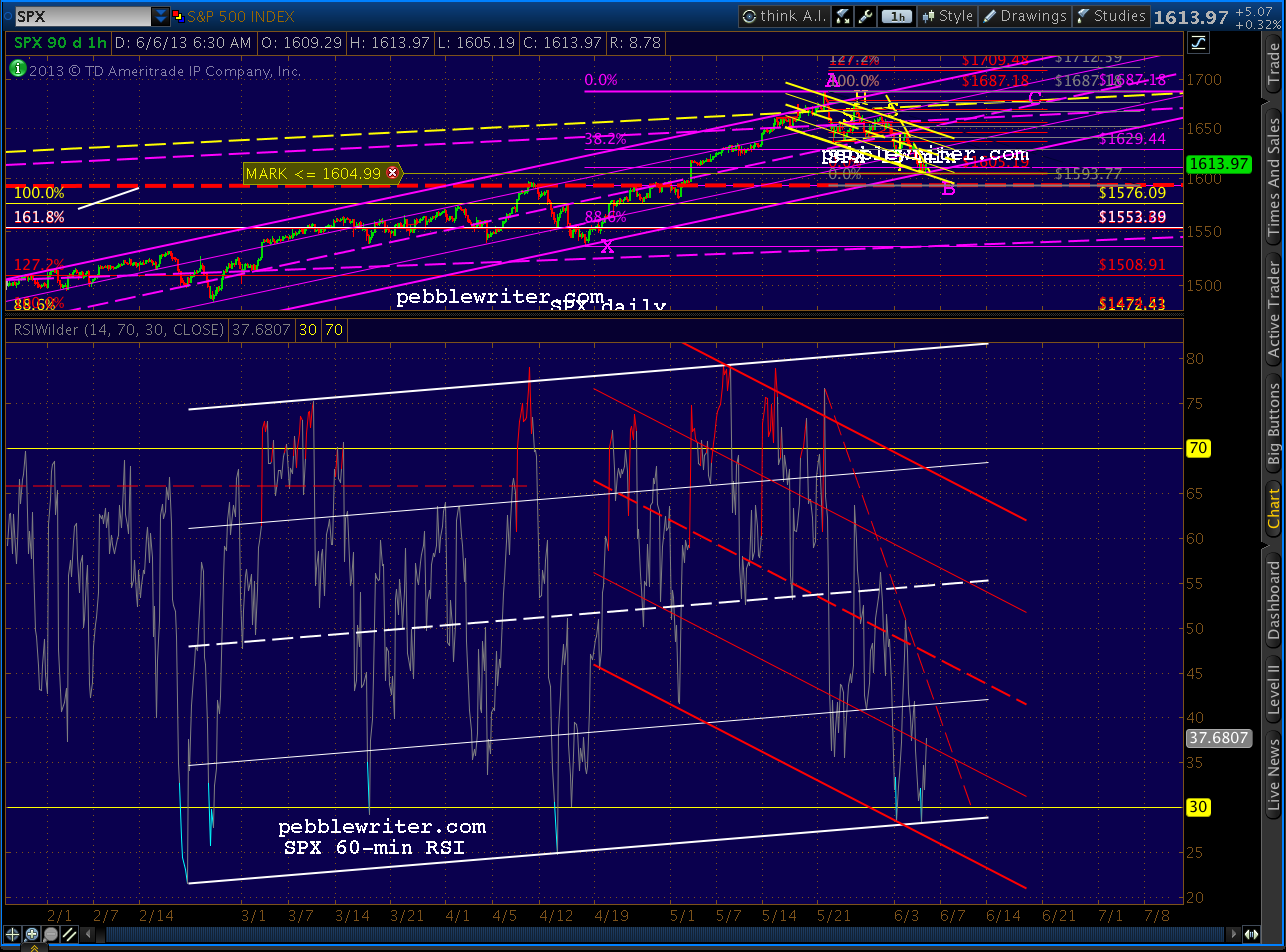
    …while the 60-min RSI supports the idea of a bottom here — with slight positive divergence indicated.  I won’t consider SPX out of the woods, though, until it can break through the dashed, red trend line emanating from the 1687 high.

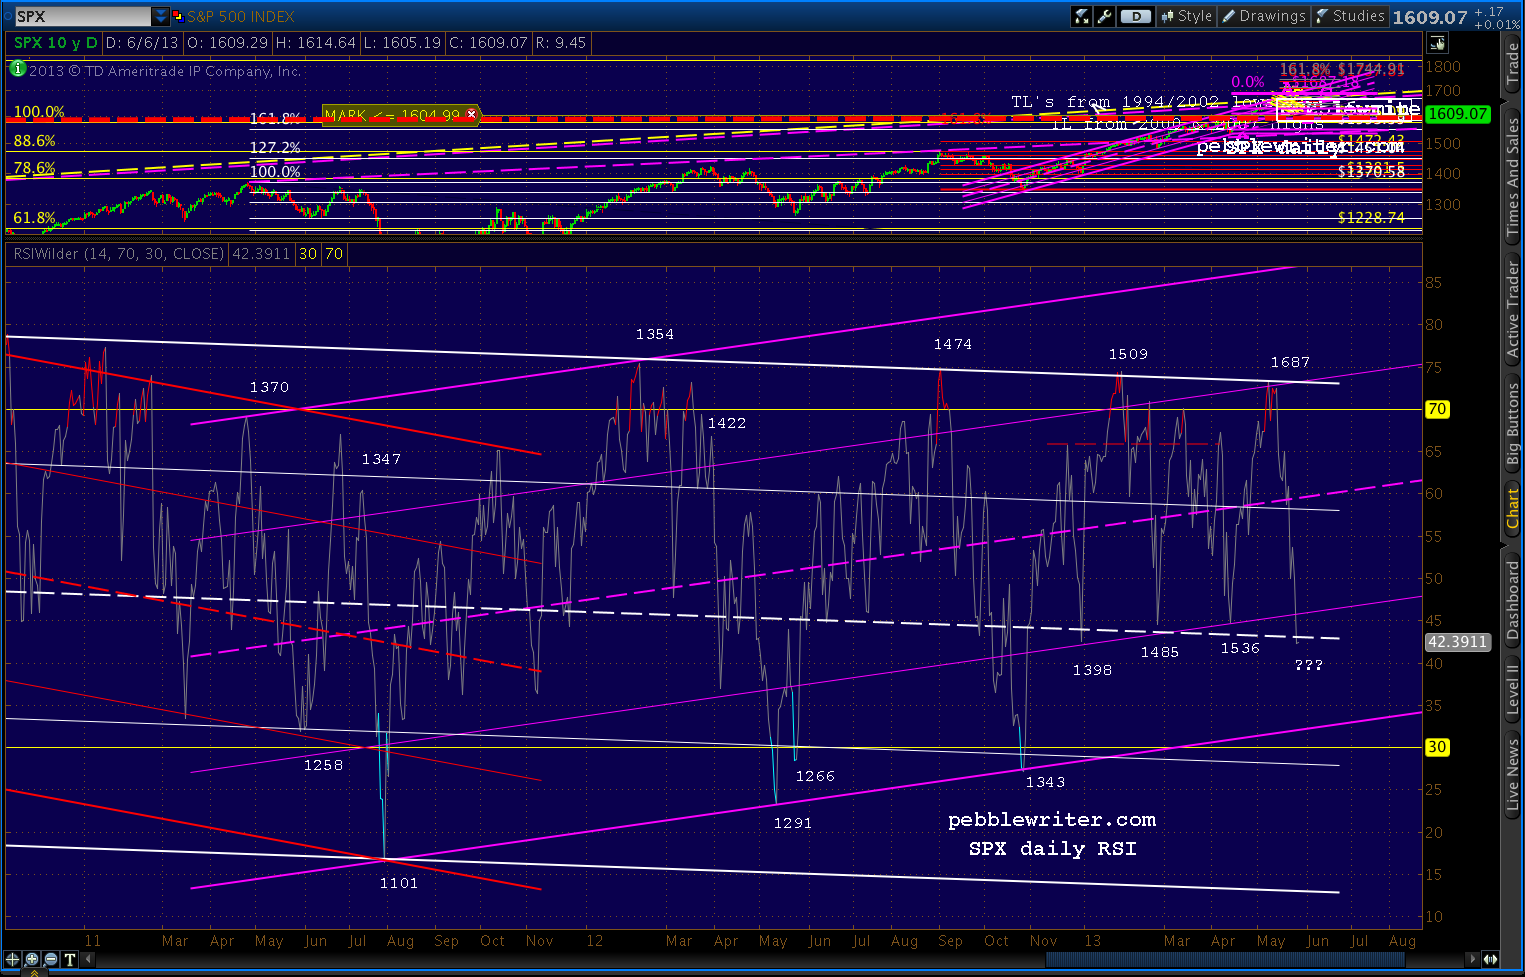
    It’s the daily RSI that should make the bulls nervous.  A break of the white channel midline (dating from Oct 2008) would have dire consequences, as there’s very little channel support until the bottom of the rising purple channel.

    The three previous times that RSI dropped through the purple channel’s .25 line signaled the biggest downturns of the past two years:

    • the July – August, 2011 plunge from 1343 to 1101
    • the April – June 2012 drop from 1422 to 1266
    • the September – November correction from 1474 to 1343

    SPX has tagged the purple price channel that began at the Nov 2012 1343 bottom three times since then.  Each mini-correction’s rebound was marked by a tag on the purple RSI channel’s .25 line.

    This current correction — while about the same magnitude as the others — is the first to show negative divergence.  That is, this morning’s 1605 low is higher than the previous 1536 low, but came with a lower RSI value.

    That, coupled with the fact that it already broke down below the .25 line that supported its cousins, should have bulls on edge.

    UPDATE:  10:45 AM

    From the big picture to the small…SPX has formed several small H&S Patterns that point in various directions. The first two busted, but the latest hasn’t yet.

    Suffice it to say the picture remains muddled, and will until a break above the dashed yellow TL (the falling wedge) or below 1605.

    But, the harmonic picture points to a test of 1600 (a Butterfly Pattern), so I’ll take an interim short position here at 1610 and see if it plays out.  Stops at the yellow TL (about 1612-1613) ought to do it.

    The pattern would bust at 1614.64, though the TL provides an earlier exit.  So there’s 4.64 max points of downside risk versus 20 points of upside (down & back.)  Even at 50:50 odds, I like those numbers.

    UPDATE:  11:18 AM

    Though SPX is creeping up on our stops, DX just completed a Bat Pattern at the bottom of a well-defined channel.

    I’m inclined to give our little short position a little leeway and see how the rising wedge breaks.

    I’ll close the long position and go full short here at 1612.64, stops at 1614.65.

    UPDATE:  11:45 AM

    Here’s an even better entry point — the .886 of the drop from A to B, with stops at 1614.65 just above.

    UPDATE:  12:05 PM

    So far, so good.  We should get at least a bounce here at the former low, but things are looking good for 1600.  Of course, there is an alternative which I find very appealing.  Butterfly Patterns typically complete at the 1.272 or 1.618 extension.

    But, like Crab Patterns, they can extend even further… for instance, the 2.24.  If the 1593.47 price point there doesn’t ring a bell, please see this morning’s first post.

    continued for members(more…)

  • Let’s Make a Deal

    The market continues to play Let’s Make a Deal with the Fed: keep pumping $85 billion into the banking system every month and we’ll keep pumping prices higher.  Ben Bernanke realized long ago that the game is rigged.  He should know.  He rigged it.

    The contestants (the banks) can’t help but win, while the studio audience (the rest of us) squirms in their seats, waiting for their shot.  Enough of them remain hopeful that no one noticed the air conditioning had pooped out, the snack bar ran out of food and the punch bowl was getting dangerously low — until now.

    Now, the word is getting out.  And, the audience is very, very focused on that punch bowl.  When it runs dry, we know the contestants will pack up their winnings and sneak out the back door — leaving an untenable situation out front.  What will Monty do then?  Can he risk letting that happen?  What would happen if the entire audience rushed the door?

    Stay tuned.

    *  *  *  *  *  *  *  *

    The futures are pointing south, so we’ll play along on the opening.  But, this morning’s subpar economic news reassures us that the punch bowl isn’t yet dry.  Services PMI comes out at 10:00AM.

    The picture was much gloomier overnight, when the USDJPY once again flirted with losing its channel.

    The RSI tells the same precarious story:

    DX came very close to breaking out…but hasn’t.  It very likely will complete a Bat Pattern first, even if it means another dip below the channel support later tonight.

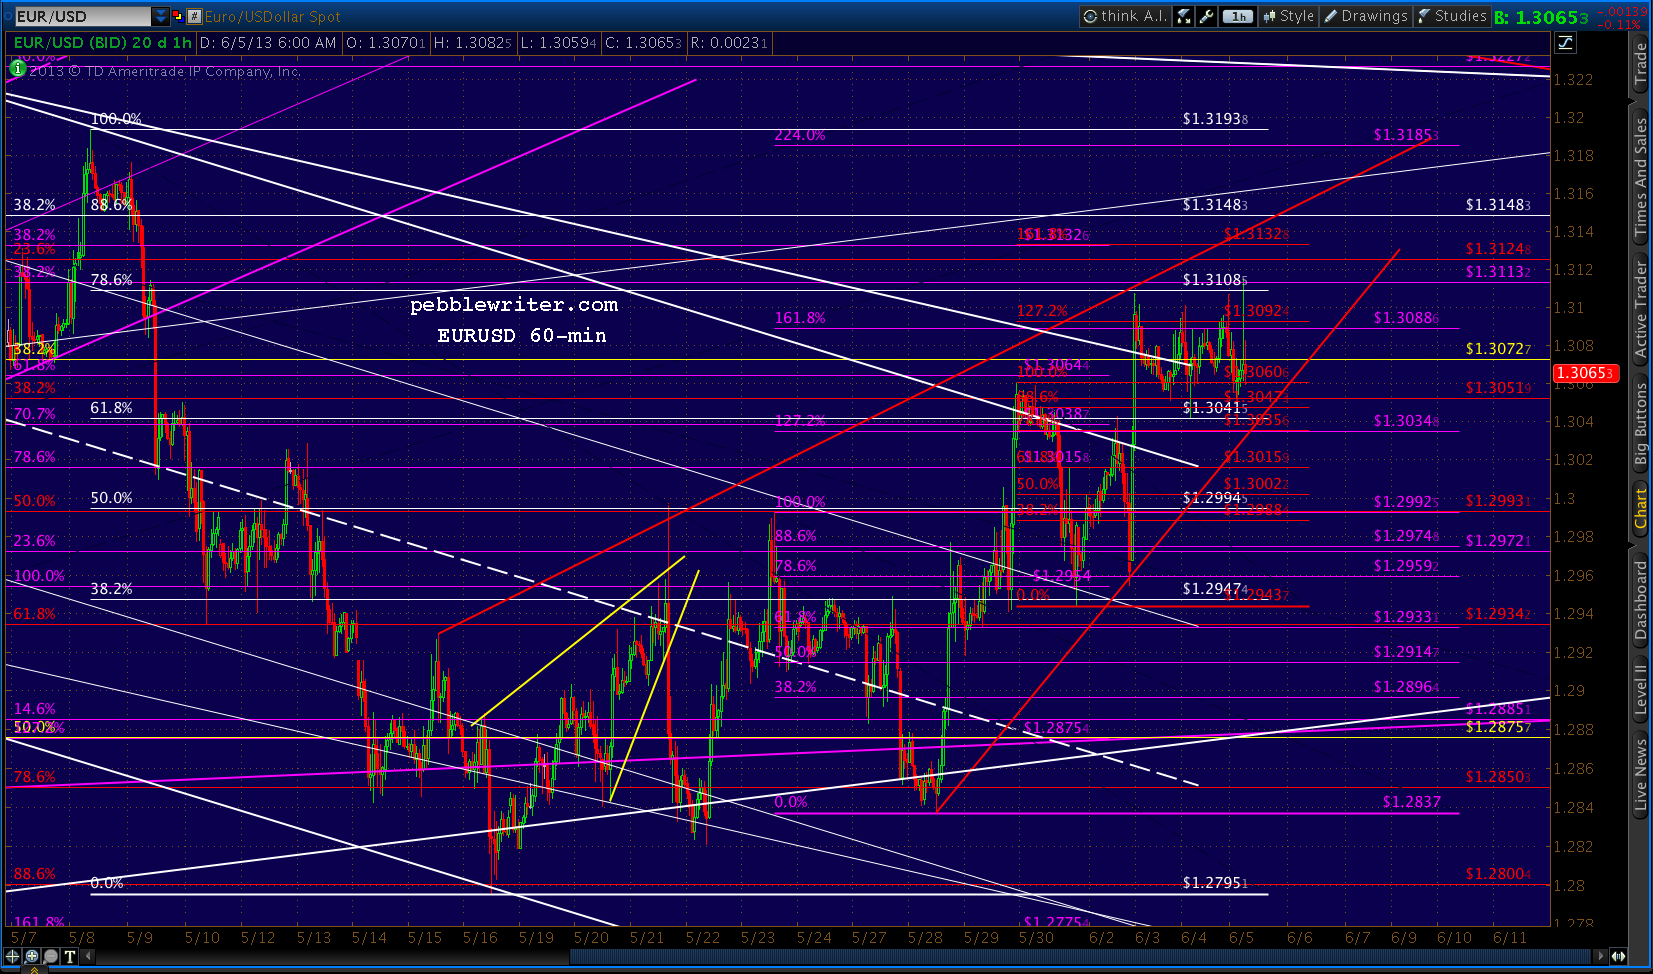
    Even the EURUSD is doing its part…hinting at a Bat Pattern completion at 1.3148 very deep into its rising wedge (also likely after hours.)

    UPDATE:  9:35 AM

    SPX just reached an .886 retracement of its rise from yesterday’s low, so we’ll cover our short and revert to full long here at 1625.  Stops at 1622.75.

    UPDATE:  10:02 AM

    Services PMI came in at the expected 53.5 versus last month’s 53.1.  Factory orders grew at 1.0% versus an expected 1.5% and last month’s dismal -4.9%.  The punch bowl just got topped up.  The game can go on — at least for now.

    Note the all-important employment index — down to a barely positive 50.1, just like its manufacturing counterpart.

    UPDATE:  10:15 AM

    Just got stopped out at 1622.72, so back to the short side. Trailing stops.

    There’s a Crab Pattern to be completed at 1608 — also the H&S target. But, there’s an argument for a leading diagonal/falling wedge that would indicate support at 1615-1617.  So, we’ll see.

    Harmonics traders all just got stopped out when their potential Point C dropped below Point A — the last low at 1622.72.  But, wavers should be fine it this is wave B in a flat wave 4, which I understand is allowed to and frequently does dip below wave A.
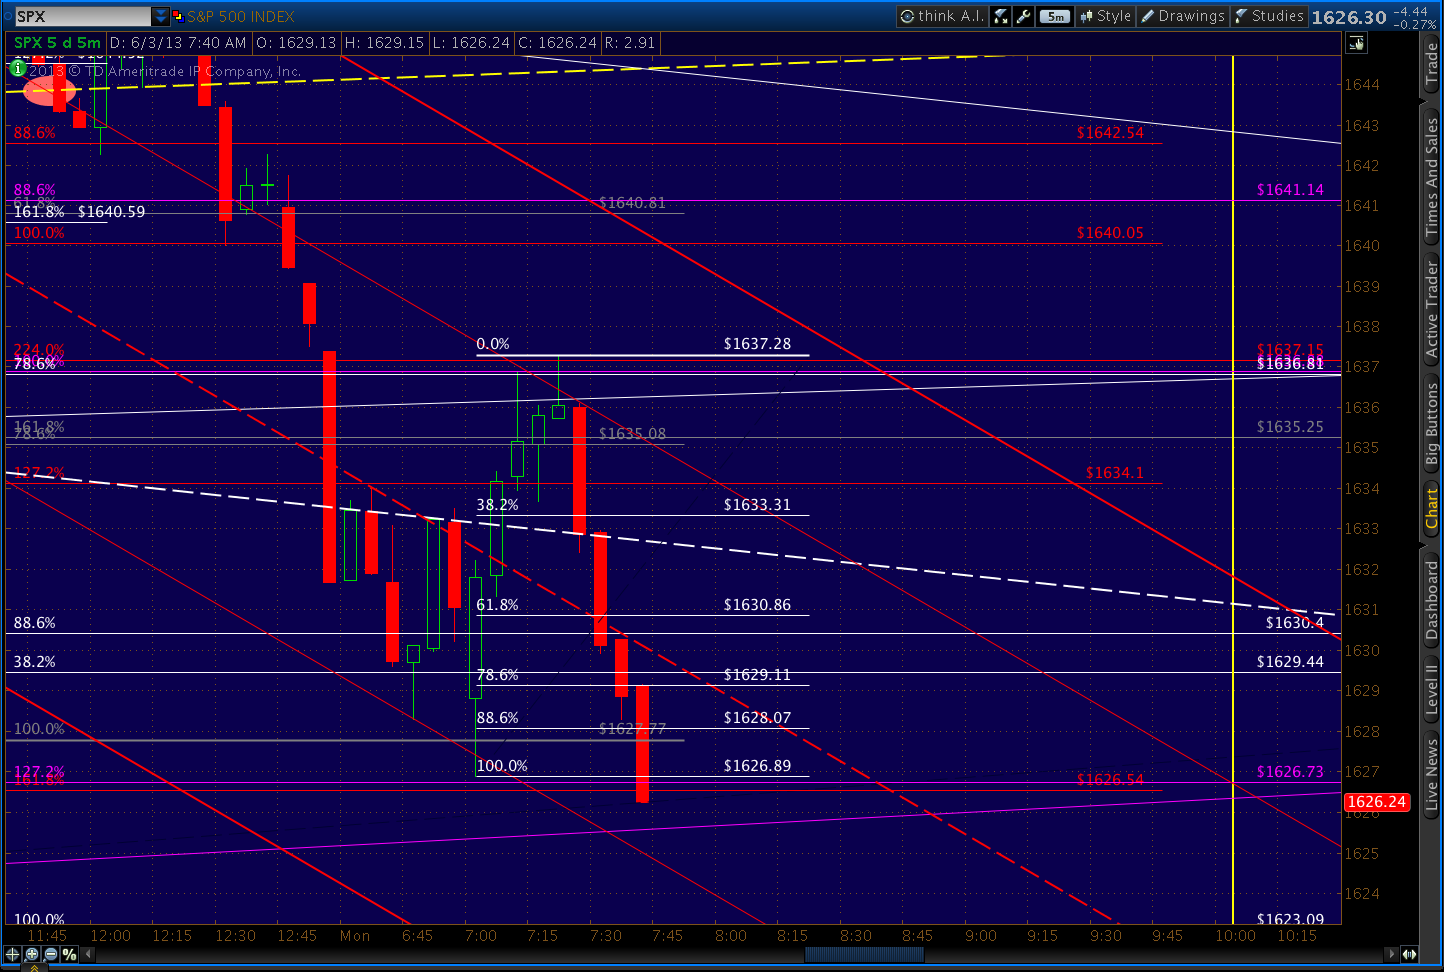
    Great way to shake out the bulls before a run to the upper bound of the wedge — if that’s what this is.  I’ll likely resume a long position on any strength back through 1622.72, but would much prefer a tag of 1616.24 first.
    continued for members(more…)

  • The Hindenburg Omen

    Major crash?  Minor correction?  Somewhere in between? Did you know it issued another signal today?

    For the latest skinny on just how ominous this omen is, I turn to Albertarocks.  He’s been studying and writing about it for years.

    Check out the latest HERE.

  • Charts I’m Watching: Jun 4, 2013

    Futures are pointing up, the US dollar’s vacillating, the USDJPY got the bounce — could be another positive Tuesday.  We’ll go long on the opening, with the yellow H&S neckline and red midline as our target.

    UPDATE:  09:36 AM

    Just reached the intersection and will go full short at 1645.55.  The .618 of the drop from 1661.91 is a little higher at 1646.94, so I might be a little early.

    updated: 9:50 EDT

    It all depends on whether the white or the red channel is in charge.  The top of the white channel is appealing at 1653.53 (the .786), so I’ll take any move through 1647 as a signal that it’s in play rather than the red midline.  And, though there’s room for interpretation, the rising purple channel midline appears to be closer to the .618 as well.

    The falling white channel has the benefit of three tags on the upper bound and a lower bound that perfectly captures the 1.618 extension of the initial drop from 1674 to 1640 where it intersects with H&S target (1608) and the bottom of the large purple channel later today.

    But, the red channel lines up well with some important reversals as well as the two bottoms made yesterday and back on May 23.   A reversal here at its midline would support its dominance.

    Pulling back a bit, it’s obvious that either channel can get us to the bottom of the rising purple channel.  The question is when, and at what price.

    continued for members(more…)

  • Charts I’m Watching: Jun 3, 2013

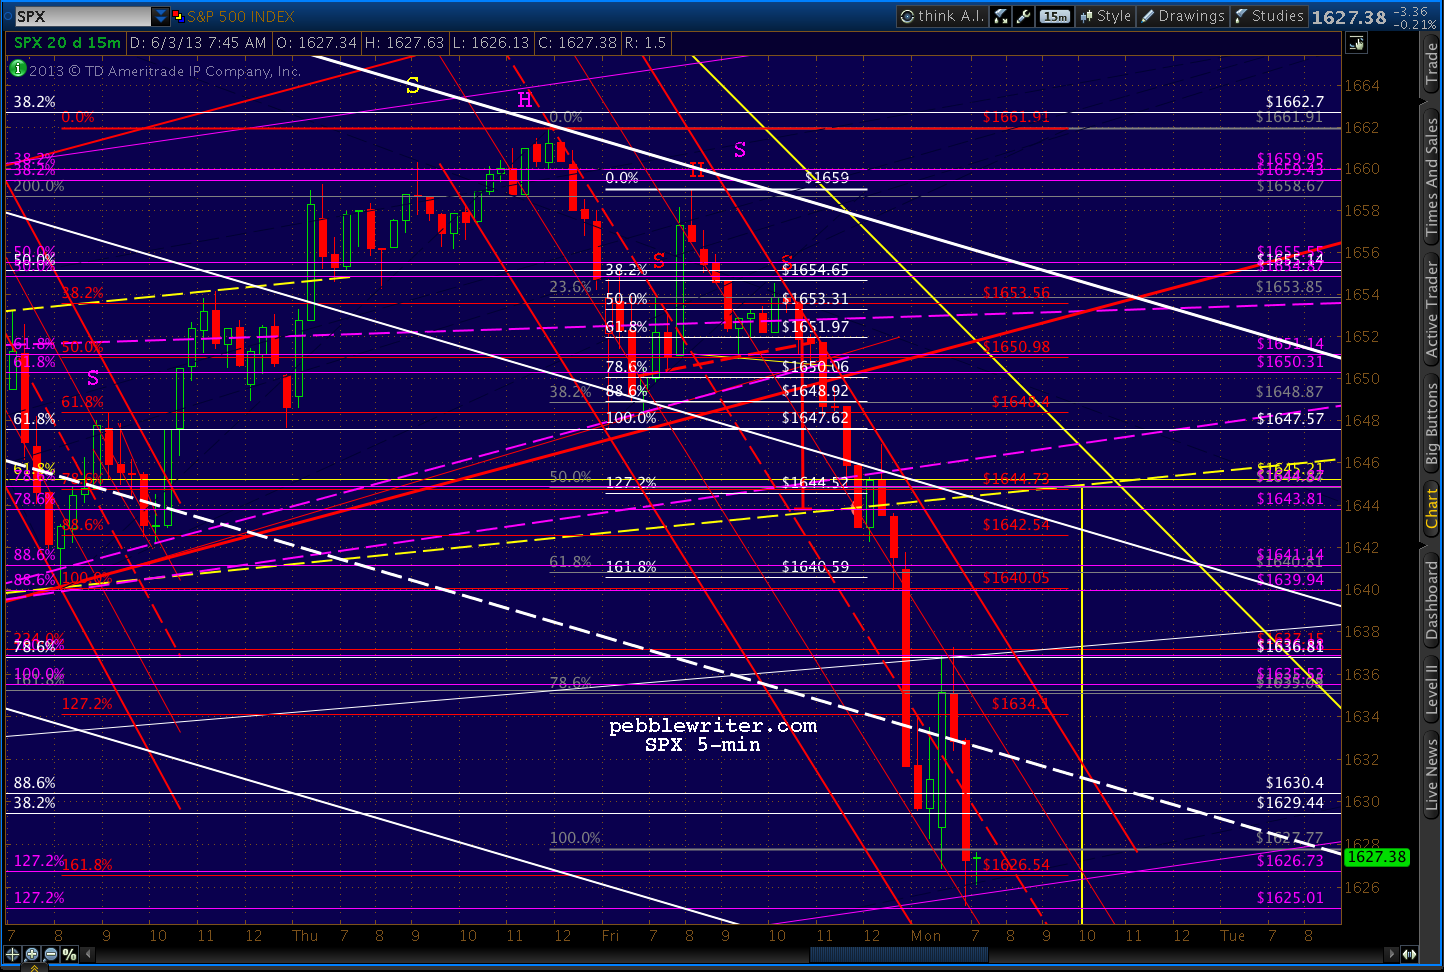
    Friday’s close was uglier than we’ve seen in quite some time.  After completing several H&S Patterns, SPX should continue lower.  The question is whether or not it will first backtest any of the necklines — not necessary, but to be expected.  I’ll be looking for the right entry point.

    SPX didn’t stop or bounce at any key Fib levels on its way south Friday.  It stopped going down simply because the market closed. So, any push lower will be cause to play the downside — regardless of the extent of the opening bounce.

    Once SPX breaks lower, I’ll be looking for opportunities to play the inevitable bounces.  There will probably be several of them; so, swing traders and buy and hold types should stay focused on our ultimate downside target.

    UPDATE:  9:40 AM

    The index just moved into negative territory.  We’ll short here at 1631.60.  Charts in a moment, but the next potential Fib support is at 1626.54 – 1626.73.

    UPDATE:  9:46 AM

    Updated 60-min chart…showing the most likely operative falling channel in white.  This morning’s bounce on the opening backtested it, but it was less than convincing.  We’ll set stops at the midline (around 1633.50) just in case.

    UPDATE:  9:54 AM

    ISM survey and construction spending data is coming out at 10AM.  We’ll see if the market can push through the white midline on the news.  If so, the purple midline and yellow neckline are up around 1644-1645.

    UPDATE:  10:02 AM

    The data shows continued weakening, which should squelch the Fed tapering talk somewhat.

    On the heels of the data, SPX just tagged our Fib target levels, so we’ll play the bounce here at 1627. Tight trailing stops starting at 1627.

    Again, the key to sustaining any bounce will be a move back up through the white midline — now at 1633.  We’ll set our objective at 1644 — the purple channel (from 1343, Nov 2012) midline and the broken neckline of the largest H&S Pattern (in yellow.) It would also represent a 50% retracement of the move down from 1661.91 on May 30.

    The ISM PMI Index came in at 49.0 versus expectations of 50.9 and last month’s 50.7.  The picture is fairly negative across the board, with employment clinging to a barely positive 50.1 reading.  In short, not the sort of report that would support the bullish economic forecasts being tossed about by the MSM lately — but, exactly the kind of report QE fans were hoping for.

    UPDATE:  10:27 AM

    The bounce reached as 1637.28 so far.  We just got a sharp downturn back to the white midline — likely just a backtest, a B wave in an A-B-C corrective wave to 1644ish.  But, any sustained push below 1633 and I’ll likely put a short position back on.

    No sooner typed that than the index moved through the midline.  I’ll add an interim short position for a little deeper retracement to probably around 1628.07 – 1629.11 (.886 and .786 respectively.)  A move below 1626.89 and I’ll abandon the long position.

    UPDATE:  10:36 AM

    Just tagged the .786 at 1629.11, might still reach 1628.07.  I’ll set stops here on the short position just in case this is the full extent of the move.

    UPDATE:  10:41 AM

    Just took out the previous low, so full short at 1626.88.  We should get a bounce at the purple .25 at 1625, also the scene of the red 1.618 at 1626.54.  We came up just short of it earlier.

    UPDATE:  10:47 AM

    Taking another stab at a bounce here at 1626.   I’ll play the stops a little tighter this time.

    Any move through 1625 is cause to resume full short, but I’ll likely pull the trigger a little quicker this time.  I’m disappointed to have missed the top with the last bounce — which didn’t even retrace .382 of the drop from 1661.91. This latest dip, which as mentioned actually tagged the red 1.618, also tagged the purple 1.272 and the purple .25 line.  So, if it can hold 1625, it could be a more substantial bounce.

    But, it’s hard to justify from the standpoint of the falling white channel, which already backtested its midline.  So, either it won’t bounce much or the white channel is off a bit.  We’ll find out shortly.

    UPDATE:  11:24 AM

    Not much of a bounce at all.  Resuming full short here at 1625. Charts in a moment, including where I expect this downturn to finally reverse.

    continued for members(more…)