Month: June 2013

  • Charts I’m Watching: Jun 28, 2013

    Note to members:  I posted some good charts on VIX early this morning, so check those out if you get the chance.

    I’m glad to see more of you signing up for Twitter.  I try very hard to post intra-day trade decisions there, but sometimes there just isn’t enough time.  It will be much easier when the fund is up and running, because all of my trading will be done there.  There’s a Twitter link over to the left of this page if you’d like to sign up

    I will have another update on the fund either tonight or tomorrow.  So, if you haven’t signed up for the distribution list yet, CLICK HERE.  You will be asked to affirm that you are an accredited investor, and will need to identify yourself.  It’s not that we’re nosy; it’s something the SEC requires.  The information is never sold or shared with anyone under any circumstances.  Pebblewriter members are the smartest, funniest and best looking investors on the planet.  Why would I share you with anyone?

    Last, I’ve been giving a lot of thought to how the website will look after the fund launches.  I’ve wrestled with the existing format, as it’s difficult to accommodate swing traders, day traders, and infrequent traders.  I sometimes get too mired in the intra-day trades for swing-traders taste, and the day traders want more, quicker, set-ups throughout the day — not less.  Look for a new post dedicated to membership issues tomorrow morning.

    *  *  *  *  *

    The futures are down about 5 points this morning, but might have found support at a channel line and .500 Fib after being turned back by a .618 Fib yesterday.  If they bounce back, however, is it just a backtest of the purple channel from last November?

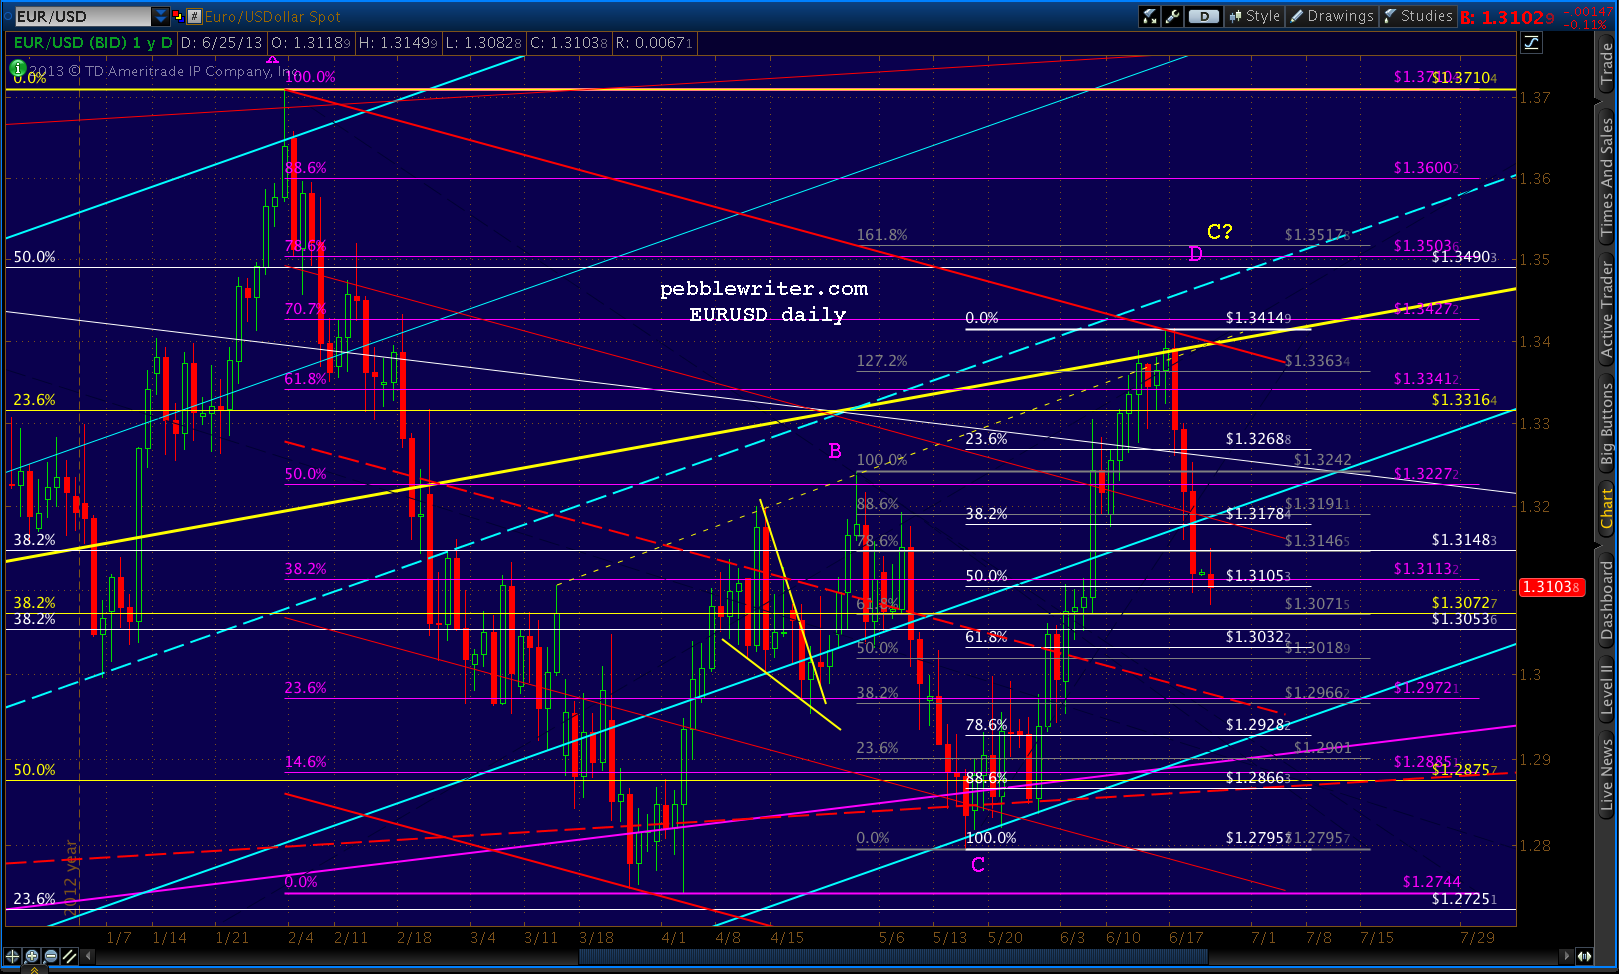
    The EURUSD certainly appears to be backtesting a recently broken channel line, and it appears to have more room on the upside.

    SPX, having squandered an excellent chance to complete an IH&S that would take it up to backtest its broken purple channel, is fleshing out the grey channel we theorized would take over.  It just bounced on the .25 line – but after slipping through the key TL (red, dashed) from 1994/2002.

    I’ll take the opportunity to short on the backtest if it fails to retake it.

    UPDATE:  9:55 AM

    It did, so I’m playing the short side — probably to 1598/1600 as we discussed yesterday.  Here’s a better look at what could end up being a flag pattern if the bottom of the grey channel holds.

    UPDATE:  10:00 AM

    Might be a tad early, but I’ll try a long here at 1602.40.

    If 1560-1620 is A and 1600 is B, then C would be at 1660.  The .786 Fib of the slide from 1687 to 1560 is 1660.  Coincidence?  I think not.

    As we discussed in the members section yesterday afternoon, a flag gets us back to the .786 or .886 Fib just as easily as the two H&S patterns would have — a little more easily actually.

    But, first, SPX will have to slog back up through the TL from 1994/2002, bust out of the falling red channel and deal with the bottom of the purple channel — meaning either a brute force assault (a.k.a. ramp job overnight) or a slow choppy slog higher until the channel bottom reaches the .786 — around mid-July.

    If you’re a bull, you have to be a little concerned that yesterday’s moon shot came within 8-12 points of the purple channel but couldn’t close the deal.  If you’re a bear, you’re positively giddy — but know how quickly that feeling can pass.  Me?  I’m a Gemini.

    UPDATE:  10:44 AM

    SPX has reached the red TL from 1994/2002 again.  A little .786 pullback from 1610-1611 to the intersection of the grey channel bottom and red midline (1603ish) would make for a nicer looking flag pattern.  A failure to retake it would be a sign that we’re falling back to 1586-1593 (always use stops!)

    UPDATE:  11:15 AM

    SPX poked up through the TL easily enough, and just tagged the grey midline at 1615.64 — very close to a .786 retrace of yesterday’s high.

    I’ll take a short-term short position here for a pullback: either a retracement back to the red channel top at 1609, the grey channel bottom at 1605-1605… or possibly much more.

    If that sounds a little nebulous, it’s because we’re at another one of those lovely turning points.  I’ll explain further in a moment.

    Just want to point out there’s a potential little IH&S in the works that, if it plays out, points to 1631 (a shadow of the purple channel bottom.)  Ideal right shoulder would be a backtest of the red TL around 1610.

    This makes stops on the short position around 1616 a very good idea.

    Okay, big picture stuff…  the rise from 1560 to 1620 was roughly a .618 retracement of the drop from 1654 to 1560 — the red pattern below.  When we get a significant reversal at a .618 point, it opens up the possibility of a Gartley completing at the .786 (1634 in this case), a Bat at the .886 (1643) or a Crab at the 1.618 (1712.)

    Each of those possibilities carries very different implications for both price and time, so we’ll examine them in the context of what currencies and VIX are telling us.

    continued for members(more…)

  • Update on VIX: Jun 28, 2013

    VIX is a very well-behaved market indicator most of the time.  It often retraces to normal Fibonacci levels.  It follows channels like a champ.  And, its RSI channels are hard to beat.

    In fact, VIX RSI channels are one of my favorite tools for determining overall market direction. So, it’s disappointing that, at the moment, they’re a little fuzzy.

    VIX recently completed a Bat Pattern on the white grid, only to fall back trough the rising purple midline and red midline.  Re RSI, It has support at the bottom of the rising purple channel and the midline of the red channel.  But, it appears to be not quite there yet.

    A breakout of any kind would most likely be a Crab Pattern to the white 1.618  (for starters) at the intersection of the falling red channel top — perhaps as early as 10-12 sessions from today.

    But, first, VIX will probably have to tag the bottom or .25 of the purple price channel and the bottom of the purple RSI channel.  In other words, the market is likely to rally after whatever sell-off is planned for tomorrow morning.  But, the rally could be short-lived.

    GLTA.


  • Charts I’m Watching: Jun 27, 2013

    Another big gap opening on economic data.  We’ll go long on the opening, as the eminis have pushed through a trend line of resistance and indicate we will get the backtest of the purple channel we’ve discussed.

    UPDATE:  9:31 AM

    SPX just navigated the same TL (red, dashed) on the opening. The keys this morning will be remaining above 1612.45 and pushing through the red .618 Fib at 1618.34.

    UPDATE:  9:45 AM

    Cleaned up the SPX chart a little…  We should get a backtest of the red channel .75 line and above-mentioned TL at 1618.34 — probably to 1611 or so if it’s able to remain in the purple acceleration channel.  I think it’s worth a short position with tight stops.

    This one’s a little tricky, though, as it’s the .618 retrace of the drop from 1654.  The next higher Fib based on 1687 is the grey .500 at 1623.76.  The white .382 (1536-1687) at 16129.44 and the channel bottom itself at 1629-1632 are also in the mix.

    UPDATE:  10:02 AM

    This might be as good as we’re going to get under the circumstances.  I’ll go full short here at 1617.34 with stops at 1620ish.

    As mentioned above, there are plenty of slightly higher targets.  Reaching the bottom of the purple channel would take only 15 more points or 1 FGSU  (Fed Governor Speech Unit.)

    But, check out the RSI charts…  The daily, which is always subject to intra-day pushes beyond channel lines, does show potential stiff resistance from both the red TL and the .25 white channel line.

    The 60-min similarly shows channel resistance at the top of the yellow channel.  It’s a little less susceptible to excesses (at least those that can be squeezed into 60 min) and often makes its statement at the top of the hour, when peaks/valleys are “in the books.”

    Even the 15-min RSI chart shows a turning point that could have some legs.

    This leads me back into the discussion of the bigger picture.   We have a lot of noise today:  pending home sales are the best in 6 years, income and spending are up, Dudley is speaking (but neither confirming nor denying), Lockhart’s coming up in a couple of hours, even Powell is getting into the act.

    All, including Kocherlakota yesterday, are pushing back on the notion that the punch will be watered down any time soon.  And, all are shocked — shocked, I tell you! — that bond yields have risen as much as they have.

    UPDATE:  10:35 AM

    I think instead of closing out the short here at 1620, I’ll take an interim long position on any strength through the .500 at 1623.76 — with the idea of riding it up to the channel bottom or gap close at 1629.22.

    UPDATE:  12:30 PM

    SPX just tagged the bottom of the channel at 1612.  I’ll close the short here and revert back to a long position with stops at 1609ish.  I believe it’s more likely to break the channel and go lower, but I’ll let the market decide.

    Why lower?  The 15-min RSI chart suggests a back test of the intersecting yellow and purple channel lines (at the *) and then a bigger drop.  Maybe the red .500 at 1607.26?  Looks like it might be the intersection of the bottom of the purple channel and the yellow midline — and .618 to .500 pullbacks are commonplace in a tightly managed mild-mannered market like this.

    But, hey, Fed Govs are out roaming the streets.  Anything could happen.

    1615.25 ought to do it…next stop 1607?  Next lower support would be 1596-1600.  Full short again.

    UPDATE:  1:27 PM

    Looks like I was either early… heading up to tag 1617.68 or 1618.33 (the .707 and .786 of 1620 — 1611)… or just plain wrong (about to complete a little IH&S that targets 1621 and probably a subsequent IHS to target the gap close at 1629.22.)

    Or, the sneaky version:  run it up just past the top of the purple channel (clearing out the shorts), reverse at the .786 or .886 (get them back in) and zip back to tag the purple midline at 1613 (just below the rising channel bottom to clear out the longs, shorts double down.)  Then back up to 1618+ to complete the IH&S — taking extra care to close on the neckline so no one knows what might happen overnight.  Gap it in the morning to close the 1629 gap, then cut everyone off at the knees with a plunge to ???

    That’s what I would do if I were a ruthless master of the universe and wanted to bag a few extra thou for the weekend.  So, I’ll assume that’s what the MM’s are planning.  Something like this:

    Having already been sucked into it, I’ll stick with the short position until it reverses down at the right shoulder (1612-16113) then go long again.

    UPDATE:  2:10 PM

    That should just about do it pricewise.  Long again here at 1613.29.  Stops @ 1611ish.  It’s a little early still if they’re going to close it on the neckline.  So, possibly a little lower, or just a bunch of chop between here and 4PM.

    UPDATE:  3:40 PM

    Cruising into the home stretch.  For folks who, like me, watch channels, this are tough days.  The original purple channel has been completely obliterated.  Since it has broken down, it’s a sell signal, right?  Not necessarily.

    Remember in Channel Tilting a few days ago we discussed how when one channel rolls over, another is usually there to take charge.  Here’s the likely replacement for the purple channel, shown below in grey.

    We’re bound to dip below the midline once or twice before the close for good measure.  And, there’s still a good possibility that the market tanks from here.  The right shoulder of the IHS is looking rather elongated. A flag at 1608 would accomplish virtually the same thing — but more of it.  Keep those stops where you’re comfortable.

    Suppose SPX goes up and tags the neckline at 1617ish at the close.  Then what?  We talked about the purple channel tag and gap close up at 1629.22.  Is that all there is to look forward to?  I’ve been doing some charting today, and have come up with a reasonable scenario that differs a bit from our previous forecast.

    continued for members(more…)

  • Update on Gold: Jun 26, 2013

    It’s been a while since I last updated this page.  The equities markets have kept me working overtime, and I assumed our May 15 forecast had long since jumped the tracks.

    At the time, Gold had plunged 270 to 1321 per ounce in only 4 sessions, bounced at 1321 (the day after our bottom call) to within 13 of our upside target, and was returning for a second bounce — or not.   From that post [Update on Gold: May 15, 2013]:

    Now, at 1373, it has reached a critical juncture that should result in either a sharp rally to 1560 or a plunge to 1141 in the coming month or so..

    GC was closing in on the .786 retracement of the the rise off the 1321 bottom.  Playing the bounce was a low risk trade as long as one used trailing stops.

    Long positions could be played from the .786 (1357) or .886 (1340) as long as stops are watched very carefully and updated frequently.

    The downside case is probably stronger.  If the current plunge continues past 1321, there are only a few key levels of support before things get really nasty:

    • horizontal support at 1302-1309
    • potential Fib targets of 1276 (the 1.272) or 1219 (1.618)
    • Fib support at 1141-1157
    • Fib support at 947

    The bounce came a few days later at the .886 (1336) and despite gaining 84, couldn’t clear the big white channel midline, much less the smaller red channel (white in previous charts) it had been in since last September.

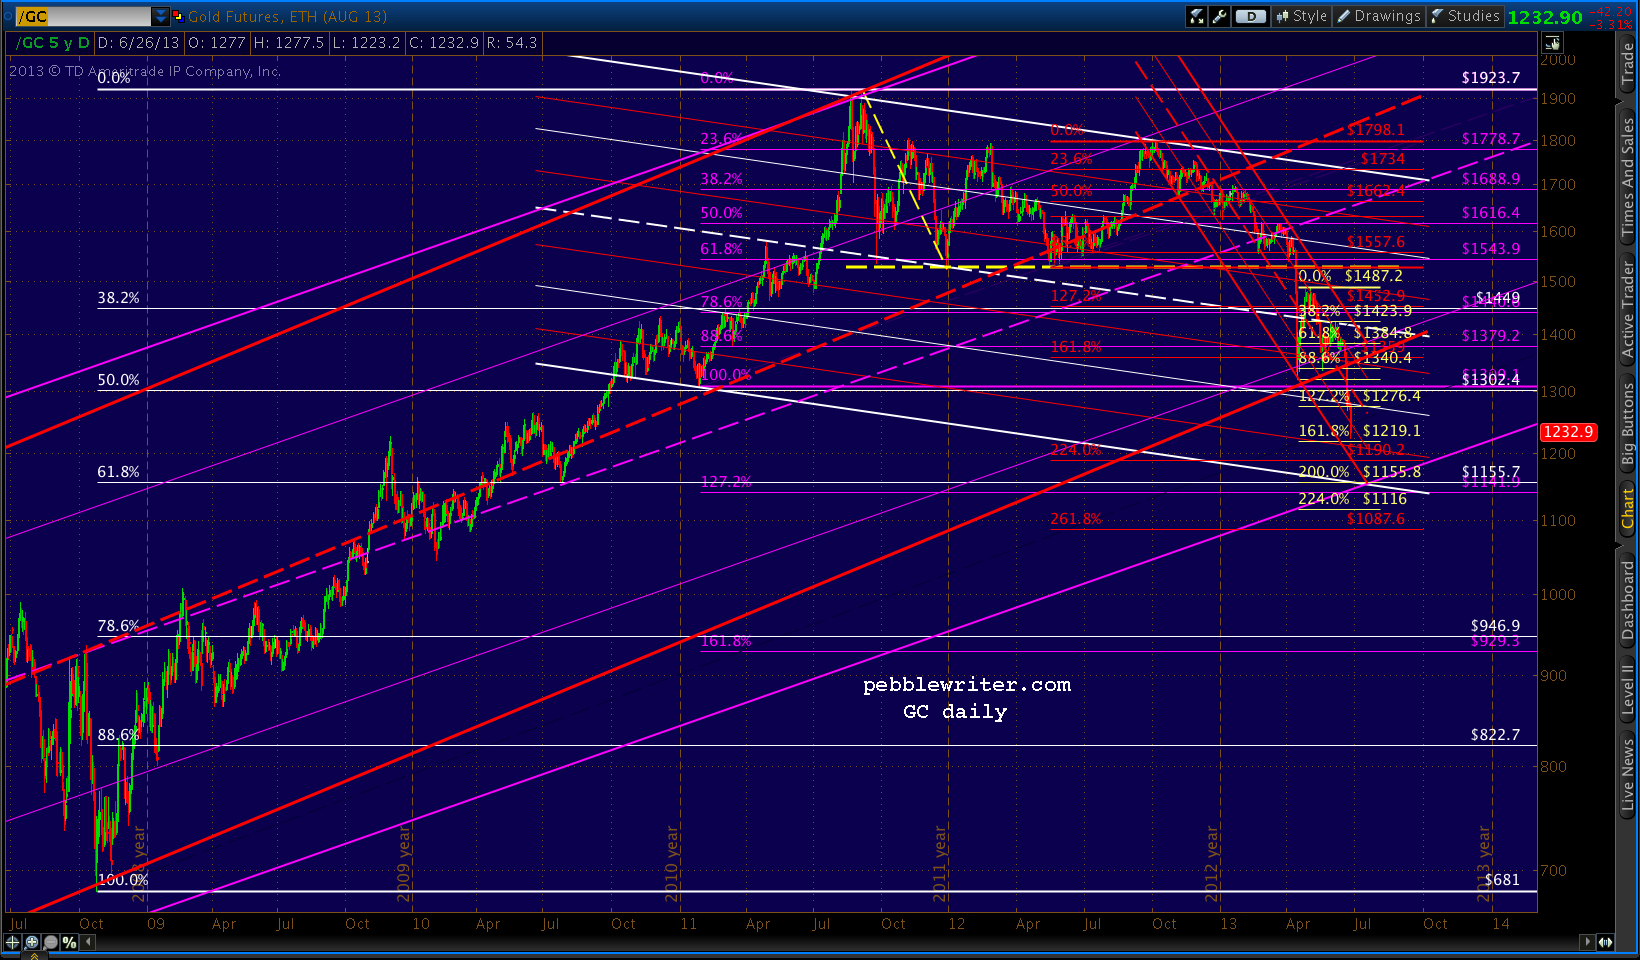
    When the big red channel from 1999 broke down on Jun 20, GC plunged again.  It failed to catch a bid at the first support level, but is approaching the second one this morning: the yellow 1.618 that completes the Crab Pattern at 1219.10.

    This seems like an opportune time to update the forecast, as gold’s price action continues to provide valuable clues as to investors’ expectations about QE, the value of the dollar and inflation.  Are the many calls for gold to fall below $1000 per ounce well-founded?

    Probably not.  We should get a decent bounce beginning at or near 1219 today that could take prices as high as 1320 or so by July 5-8.  A continued rally through the red midline would mean additional gains to 1357-1385 by mid-July.  But, there’s a better chance of a plunge to 1155 instead — and it need not respect the Crab Pattern about to complete, especially if today’s equity rally falters (gold certainly isn’t buying the MORE QE! snake oil.)

    Remember that 1155 is the .618 retracement (in white below) of the huge rally from 681 in 2008 to last September’s 1923 all-time high.  Around July 15, the bottom of the big white channel, the bottom of the red channel, the bottom of the big purple channel (it replaced the red one that failed on Jun 20) and a Fib Fan line all intersect with the .618 at 1155.

    Note, this is the same price target we identified in our April 15 Update on Gold.

    We can speculate about what circumstances might provide a floor.  The prevailing wisdom these days is yet another round of QE — or at least inflation of some variety. With interest rates on the rise, that seems likely enough.  We’ll stick a pin in the idea of a mid-July market calamity that necessitates Fed intervention.

    But, as long as 1155 holds (and, by proxy, the purple channel), gold will regain its luster.  It could rebound to 1525 by as soon as August and as high as 1760 by the end of the year.

    Each of the two significant spikes since the Aug 1999 low of 253 was followed by a retracement of between .382 and .500 of the rise from 253.  In May 2006, GC topped out at 1009 and then retraced just over 38.2% of the rise.  And, in Mar 2008, it retraced to about halfway between the .382 and .500 Fibs at 43%.

    The .382 Fib of the 253 — 1923 rise was 1285, so that ship has sailed.  The .500 is down at 1088.  1155 is about halfway between them (a 46% retracement.)

    A Fibonacci .618 on such a large pattern as this can be expected to provide at least a sizable bounce, but there is no guarantee.  The purple channel isn’t the most convincing fit in the world, and could fail in time as did the red.  If 1155 doesn’t hold, or if it merely provides a bounce, GC could complete a Gartley Pattern at the .786 (946.90) or even a Bat Pattern at the .886  (822) within the next six months.

    GLTA.


  • Charts I’m Watching: Jun 26, 2013

    The ramp has arrived. “Bad news is good news” has returned in the form of a GDP miss (1.8% versus 2.4%) that conveniently reinforces the importance of continued QE.

    I’m reluctantly going long on the opening and will look for the next appropriate place to short again.  With a break through the red channel midline, the most natural spot is the red TL from 1994/2002 at 1609 or the red .500 at 1607.  The .786 of the recently completed Crab Pattern (in white) is in the mix at 1610.21.  The key will be retaking and holding 1598 and the psychologically important 1600 level.

    UPDATE:  9:35 AM

    SPX squirted to 1603.58 on the opening, and should have enough momentum to test the levels mentioned above.  Breaking through the June 6 low of 1598 was important to the bulls case that the drop from 1687 is corrective, not impulsive.

    It’s not conclusive, as the drop from 1654 to 1560 could still be considered the first of a third wave down — though the wave form doesn’t really support that view IMO.   Breaching 1598 increases the odds that the above mentioned drop is complete, and that SPX is more likely to retrace deeper than was otherwise expected.

    From a harmonic standpoint, a reversal at 1560 instead of 1553/1555 feels incomplete.  So does the push back through the red channel midline without a last tag on the bottom.  But, as we discussed yesterday, this market is highly susceptible to manipulation.  A just in the nick of time 25% GDP miss — on the 3rd estimate mind you — is evidence enough. The fact that it happened in the futures markets reinforces the fact.

    Of course, all this matters only if you believe in Elliott Wave theory.  A quick reversal back below the red channel line — while leaving wavers crying foul — could still favor our original target of 1553/1555.

    The reversal at 1661.91 and subsequent drop to 1622 and later 1598 is a great example of maintaining downside momentum after the (seemingly) spoiler rally on June 3/4.

    UPDATE:  10:56 AM

    SPX is all dressed up and has no place to go.  Having broken through resistance on an obvious ramp job, it’s now having trouble finding true believers in the cash markets to take it any higher.

    It dipped below 1598 and might even re-test the TL from the 2000 and 2007 tops at 1594.20.   The little purple channel below is speculative, but is the best I can come with at the moment (I’ve revised the purple channel from the one posted here at 10:33 as I think this one is more likely if SPX can hold 1593 in the next 30 minutes or so.)

    Note the clear path to the purple 1.272 at 1608.64 and the 1.618 at 1621.78.  If SPX exceeds that level, there’s a gap to be filled at 1629.22 which would constitute a backtest of the broken purple channel (from 1343 in Nov 2012) as we discussed yesterday.

    The purple channel could easily be part of a larger channel such as the white one shown below.  Its midline crosses the white Point B at around 1632 late today or early tomorrow — so that might be too aggressive a goal without more Fed lighter fluid on the fire.

    While we’re waiting for that drama to play out, I’m going to return to the gold charts I almost finished last night (ran out of toothpicks to keep my eyes open.)

    After posting that, I’ll return to detail the changes to our equities forecast we began discussing yesterday.

    UPDATE:  3:35 PM

    Just posted the gold update HERE.  We’ll continue with the equities forecast.

    continued for members(more…)

  • Charts I’m Watching: Jun 25, 2013

    For those interested in the new fund, I have added a page to the website where you can sign up for news and updates.  Because the offering will be a private placement, you will be asked to affirm that you are an accredited investor* before being able to register.  

    Please note that pebblewriter.com members will be given priority (first come, first served) for the 100 slots I plan to offer.  To sign up, CLICK HERE.  If you received an email update on June 20, there is no need to register again.  If you have signed up since June 20, you will included in the next update going out later this week.

    In conjunction with the offering (and because it’s long overdue) I am planning a road show in late July or August.  Domestic stops will most likely include NY, Chicago, Atlanta, Miami, Dallas, Denver, LA and SF.  I’ll provide dates as soon as the schedule firms up.

    * we are still working on a means by which non-accredited investors may participate — details later.

    *   *   *   *   *

    As discussed yesterday afternoon, the rally is on.  Our scenario is playing out as expected so it will be safe to be long on the opening.  Once SPX reaches that cluster of upside targets [see: 3:10 update], watch for a swift downdraft to our 2nd downside target.

    DX will be under pressure initially, but should resume its push after fleshing out the little corrective channel.

    EURUSD’s backtest of the broken channel line could theoretically get as high as 1.3178, but — like DX — it seems to know this is a head fake and doesn’t want to get caught rallying for no good reason.

    UPDATE: 10:18 AM

    At 1588.31, SPX came within about 3 points of closing the gap at 1591.17 from Friday, and is doing its best to shake out the weak hands before doing so.  Note that we’re within striking distance of our other targets [yesterday’s post: 1:45 update]:

    The midline of the red channel (the one I’m expecting to play out) intersects with the midline of the more bullish white channel at 1593 or so, and a move to that level would close the gap at 1591.17.

    Also, 1593.77 is the .618 of the same pattern where the .786 was 1568.38.  A retracement from the .786 to the .618 is quite normal, even when the eventual move is to the .886.  And, of course, 1593.98 is a .886 retracement of the drop from Friday’s high.

    Last, don’t forget about the white dotted line lurking behind the white .618.  This is the TL connecting 1552 and 1576 (the 2000 and 2007 highs.)  SPX obviously exceeded it in April, but fell back through as reported on Jun 20.  Today’s rally can legitimately be considered a backtest of it.

    This bump up is likely a corrective wave in pursuit of our goal set back on May 29.   It’s obviously coming much earlier than expected, following a rebound from 1598 to 1664 (versus our forecasted 1594 to 1668/1677.)

    As we discussed yesterday, the timing changes things a bit.  I am working on revising the forecast, and will hopefully post it later today (assuming we reach our target by then.)  continued for members (more…)

  • Charts I’m Watching: Jun 24, 2013

    I hope everyone had a great weekend.  Friday morning [see: Channel Tilting] we looked at the big picture, a breakdown through some key support levels — most notably the purple channel that guided SPX from 1343 to 1687 between Nov 2012 and May 2013.

    This continues to be the elephant in the room from a chart pattern standpoint.

    DX, EURUSD and SPX came very close to the target levels posted Friday morning.  I was looking for 83.075 for DX.  This morning, it reached 83.05 — just shy of the white .618 and purple .75 line.

    After breaking channel support, EURUSD almost reached its .618 at 1.3032.

    And, SPX acted pretty much as expected:

    I suspect it’ll reverse around 1598 and head down to 1580, then possibly to 1568 and finally 1553.  Don’t know if it’ll all happen today, but those are the key levels I’d be watching for.

    It rallied on the opening to reach 1599, then fell to 1578 before bouncing to close at 1592.

    This morning, we’re getting the next leg down.  SPX just arrived at our 1568 target, the .786 of the 1536 to 1687 rally.  It should at least pause here, and could get a nice Fib bounce (1577ish?)  The real target is 1553, though.

    I’ll play the bounce here at 1568.32, but with tight stops in the (quite possible) event that the bounce turns out to be nothing much.

    UPDATE:  9:55 AM

    Just got stopped out on the interim long position, reverting to full short here.

    BTW, if 1568 sounds familiar, it’s because we talked about it on Jun 17 as the initial target in the downside scenario [see: This Time Really is Different – members section.]

    The downside case is just a matter of degree.  At 1598, SPX recently retraced just shy of .618 of its rise from 1536 (Apr 18 low) to 1687.

    It also came within 4 points of the trend line connecting the 2000 top of 1552 and the 2007 top of 1576 — which is more of a bullish argument, really (looks like a backtest of an important TL.)

    In any case, a drop to the .618 indicates the potential for either a Gartley, Bat or Crab Pattern — which would complete at 1568, 1553 or 1442 respectively.

    Now that we’ve reached our initial target and are closing in on our second, we’ll update and review this scenario.

    continued for members

    (more…)

  • Channel Tilting

    A reminder to subscribers… I am taking early tomorrow morning for a long weekend off for a long weekend (my first day off in about a year I’m told.)  So, my last post will be prior to the market opening.  I’ll be with you in spirit.

    *  *  *  *  *

    The eminis are up about 8 points at the present time, about 3:00 AM EDT.  But, the market closed at another odd point from a harmonic standpoint.  So, I imagine things will have changed by 7 hours from now.

    I laid out several scenarios Wednesday afternoon.  SPX spent the afternoon in apparent pursuit of the most bearish one.   Among the support it broke today:

    • the purple channel bottom
    • the 1608 low
    • the 1598 low
    • the .618 of the 1536 – 1687 rise
    • the TL connecting the 2000 and 2007 highs

    While I pounced on a few bounce opportunities, they were mostly figments of my imagination.  Like Don Quixote, it would have been better had I kept my suspicions to myself.

    The most important market development today was the loss of the purple channel.  When channels break down, they usually don’t just disappear.  They tilt.  That is, a steep channel gives way to a less steep one which morphs into a fairly flat one which eventually becomes a falling channel.

    Catching one of these in the early stages is the key to avoiding losses when markets turn.  For those who are wise enough to short such markets, it’s a great way to goose your returns.

    That has clearly happened with SPX.  Consider the red channel inside the purple channel from last November. It took SPX on a wild ride between Apr 18 and May 22: up 10% in about a month.  It died at the top of the purple channel on May 22 and I was confident in going short at 1687 when it did.

    The purple channel itself is also a subset of a larger channel, seen below in white.

    Here’s a view from a little further out…

    We could keep pulling back, but I’m sure you get the picture.

    In fact, channels with the same slopes keep showing up over and over within the larger patterns, as is seen with the purple channel from 2009 – 2011.  That channel breaking down was one of the factors that helped me nail the crash in July 2011.

    I mention these things because the purple channel from 2009-2011 is the exact same slope as the more recent reincarnation that broke down yesterday.  This is no guarantee of a tilting to the white or any other channel in the near future.

    Bernanke could put a stop to the current meltdown (at least temporarily) with a simple phone call to the WSJ.  But, these are things I look at when I’m forecasting.  And, they’ve worked pretty well so far.

    UPDATE:  9:20 AM

    The eminis dipped overnight but are back to up 8 pts.  But, DX has broken through resistance at the channel midline and is likely on its way to 83.075.

    And, EURUSD has broken channel support.

    SPX might bounce up to retest 1598.  Additional resistance is at 1606, then 1624.

    But, I suspect it’ll reverse around 1598 and head down to 1580, then possibly to 1568 and finally 1553.  Don’t know if it’ll all happen today, but those are the key levels I’d be watching for.

    I’ll post later tonight.  Good luck to all.

  • Charts I’m Watching: Jun 20, 2013

    Fund Note:  emails have now gone out to all members who asked to be added to the distribution list for information on the new fund.  If we somehow missed you, please CONTACT US.

    *  *  *

    Investors around the world were apparently shocked to hear Bernanke repeat what he and other Feds have been saying for months: they’ll likely cut back on bond purchases if the unemployment picture improves.  Talk about risk-off…

    Between that acknowledgement and the recognition that things aren’t so rosy in China, markets have continued to sell off broadly overnight, with the eminis currently down to the purple channel bottom at 1608. For more on China, check out Zerohedge’s great articles starting with THIS ONE.  For more on the Hindenburg Omen recurrence, check out Albertarocks’ excellent coverage HERE.

    The two previous dips have exceeded the channel bottom, so the important issue is whether or not we get a bounce here.

    The dollar obviously did, as expected, reverse at the .707 Fib.

    But, it should find tough resistance at the intersection of two channel midlines and a .618 of the 84 to 78 slide.

    SPX fell to our 1633 target toward the end of the session, but the bounce didn’t hold.  This morning, it appears very likely that SPX will join the eminis at the purple channel bottom which, once again, becomes the line in the sand. 1608 is an important previous low for bulls to hold.  The critical level is 1593.

    I will short on the opening, but be prepared to switch sides once there.

    UPDATE:  9:36 AM

    The decline appears to be slowing as we approach 1608 — the previous bottom and the red TL from 1994/2002.  Bulls should take a stand here, so I’ll play a bounce at 1608.

    Just tagged 1608.34, which is good enough for me.  Full long here with obviously very tight stops.  For additional support, we have the red .886 at 1604.61 — though these patterns are already quite messy.

    As long as 1608.07 holds, this can be characterized as a very deep retracement of the rally from Point C.  Any breakdown and that pattern loses all credibility.  Either yesterday’s 1654.19 high becomes our new Point B or, if 1598.23 is taken out, we’re looking for a new Point A altogether.

    We have several important economic reports coming out at 10am:

    Judging from the market’s skittishness, I would imagine that poor results would bolster investors’ expectations re the Bernanke put.  But, I suspect the PPT is standing by just in case…

    UPDATE:  10:05 AM

    Apparently the NAR didn’t get the memo, and reported very strong results: +4.2% to 5.18 million units. This won’t help the bounce.

    The Conference Board is playing ball, however, with a 0.1% increase versus 0.2% expectations — perfect for the “bad news is good news” paradigm.  But, is it enough to offset the rosy housing numbers?

    Oops… the Philly Fed’s survey numbers were very positive — also a negative for a market addicted to QE.

    Needless to say, a drop through 1598 would change everything — as opposed to the many things that will change with a drop through 1608.07.  Coming up, our revised forecast with the three most likely scenarios.

    continued for members(more…)

  • Update on DX: Jun 19, 2013

    A quick overview of the dollar in the hours leading up to the FOMC announcement at 2pm this afternoon…

    DX has declined from 84.595 to this morning’s low of 80.64 in a well-defined channel dating back to the May 22 S&P high of 1687 — which means it was positively correlated for the 1687 to 1598 drop, but has reverted to a more typical negative correlation since then.

    This explains the recent stall at the bottom of the purple channel, seen better on the 4-hr chart below.


    Does it mean the downside has completely run its course?

    continued for members(more…)