Hint: it’s the same reason the “market” hasn’t corrected much at all for the past six weeks. And, no, there’s no free lunch involved.
The day started with some tragic news out of Brussels. ISIS terrorists attacked innocent civilians at the airport and a metro station, killing dozens and wounding hundreds. Brussels is the de facto capitol of the EU, so the attack understandably sent investors scurrying for cover. Only, it didn’t last — thanks to crude light (CL.)
For those who weren’t watching, CL spiked almost 3% in about 90 minutes on absolutely no news whatsoever. Why? Because, stocks were selling off. That’s it. If you don’t believe me, read on.
 SPX had dropped almost 10 points (0.5%) in the first 5 minutes of trading. This took it directly to a trend line connecting the last two lows (3/16 and 3/22) seen below in red. It dithered here for a few minutes, then broke through the TL and started lower — seemingly to backtest a rising channel line or the 200-day moving average.
 But, at exactly the same time that SPX reached that trend line, CL swung into action. It reversed higher, pushing up through its short-term moving averages and, ultimately, through two falling TLs of its own. It didn’t stop until it had topped yesterday’s highs.
This would normally be highly unusual, given that CL had just broken down through a TL (from Mar 15) and reversed at a key Fibonacci level (the white .618 at 41.42.)
 But, it is most decidedly not unusual for CL, which has taken over from USDJPY as the single most influential driver of equity algorithms. Needless to say, SPX reversed back above its broken TL and went on to register new highs for the fifth session in a row.
How it Works
Want SPX to stop dropping, or even reverse higher? How about popping up through important overhead resistance? All it takes is a sudden spike higher by CL. The chart below illustrates how commonplace it’s been in the last few sessions. The first instance on the chart above was when CL gapped higher in order to get SPX up past its SMA200. There were many other instances when CL either reversed or at least propped up SPX (the yellow arrows.)
Occasionally, an intraday SPX backtest of a Fib is prompted by a CL drop. But, for the most part, CL’s drops are limited to after-hours — when S&P 500 futures are easily propped up in the light volume.
When the “market” reopens in the morning, CL has already been reset and is ready to spike higher all over again in order to support SPX for the next 6 1/2 hours. It’s been going on for months. But, it’s never been more obvious than since our bottom call on Feb 11 [see: USDJPY Finally Relents.]
The Unbroken Broken Channel
CL traced out a rapidly rising (white) channel from Feb 11 to Mar 14, at which point the channel broke down (the red arrow.) Normally, this would portend a reversal of some significance.
 This breakdown occurred as SPX had finally climbed back to its 200-day moving average — a 10.5% rally off its Feb 11 lows. Again, normally we’d see a significant reversal upon reaching major overhead resistance such as this. Combined with the CL channel breakdown, it looked like a sure thing.
Instead, it was limited to a minuscule 13 points. And, few traders would have had the nerve to participate. It came on a gap lower following a 3-day, 54-pt rally that saw SPX slice through the SMA100 without blinking and close above the SMA200 two days in a row. Why such a puny reaction? First, CL not only cut short its decline, it pushed back above its SMA20, SMA100, a TL from June 2015 and the midline of a channel from Oct 2012. Second, just for good measure, it even gapped right back into the channel from which it had broken down (the yellow arrow above.)
After already spiking 49.6% (in the face of obviously deteriorating fundamentals) between Feb 11 and Mar 11, this latest CL spike amounted to another 18.2% off the Mar 15 lows. In those five sessions, it lifted SPX a total of 51 points (2.54%), with each day seeing a new higher high.
What Happened Today
Though it’s not particularly unusual, today’s action clearly illustrates the manipulation going on. Note that CL broke down again from its rising white channel this past Friday. It seemed destined for a backtest of its 10-day moving average (at least) when it was pressed into duty to prop up SPX.
 It bounced around a bit while SPX found its feet, then zigzagged higher until SPX backtested a little H&S neckline (purple.) When SPX faltered there, CL suddenly popped up through a TL that had connected its overnight highs. With SPX threatening to reverse lower, CL suddenly broke out through a TL (white) that connected the highs made since last Friday. This drove SPX up over the neckline.
With SPX back on track, CL was free to fall back below the white TL. And, it was time for USDJPY to take over. 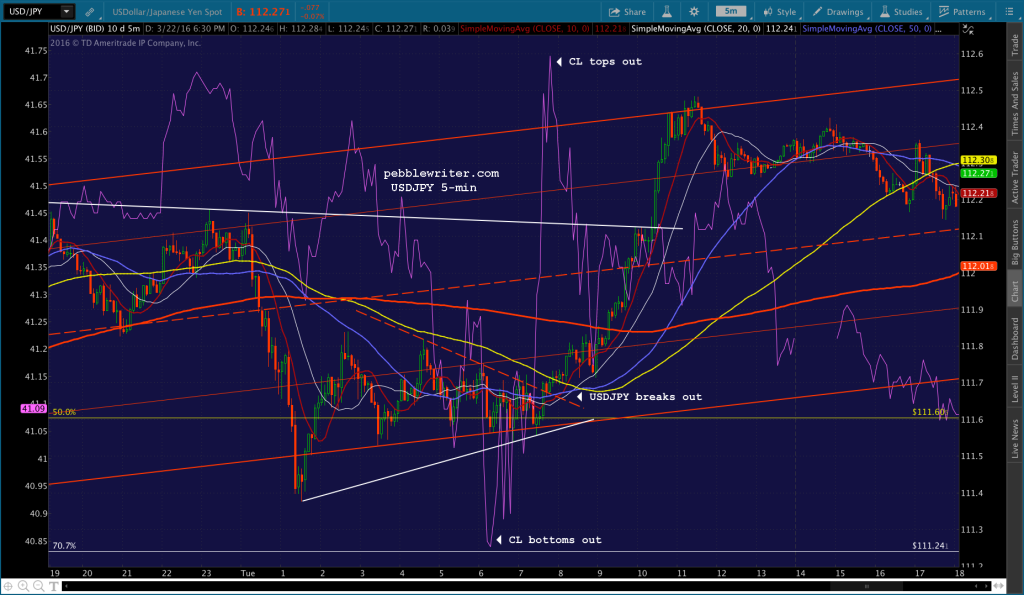
USDJPY had sprung to life just as SPX had reached the neckline, zooming back to the top of the channel whose bottom it had briefly broken as the terrorist attack hit the newswires. It was a strong 1% move in about 10 hours, and involved USDJPY breaking out through a TL (red, dashed) it had established overnight, and again through a TL (white) connecting Monday’s highs.
But, after reaching the top of the rising red channel, USDJPY had nowhere to go. With oil prices having increased so much over the past month, the Japanese need a strong yen to compensate — hence USDJPY’s flatlining since Feb 11 (there’s that date again.) SPX saw USDJPY’s predicament, and started back down — only to be rescued again by CL, which not so coincidentally maintained an uptrend until the close. At that point, it was free to reset — which it did. It’s not free to do it all over again tomorrow if TPTB deem it desirable.
What Now?
Speaking of TPTB, who’s behind this daily manipulation? Some blame the big banks, which have much at stake in the energy sector. I favor the central banks themselves, especially the BoJ. It has a huge equities portfolio. By my calculations, it costs about 5-10 cents on the dollar to prop up SPX with CL — a bargain if there ever was one.
I firmly believe that central banks colluded to crash oil in order to keep the yen carry trade alive. But, it got out of hand. Oil companies started suffering. More importantly (to the central banks, anyway) the banking industry started to suffer. There came a point (probably about Feb 10) that they decided it was time for prices to recover.
This was tricky, because with a terribly devalued yen (sky-high USDJPY) higher oil prices were a burden Japan couldn’t bear. This explains why USDJPY has repeatedly returned to the Feb 11 lows (a more valuable yen) while CL and, hence, SPX have soared.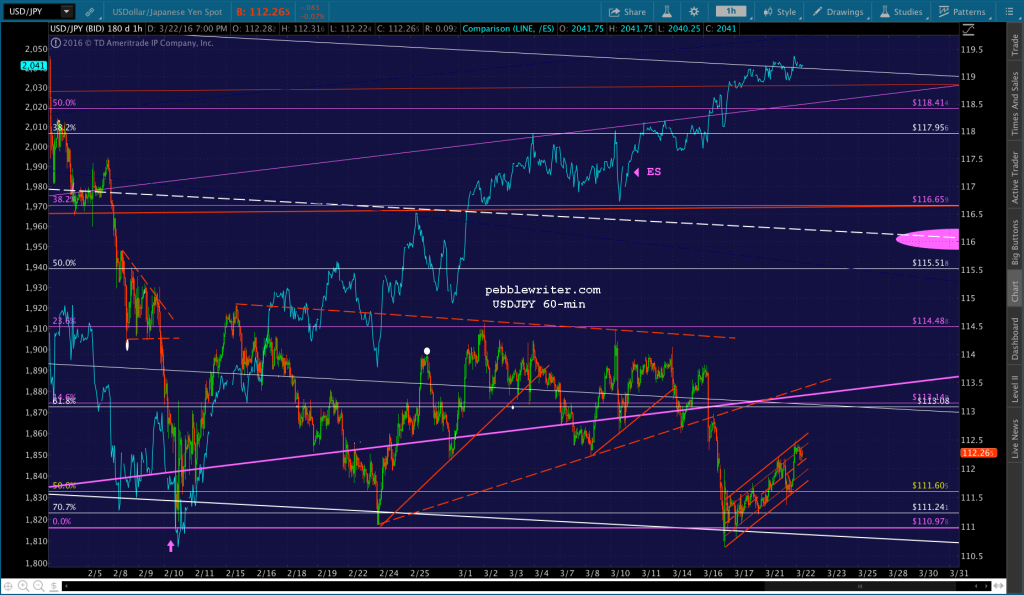 How long can this go on? It pretty much depends on us. The stock “market” has rallied nicely, which benefits those with substantial equity portfolios. But, the 64% spike in CL since Feb 11 amounts to a tax on everyone else. The average price of regular unleaded gas has risen over 18% since Feb, making a mockery of central banks’ relentless “we need more inflation!” mantra.
When rising gas prices are again deemed a problem, or start to show up in official inflation data, CL’s run will be over — not a moment sooner. At that point, look for the yen carry trade to return in all its glory. Or, maybe by then, the ECB will have established the euro carry trade. Or, maybe the whole steaming pile of crap will implode under its own weight.
As always, there will be winners (the “haves”) and losers (the “have-nots.”) Guess which constituency TPTB will bend over backwards to protect?


 The BoJ just announced that they would allow rates to move to as high as 0.5%, sending the 10Y soaring from 25 to 42 bps…
 …and the USDJPY plunging (yen strengthening) by 3.3% – below its 200-day moving average for the first time since Feb 2021.


