
Month: September 2026

  • Charts I’m Watching: Sep 30, 2026

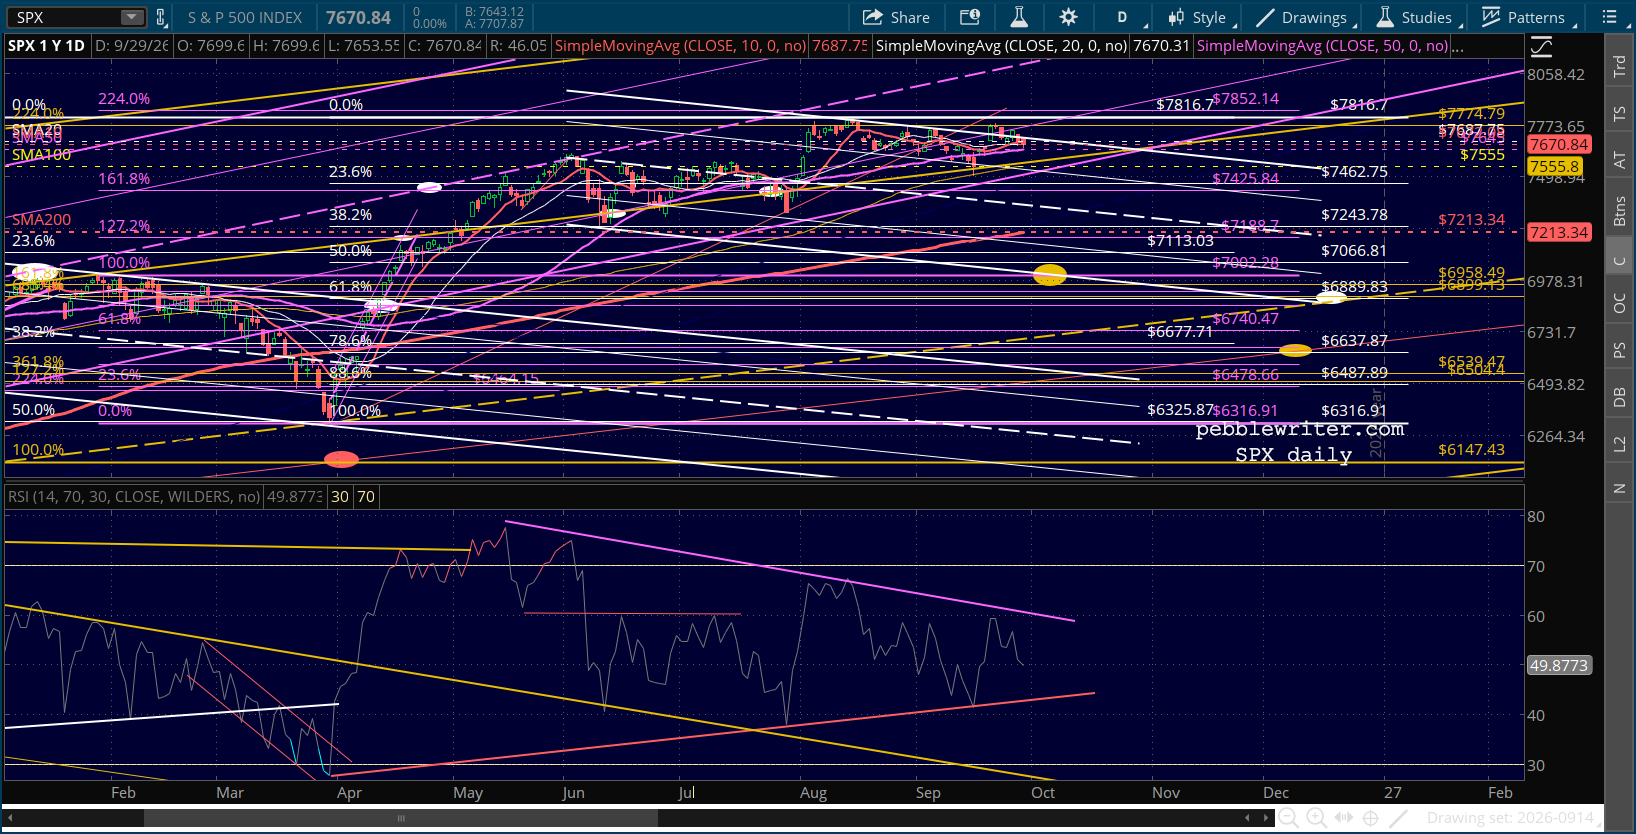
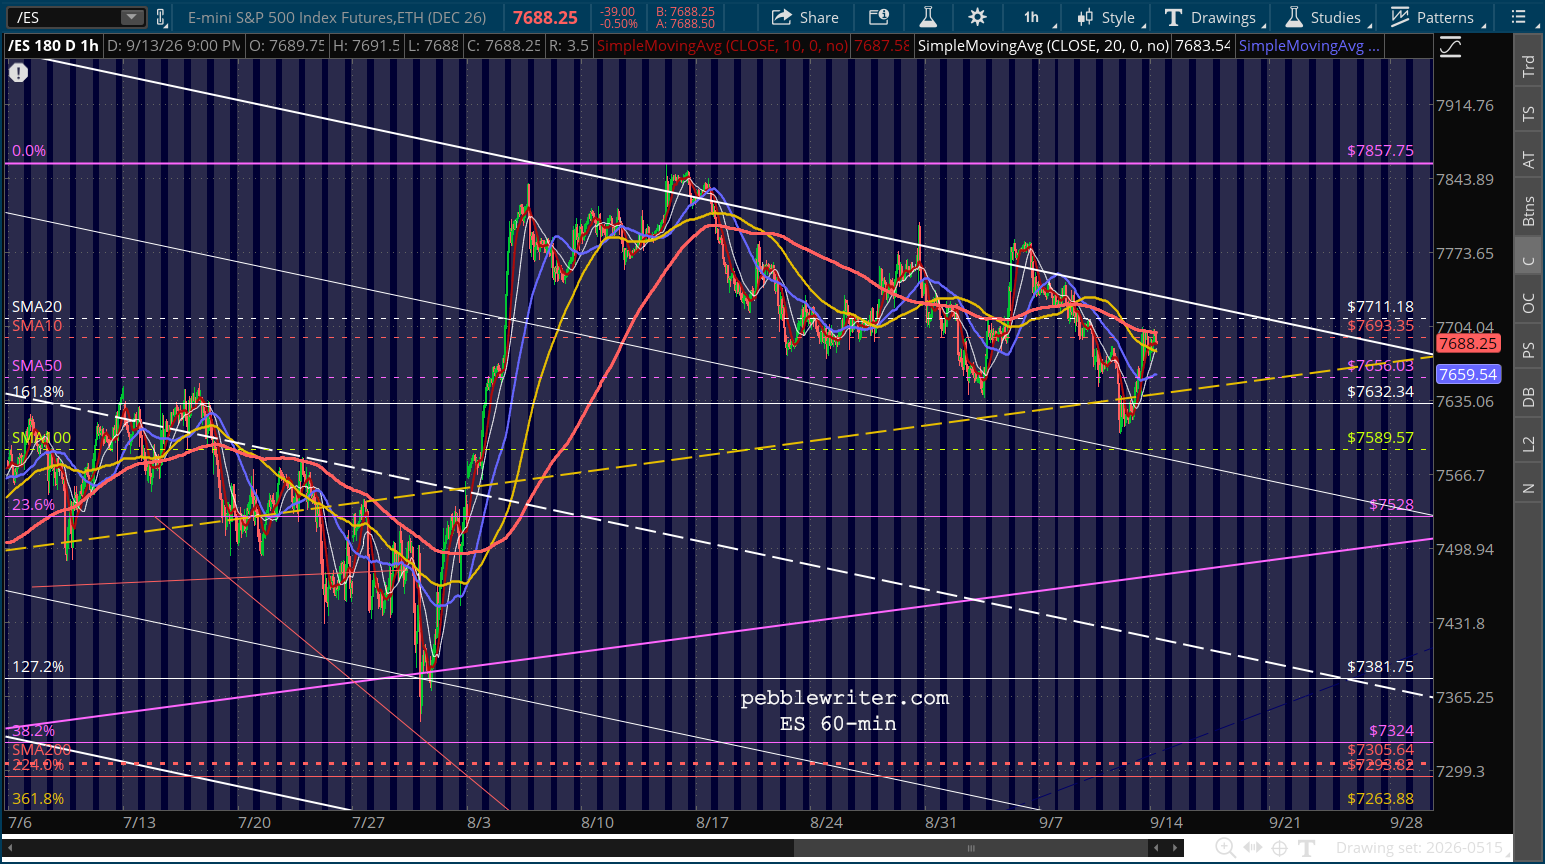
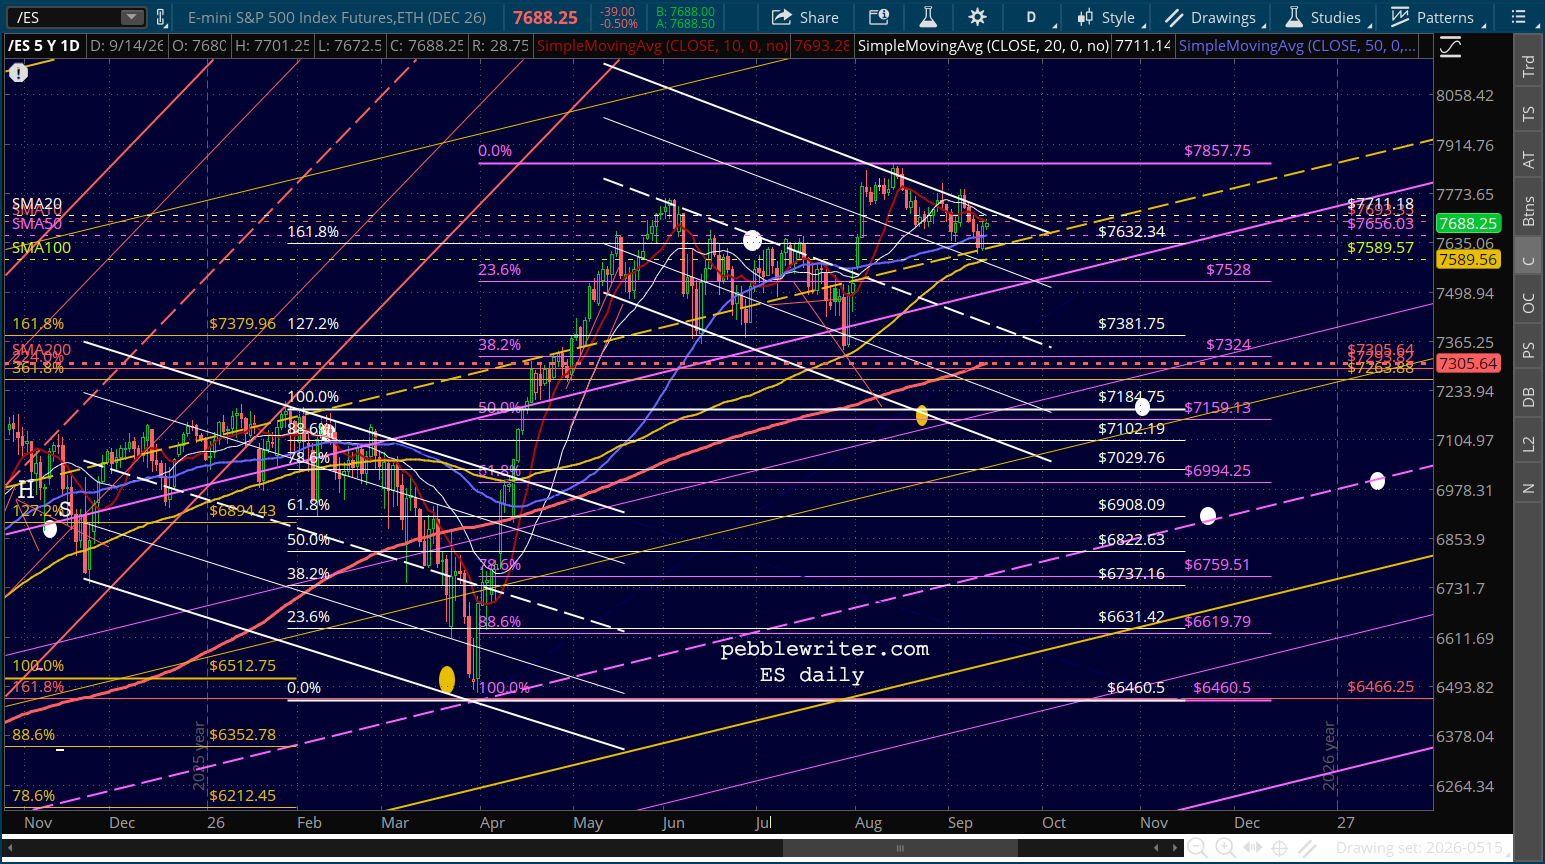
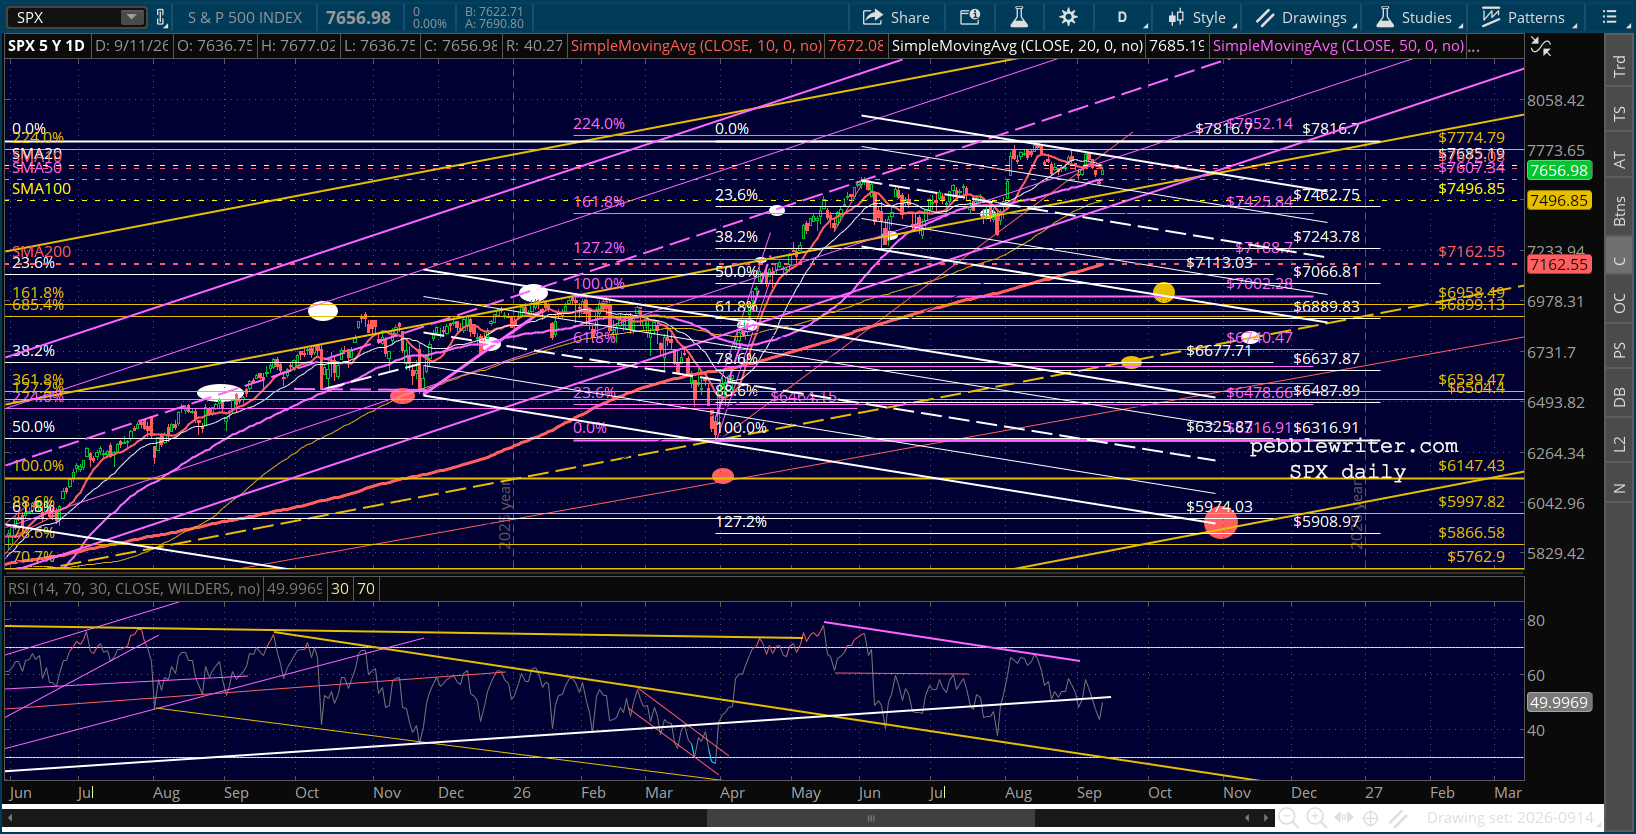
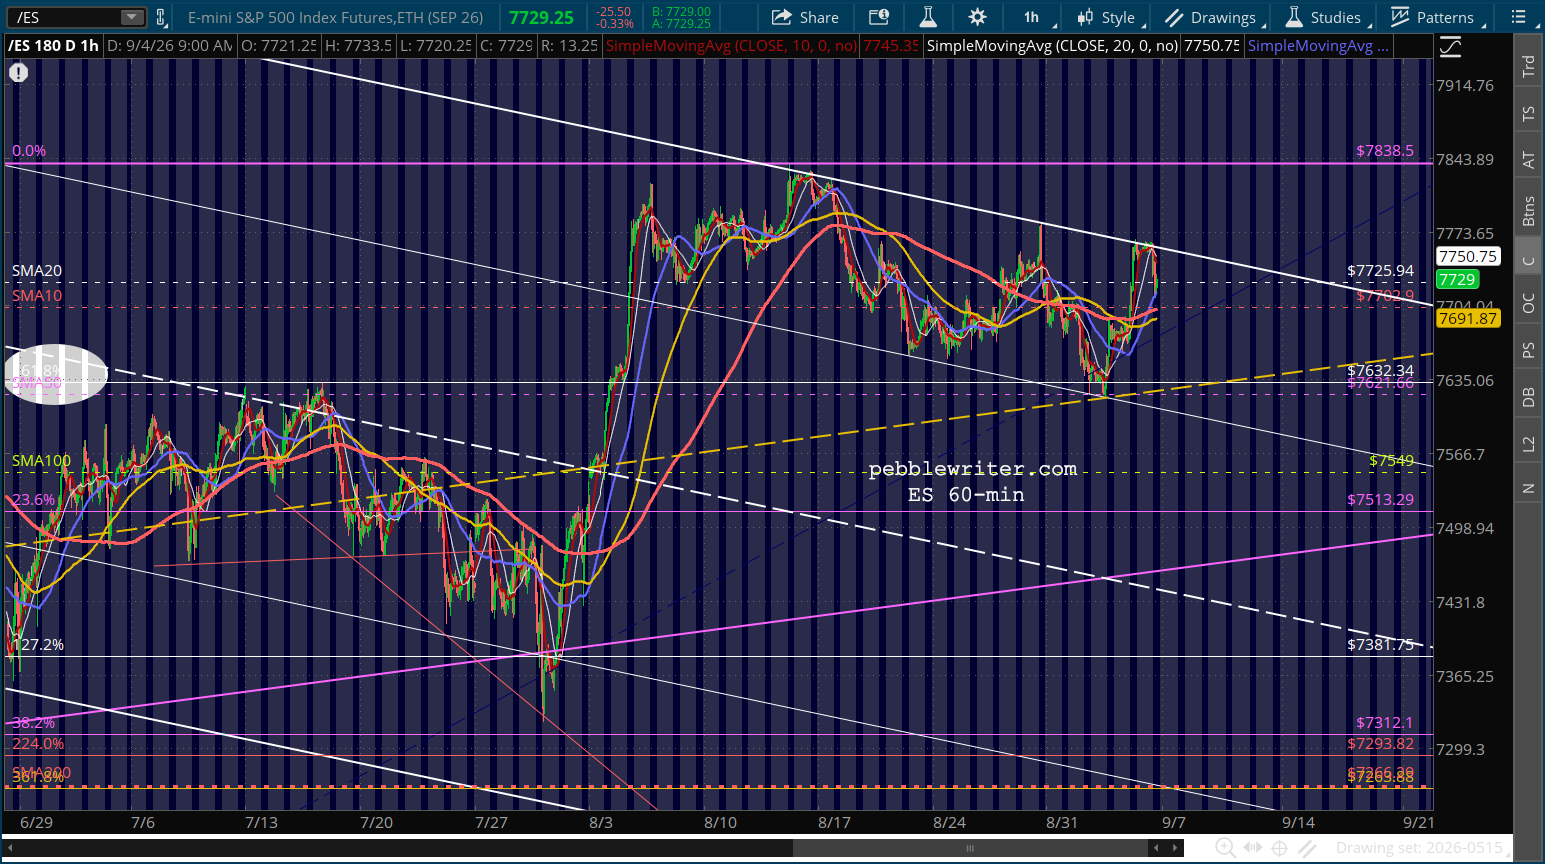
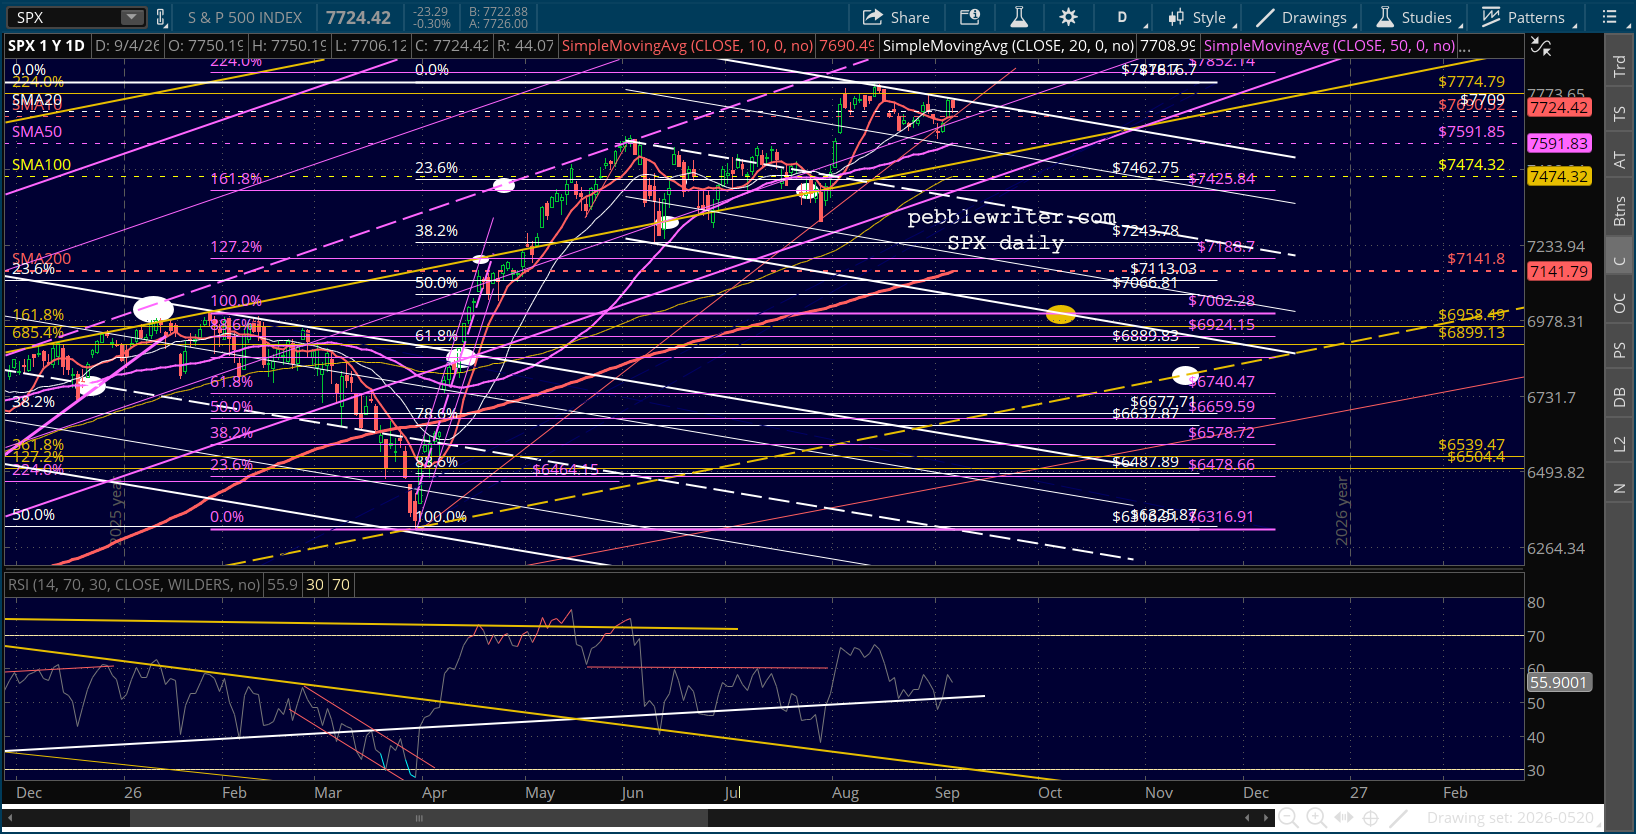
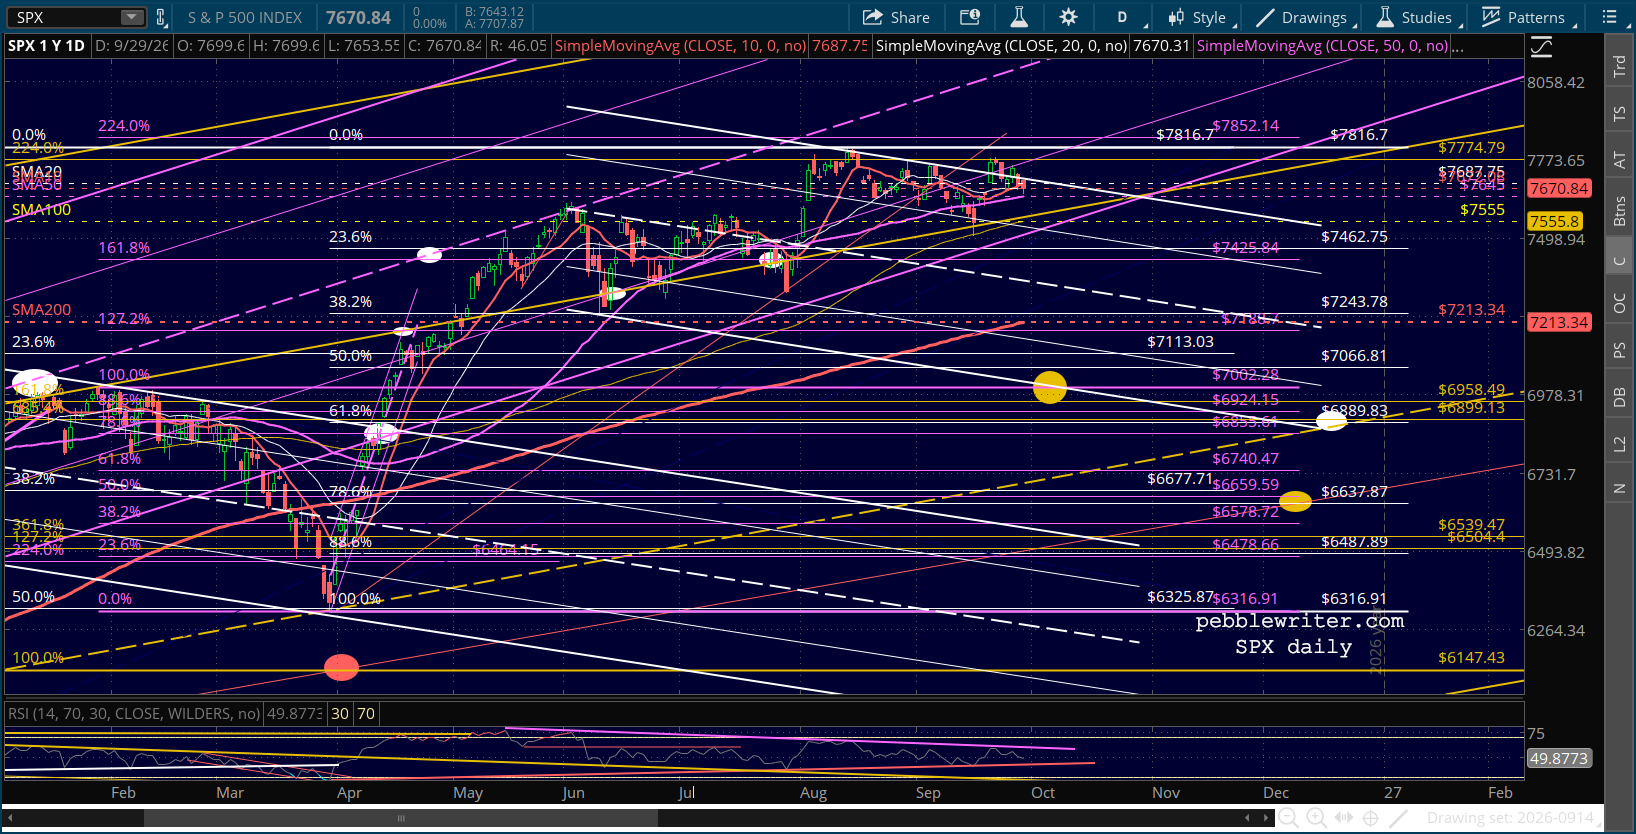
    Futures are up modestly this morning as equities settle back down following the Sep 21 spike.
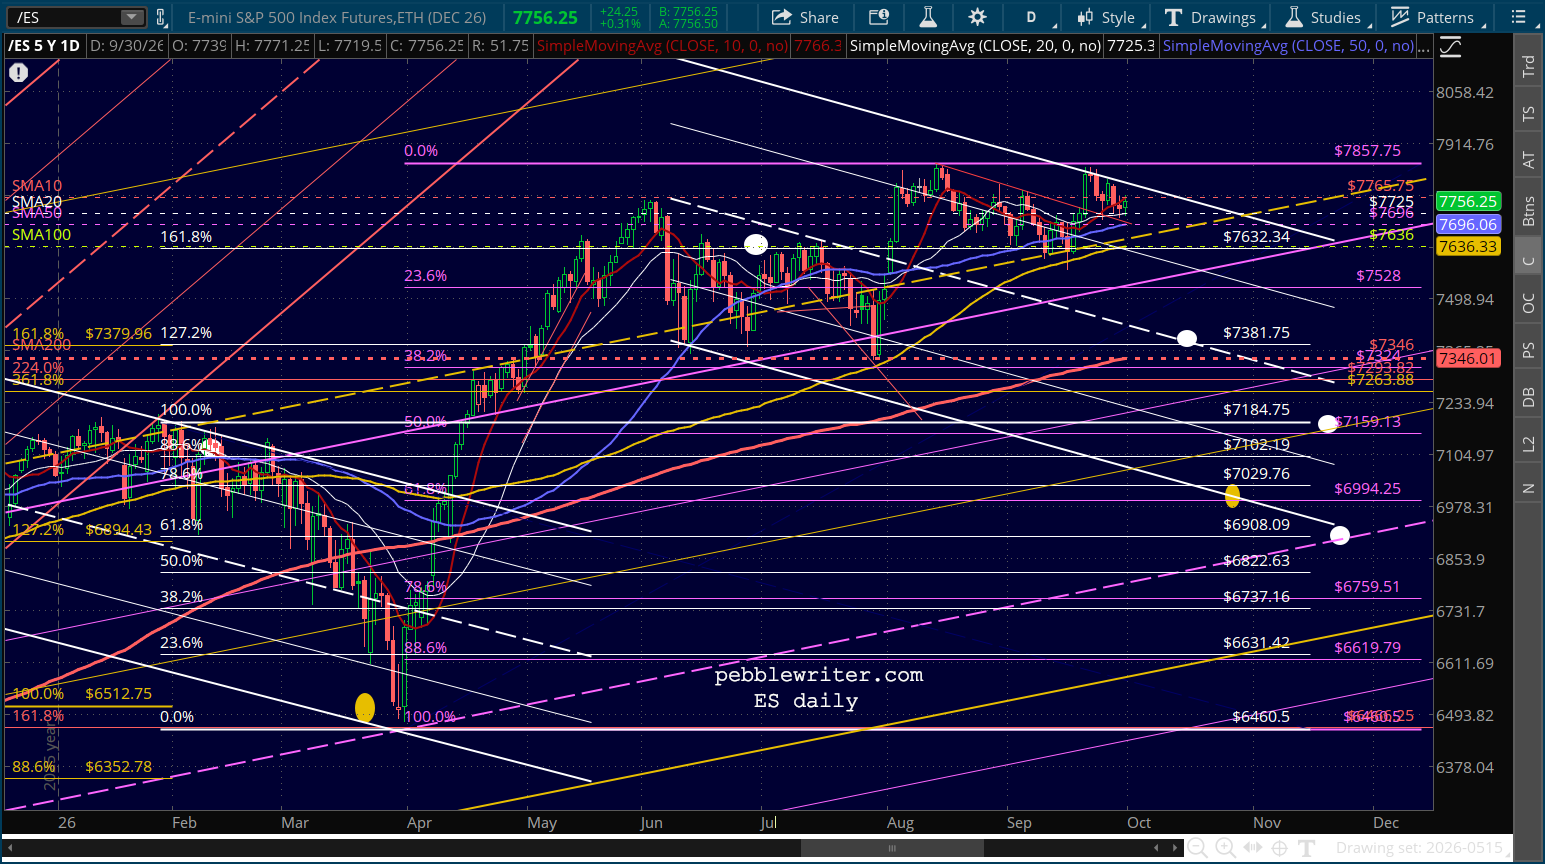
    The Aug 14 highs remain unbroken, though, suggesting that the Sep 21 spike was a headfake.
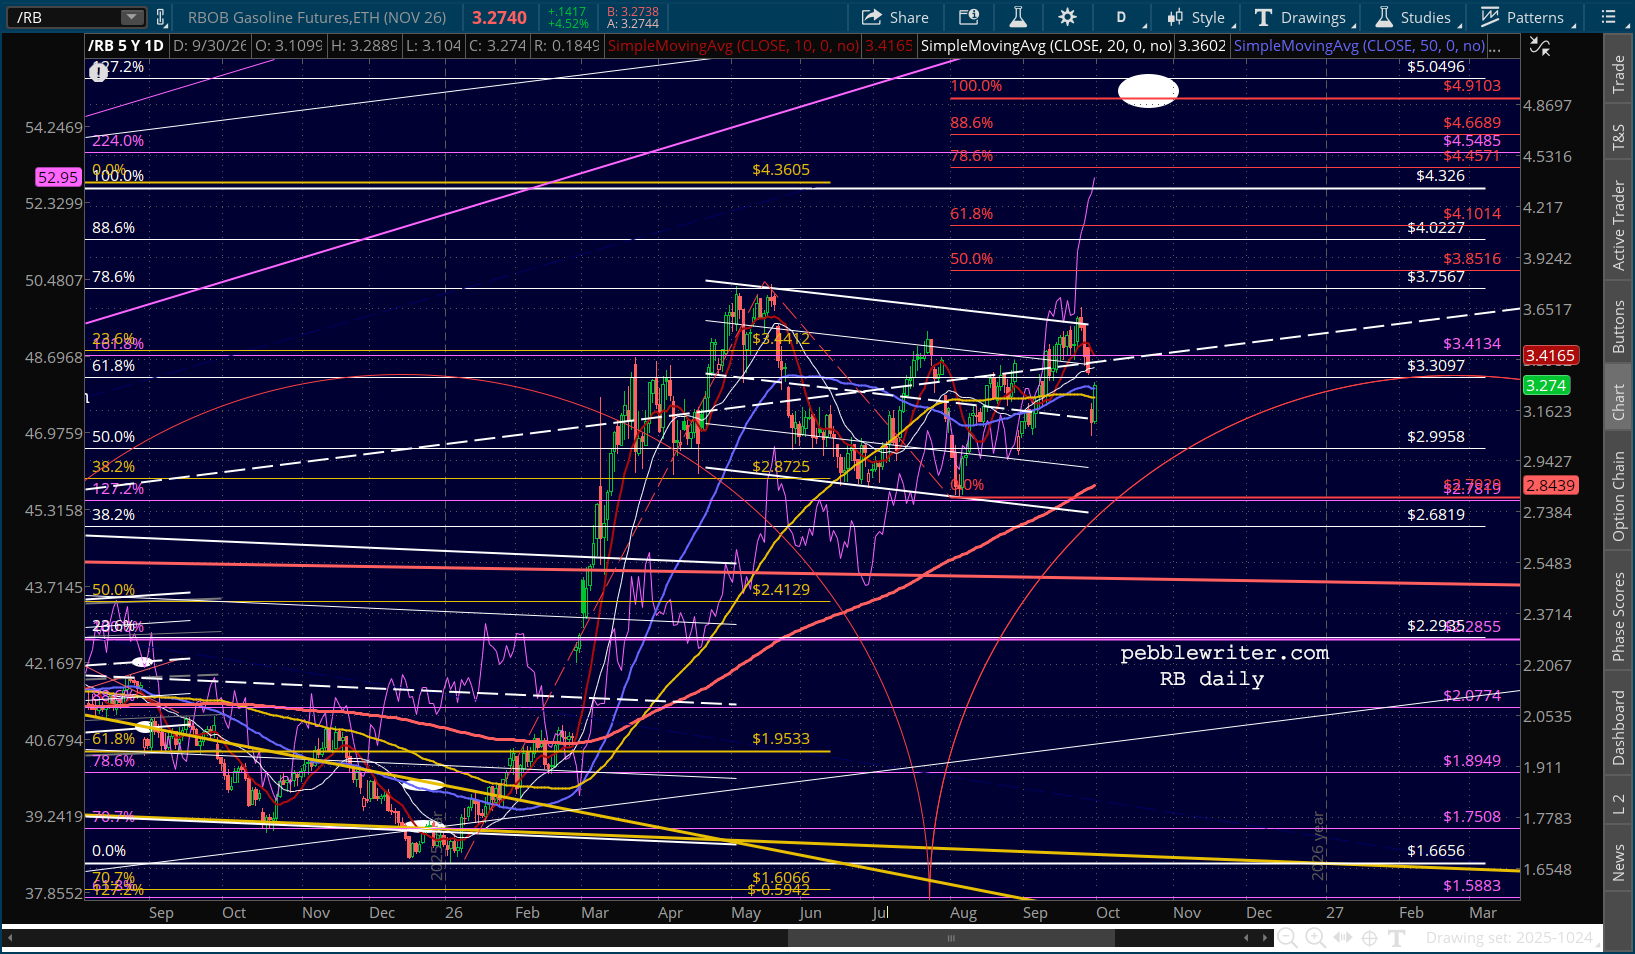
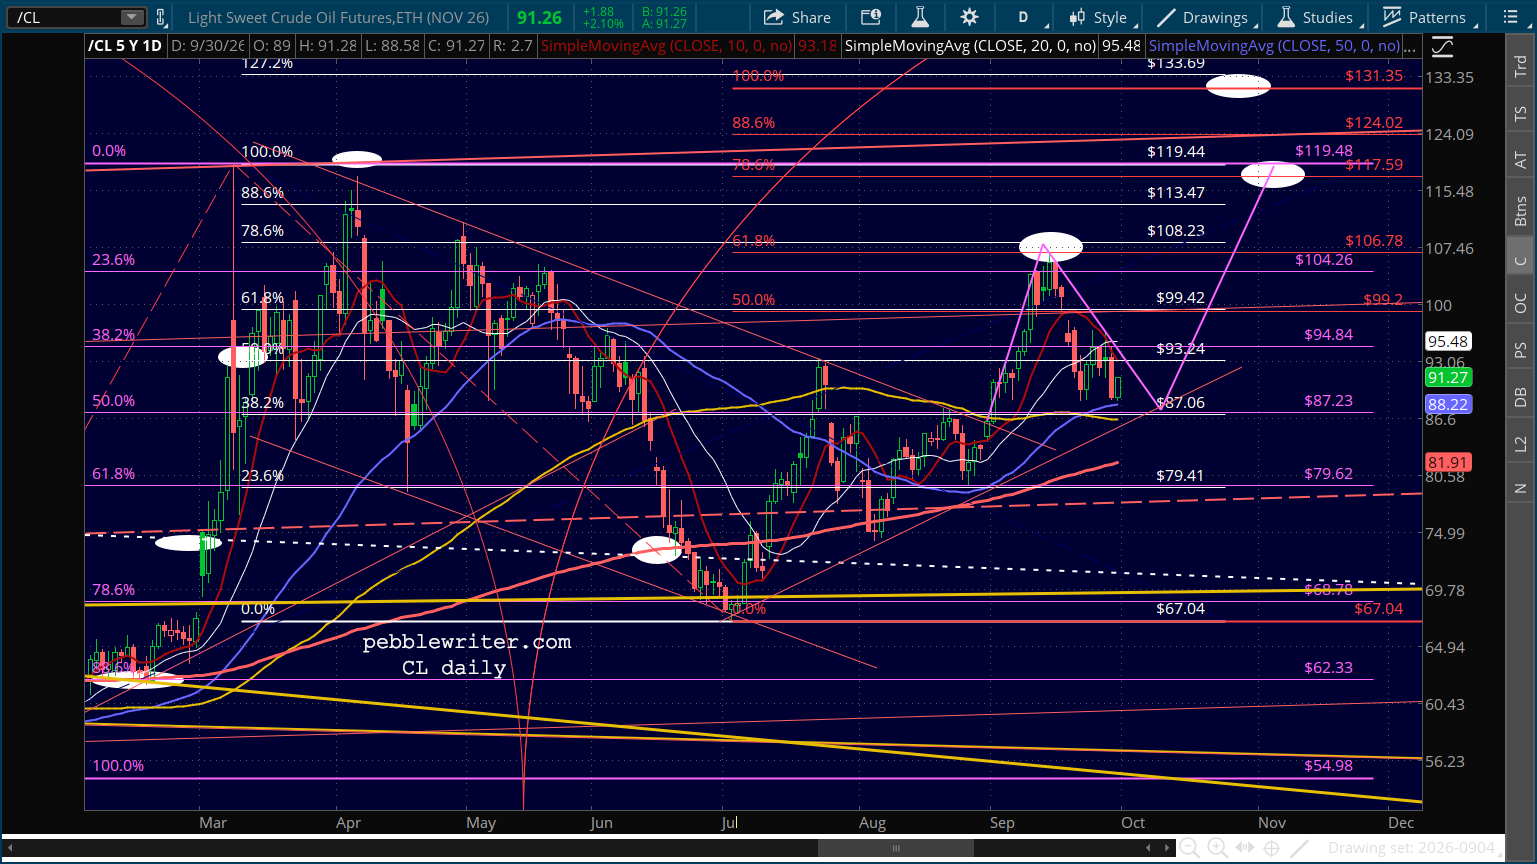
    The drivers remain the same: oil prices, which are closely following our forecast…
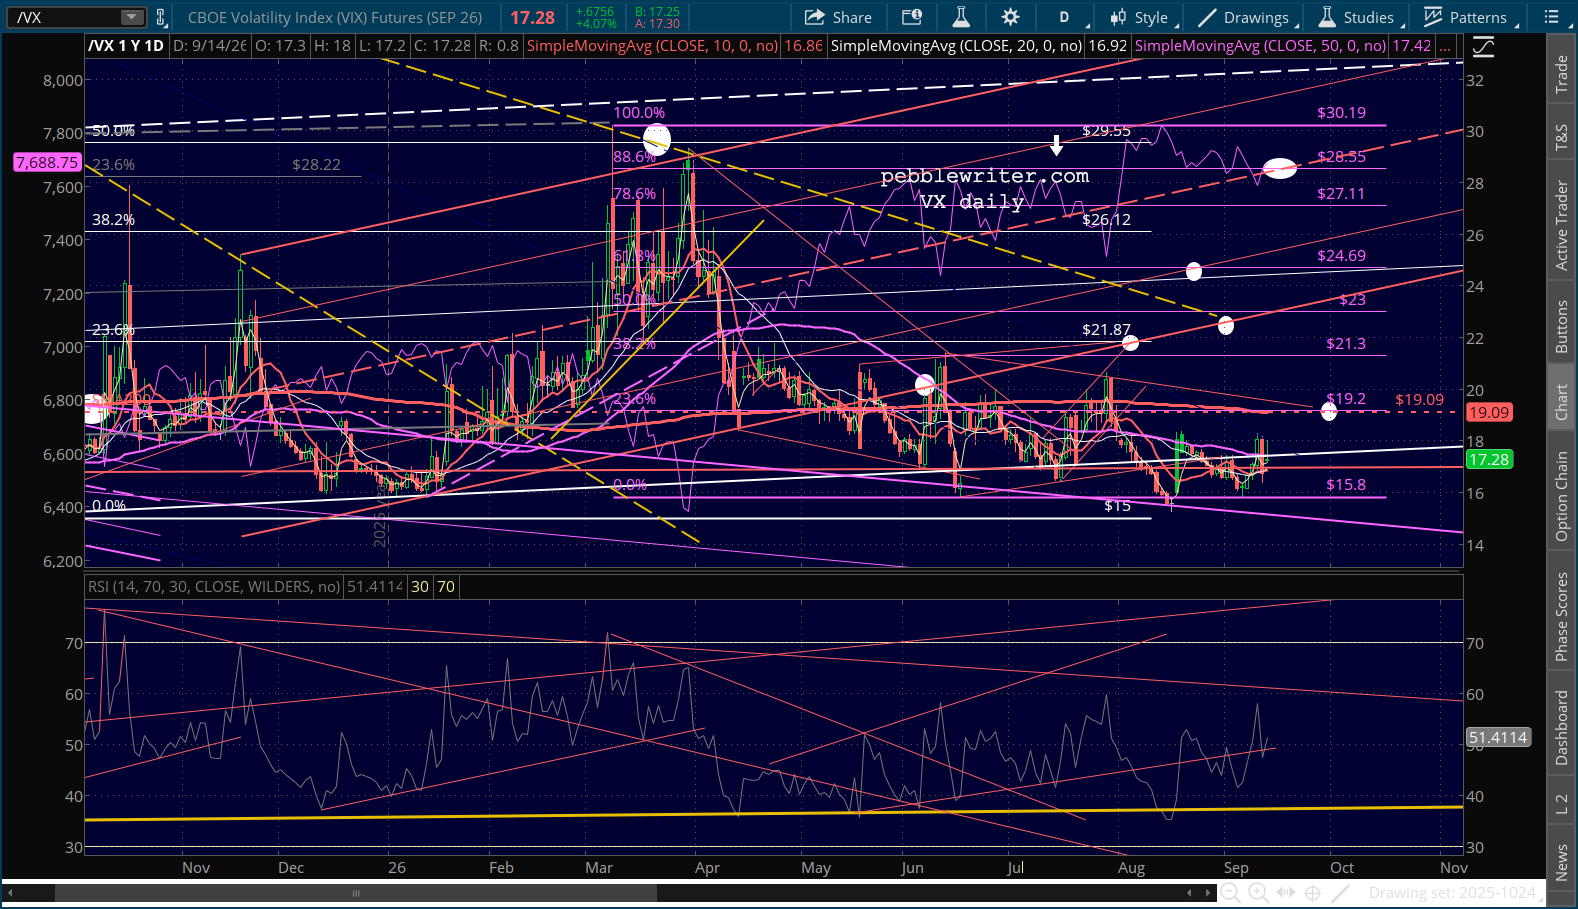
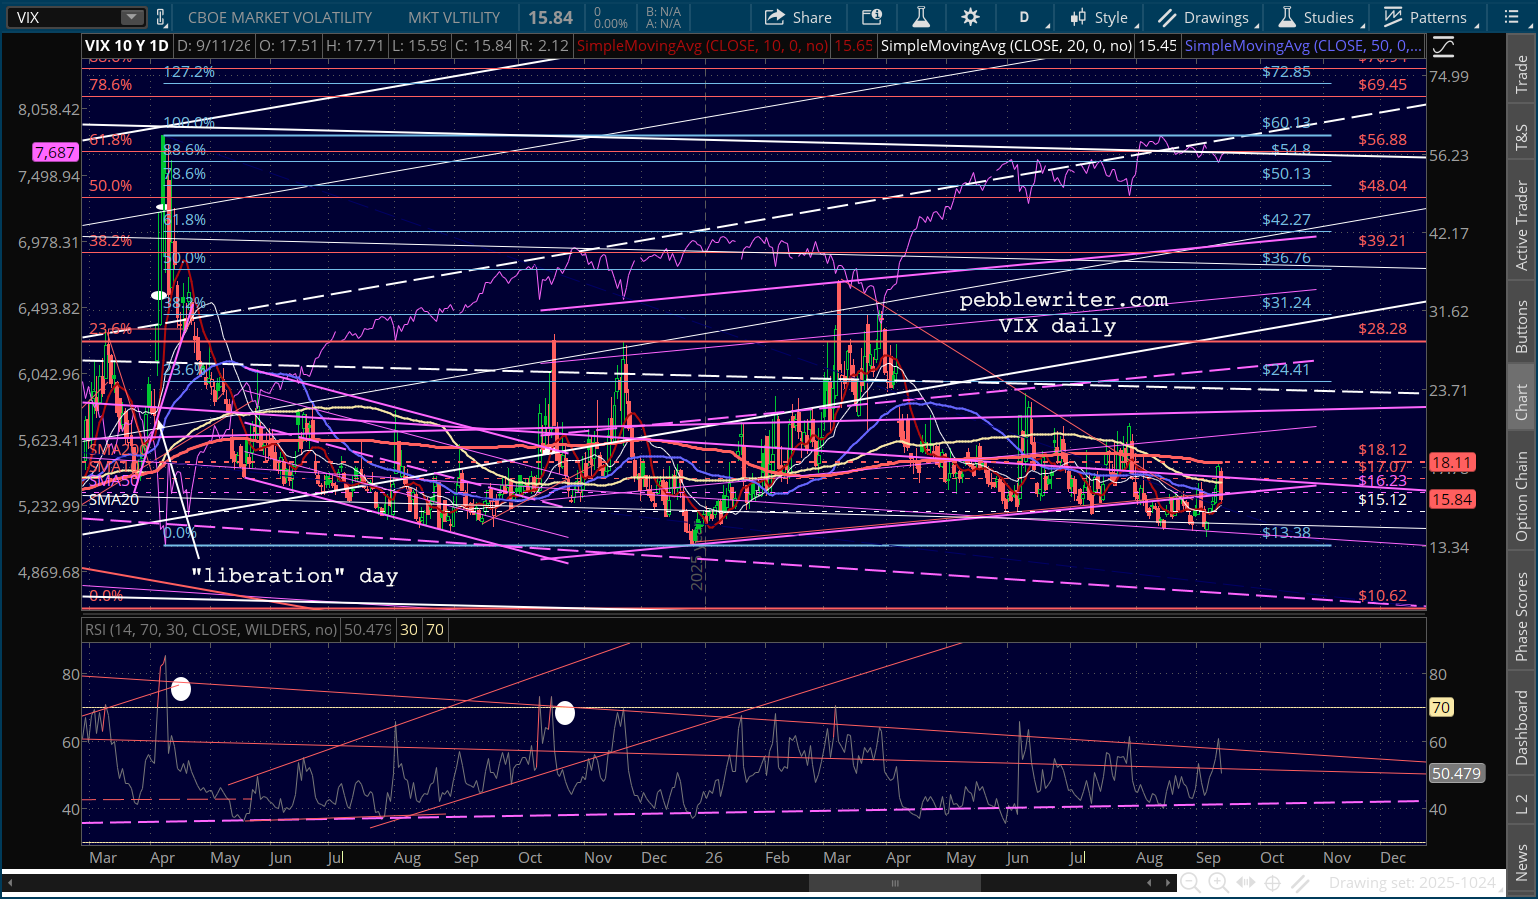
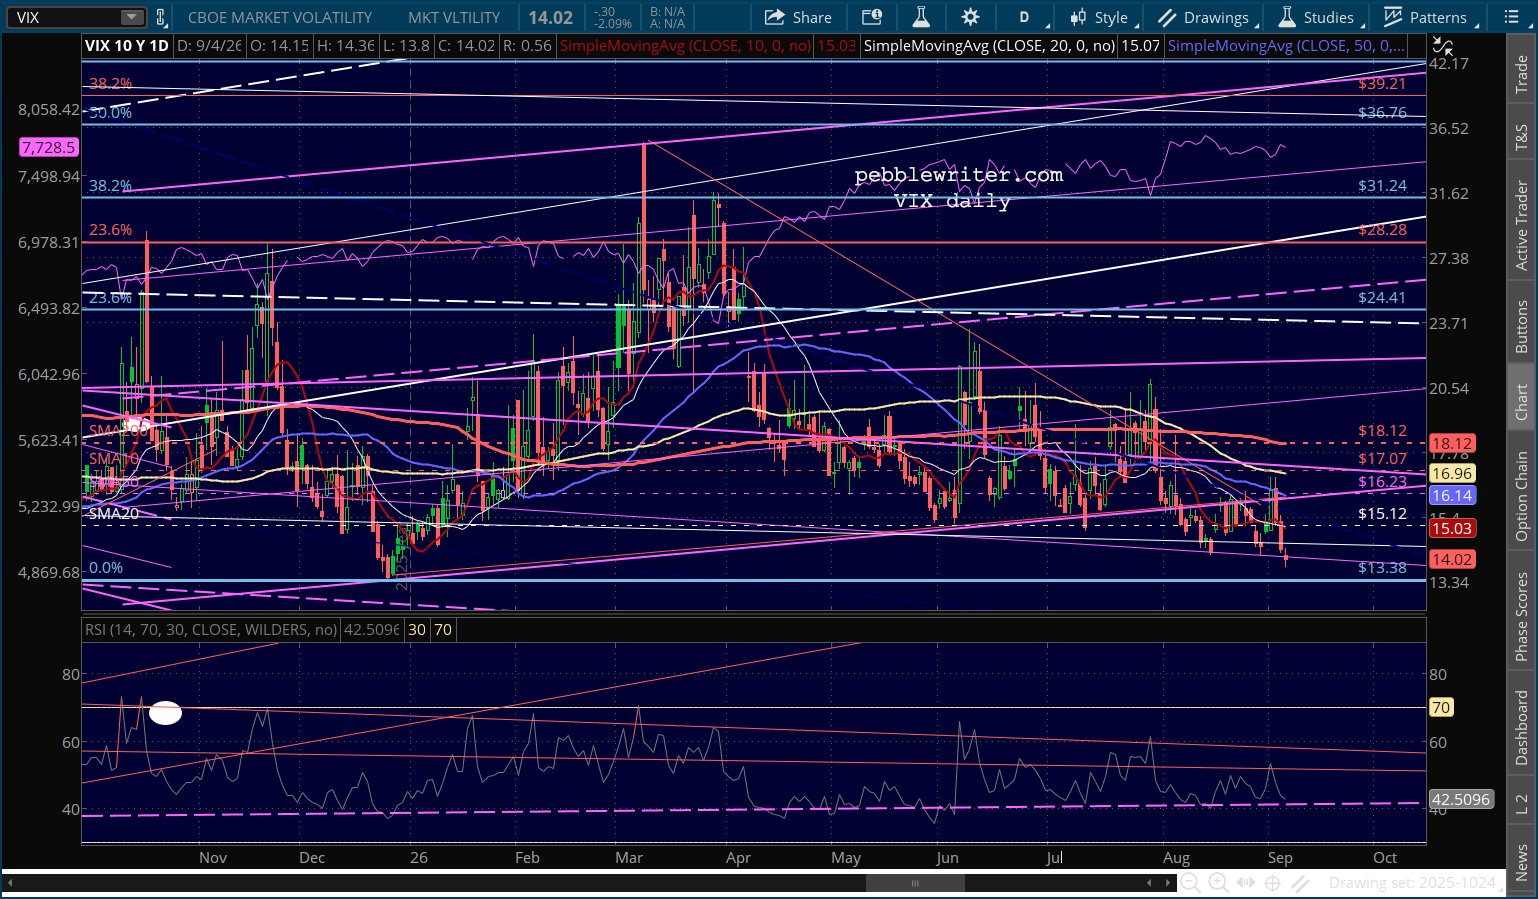
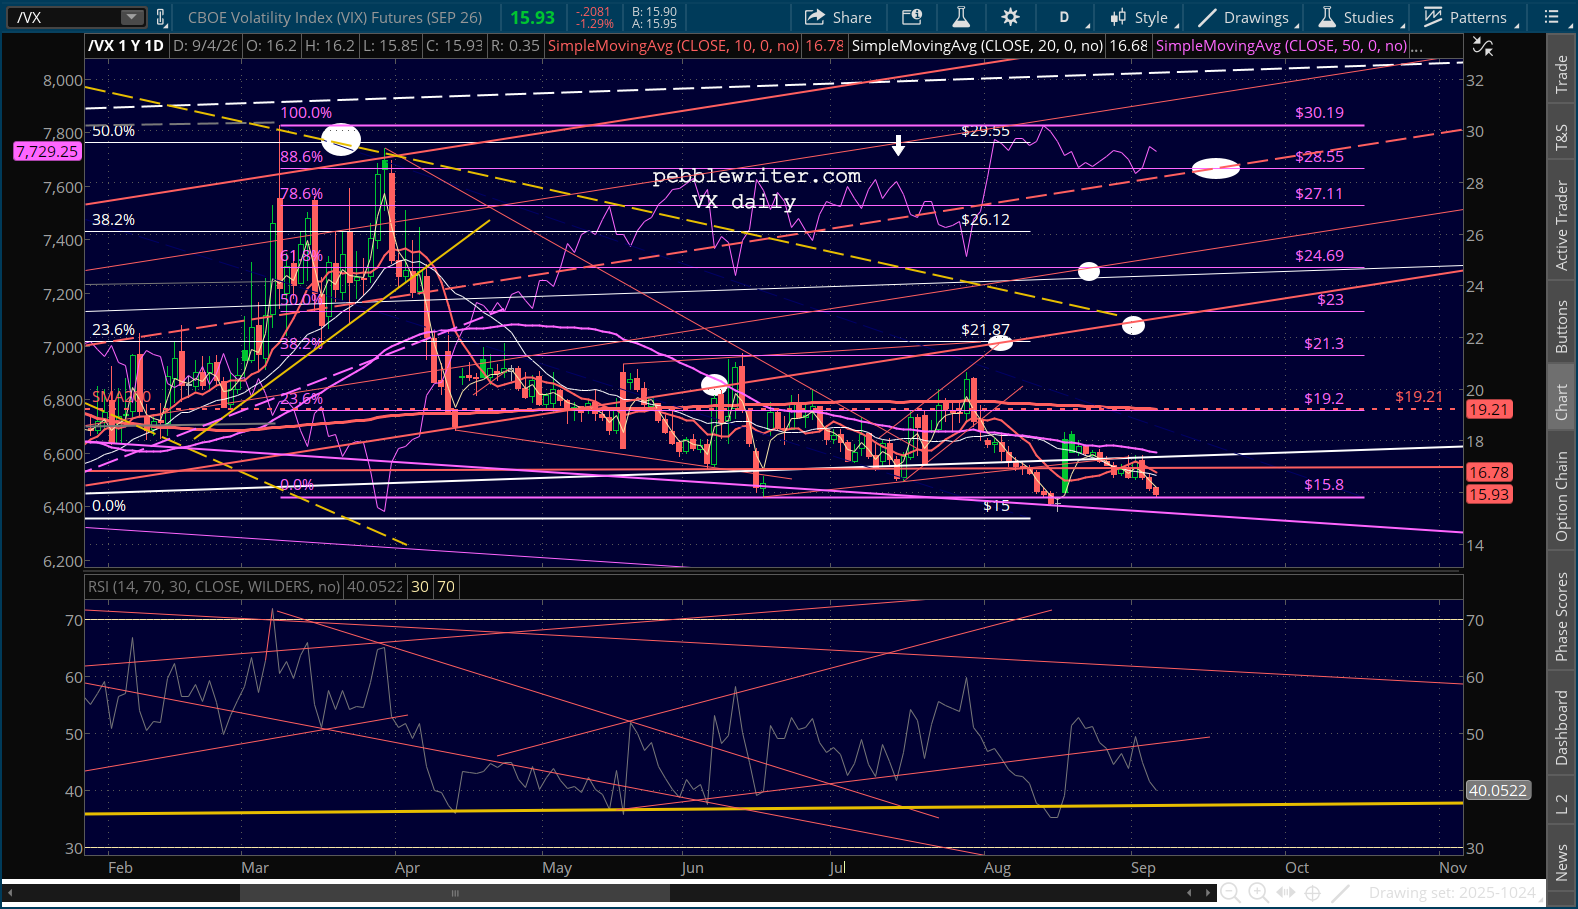
    …and VIX, which continues to be smacked down with every attempt to break up a trend line or its SMA200.
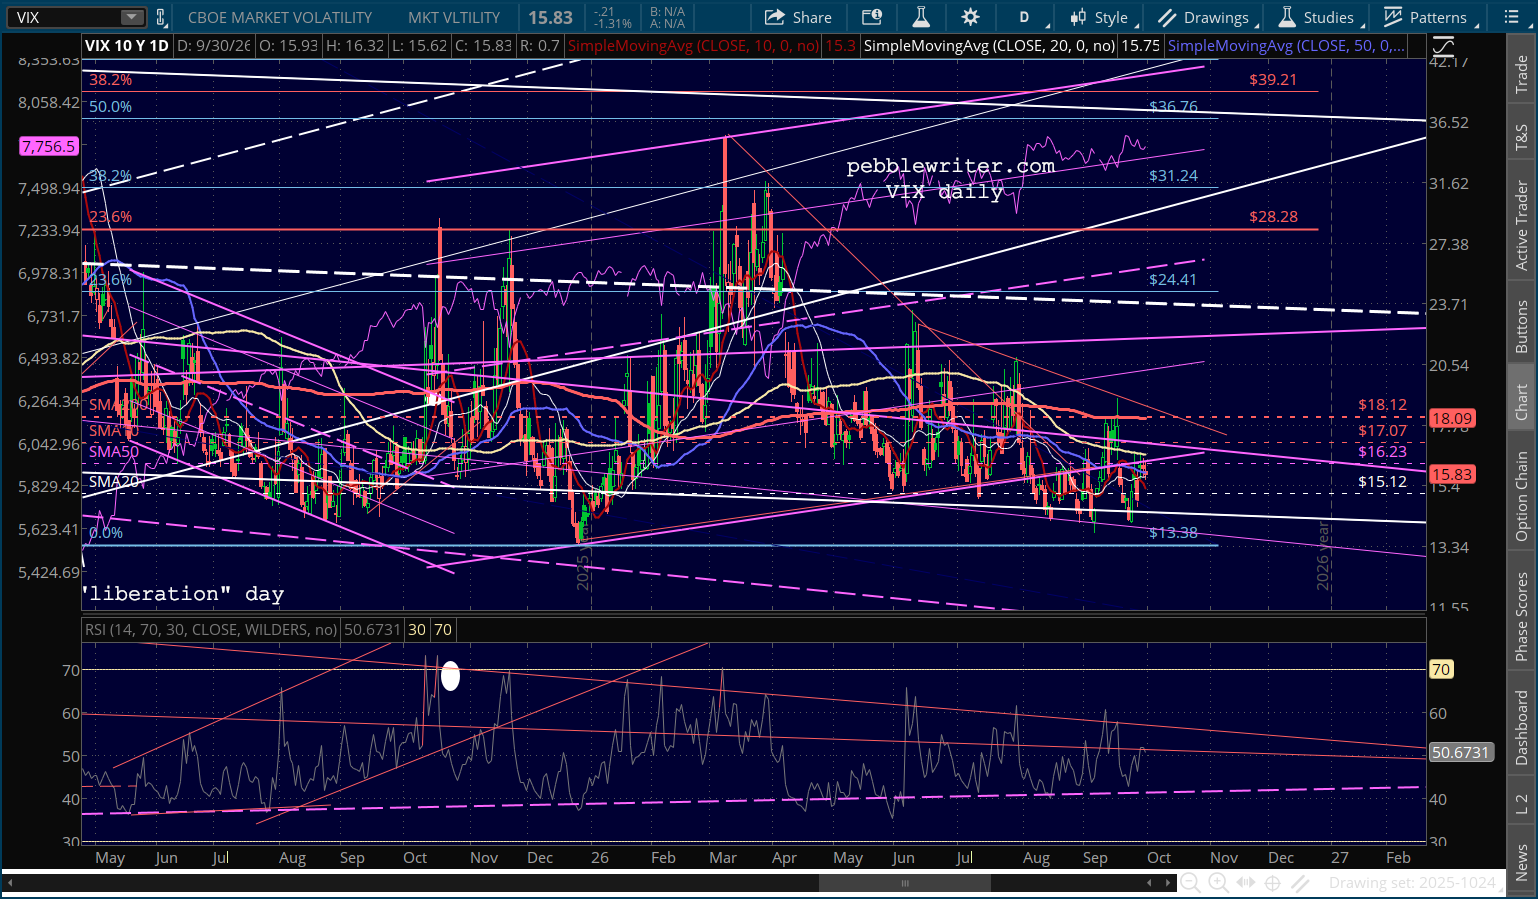
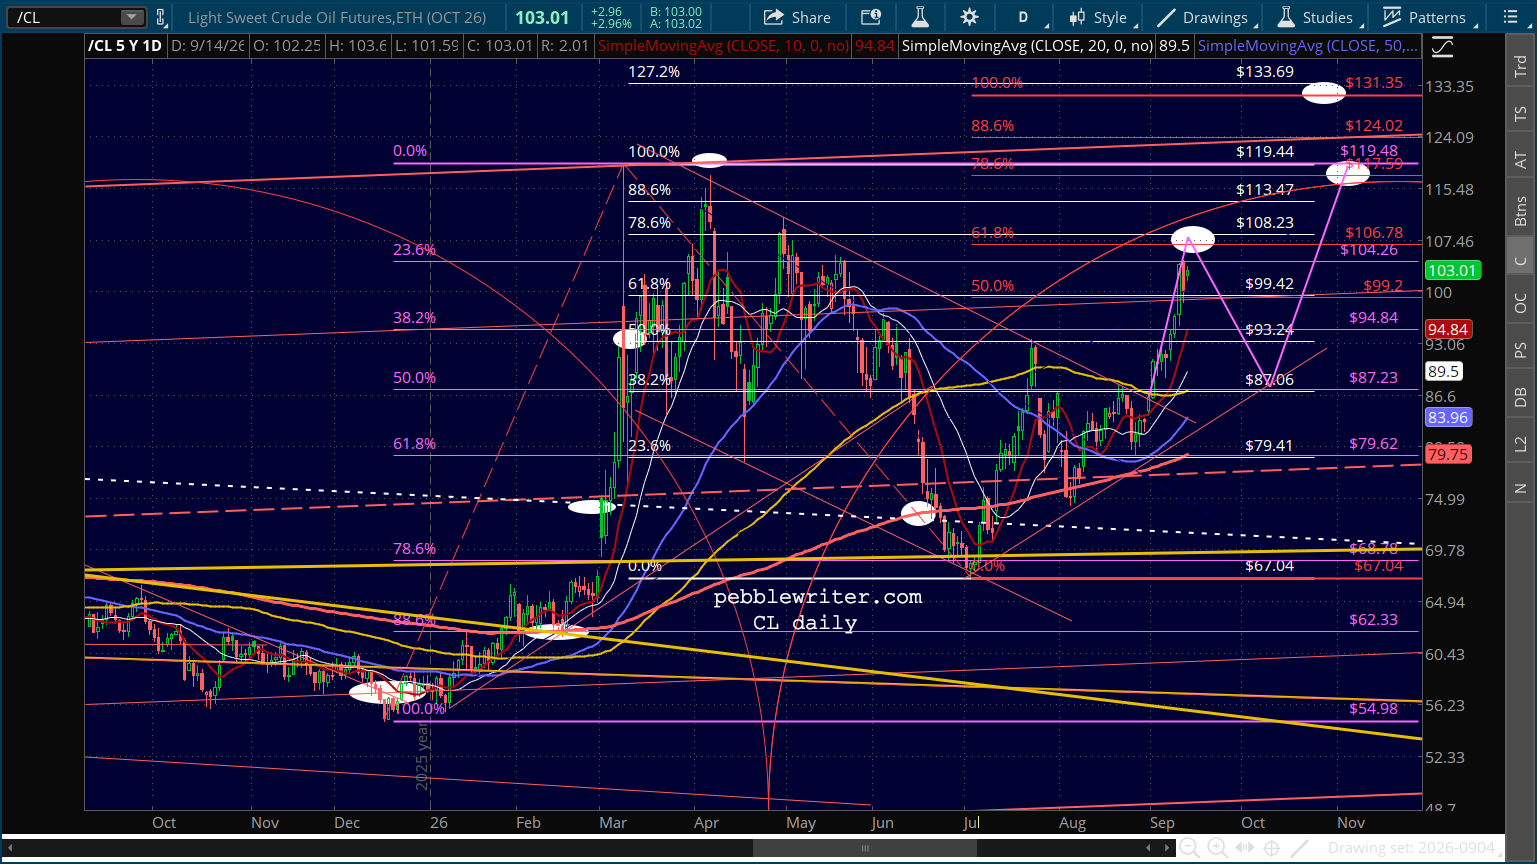
    My expectation continues to be that oil will spend the month leading up to the midterms on a tear to 120-130/bbl – driven by whatever Iran has to do to prevent Trump from prevailing.

    Meanwhile, Trump will do/say whatever necessary to bring oil/gas prices way down by late October.  Two opposing forces, each with a great deal on the line. However it turns out, it promised to be epic.
  • The Fed’s Dilemma

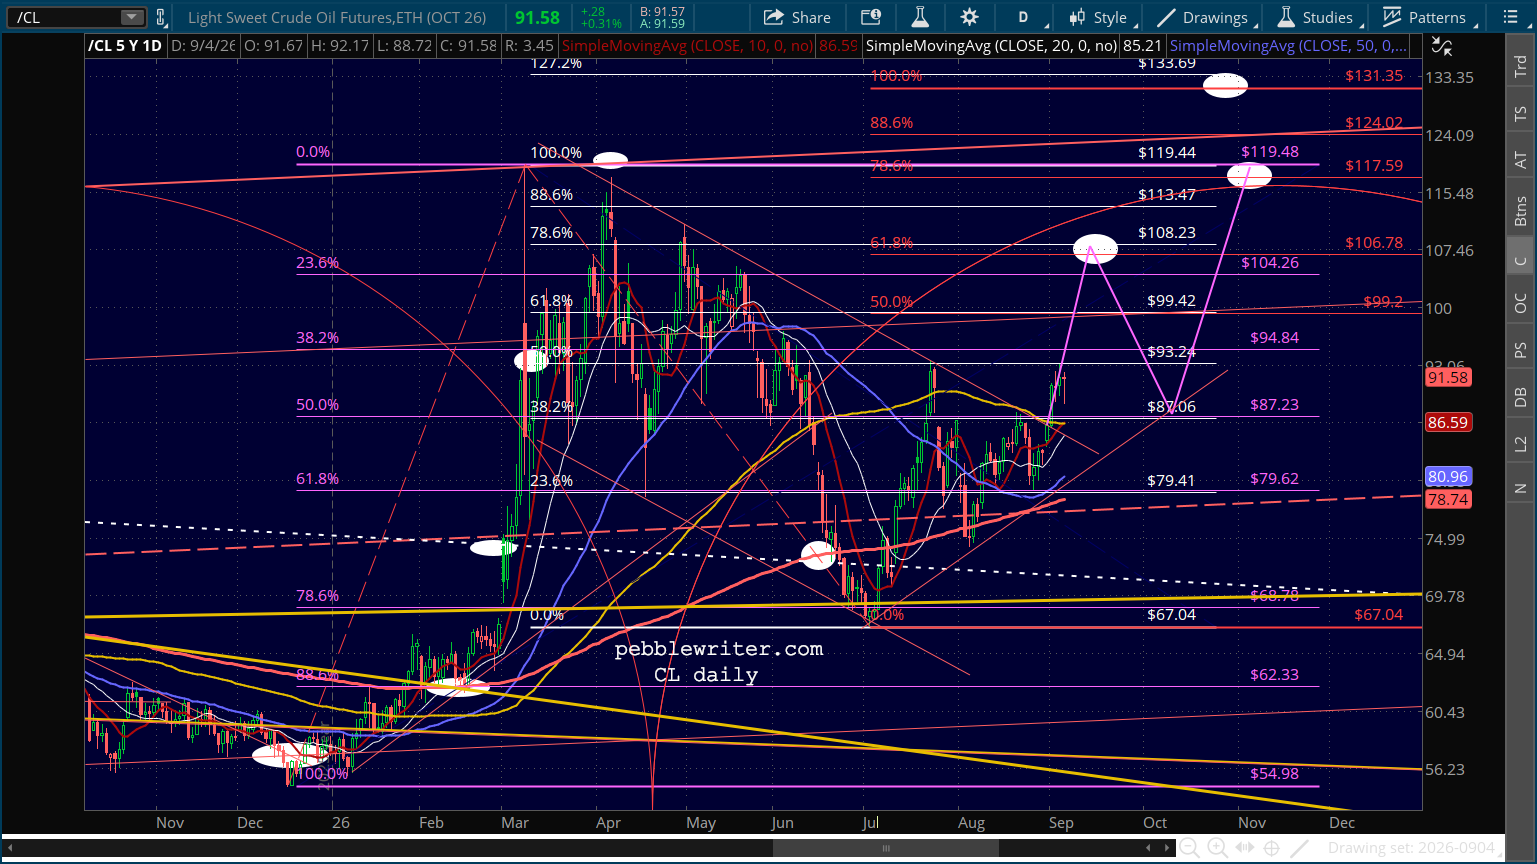
    WTI has almost reached our next upside target of 106.78-108.23 as things continue to heat up in the Middle East.

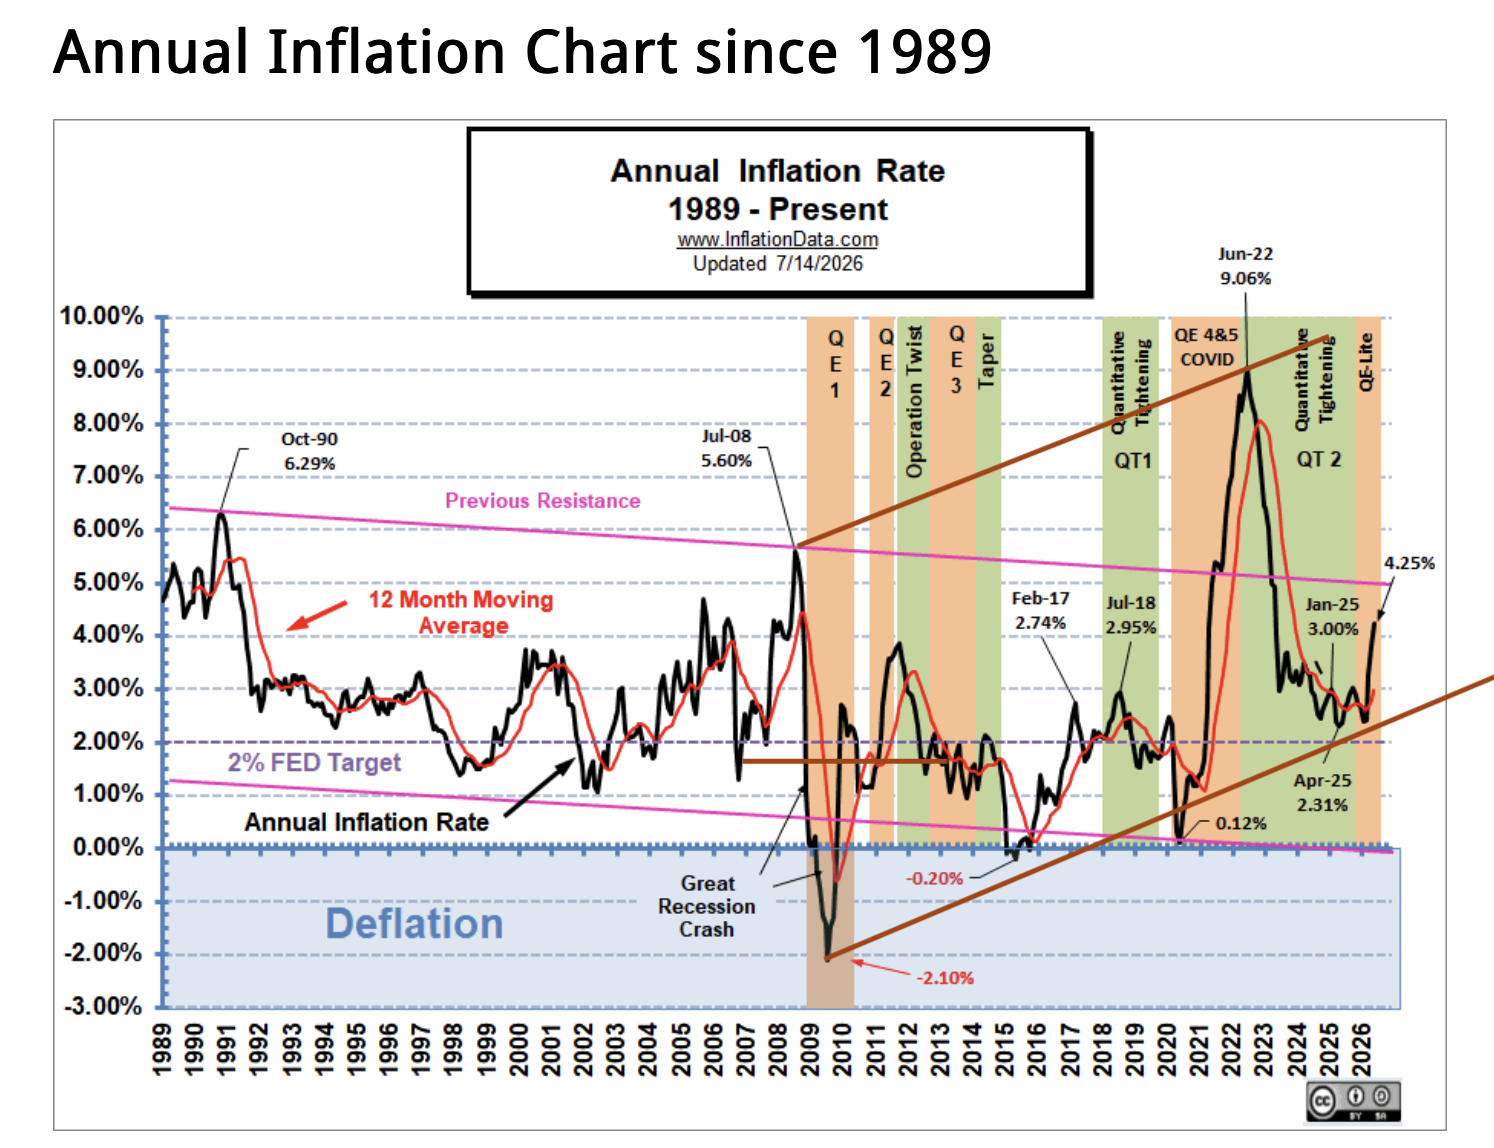
    The upshot is that inflation remains elevated, forcing the Fed’s to hike interest rates on Wednesday.

    The latest odds for a quarter-point rate hike are indicated at 80%. The impact is already being felt in both equity…

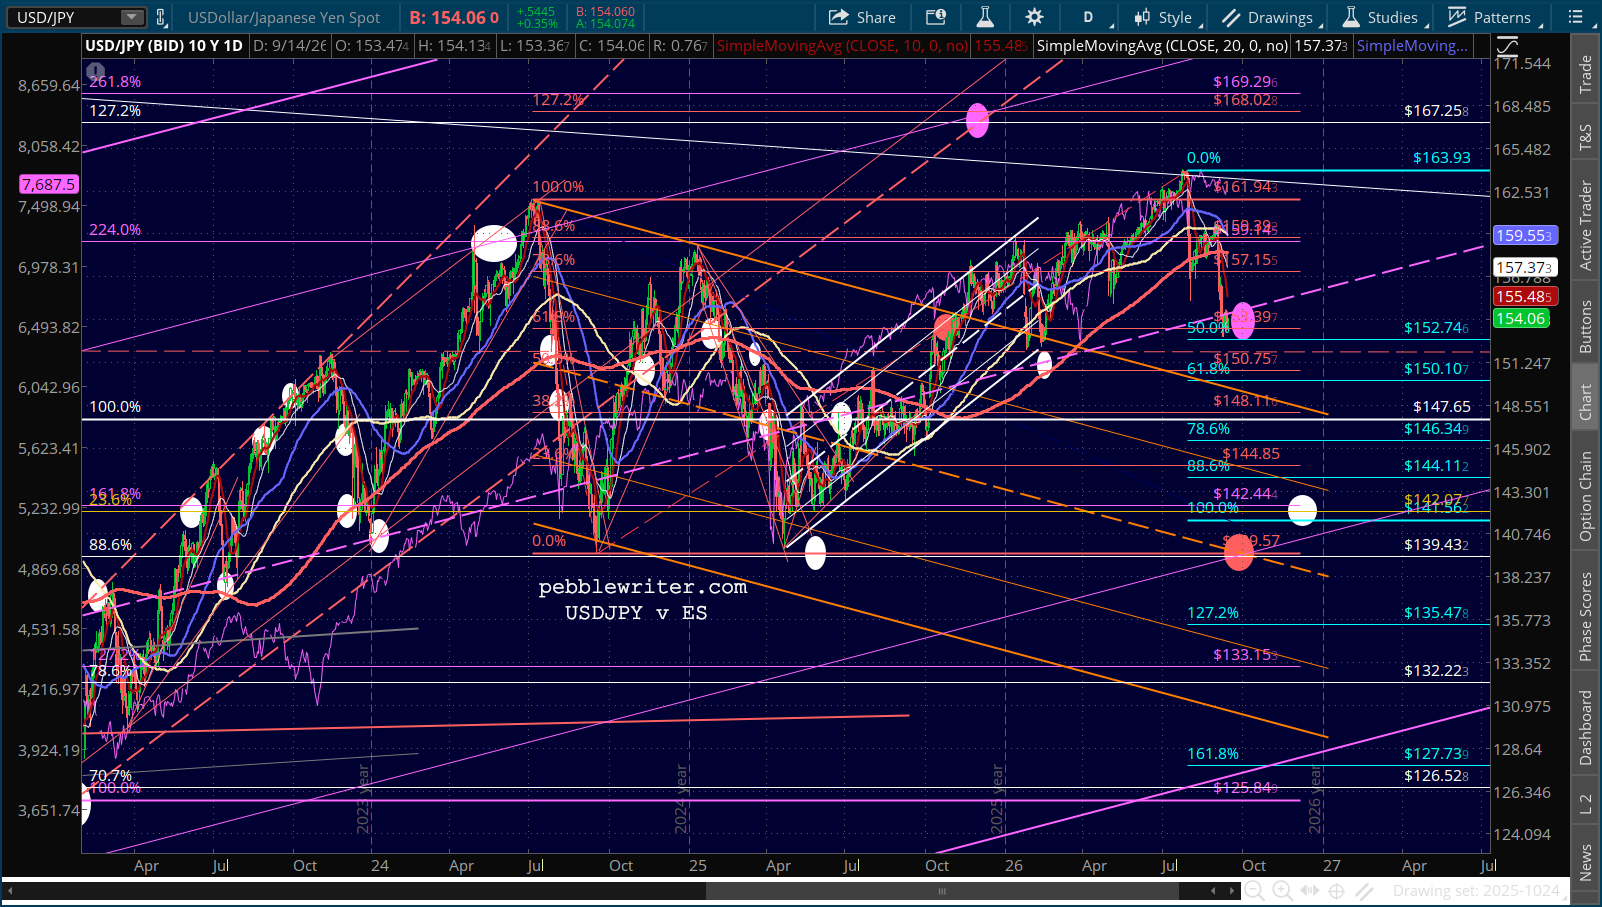
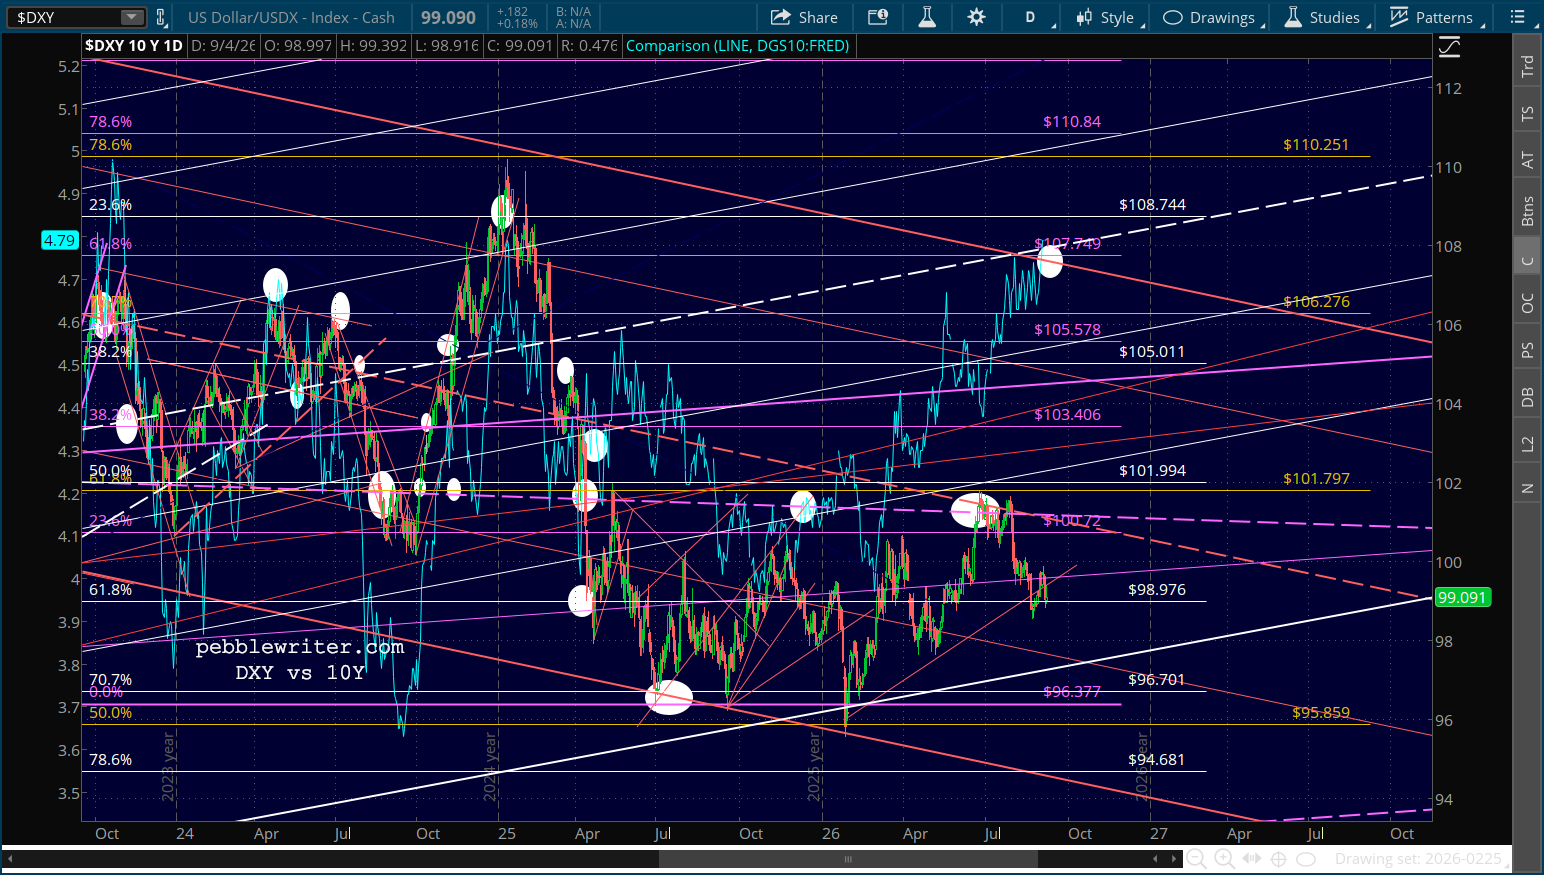
    …and currency markets, as the yen carry trade threatens to unwind.

    It’s horrible timing for Trump, with the midterms just around the corner. This, of course, is the goal of Iran’s refusal to buckle under increasing military and economic pressure.

    As much as Fed chair Warsh would like to accommodate Trump, a failure to hike rates at this point would result in a significant loss of credibility.

    Stay tuned…

  • Breaking Out

    Sep 4, 2026

    We’ve been hammering the same point ever since Trump first bombed Iran: rather than shrink from the conflict, Iran would exact as much retribution as possible. Since their military isn’t of the same caliber, they would use their strategic position as gatekeeper to the world’s oil supply to hit Trump where it hurts: oil prices and inflation.

    While the Fed and the Treasury have done a pretty decent job at times of keeping a lid on oil prices, WTI has broken out of the flag pattern we identified several month ago. It has also completed an inverted H&S pattern. Both suggest much higher prices that will test or best the March highs – presumably around the time of the November midterms.

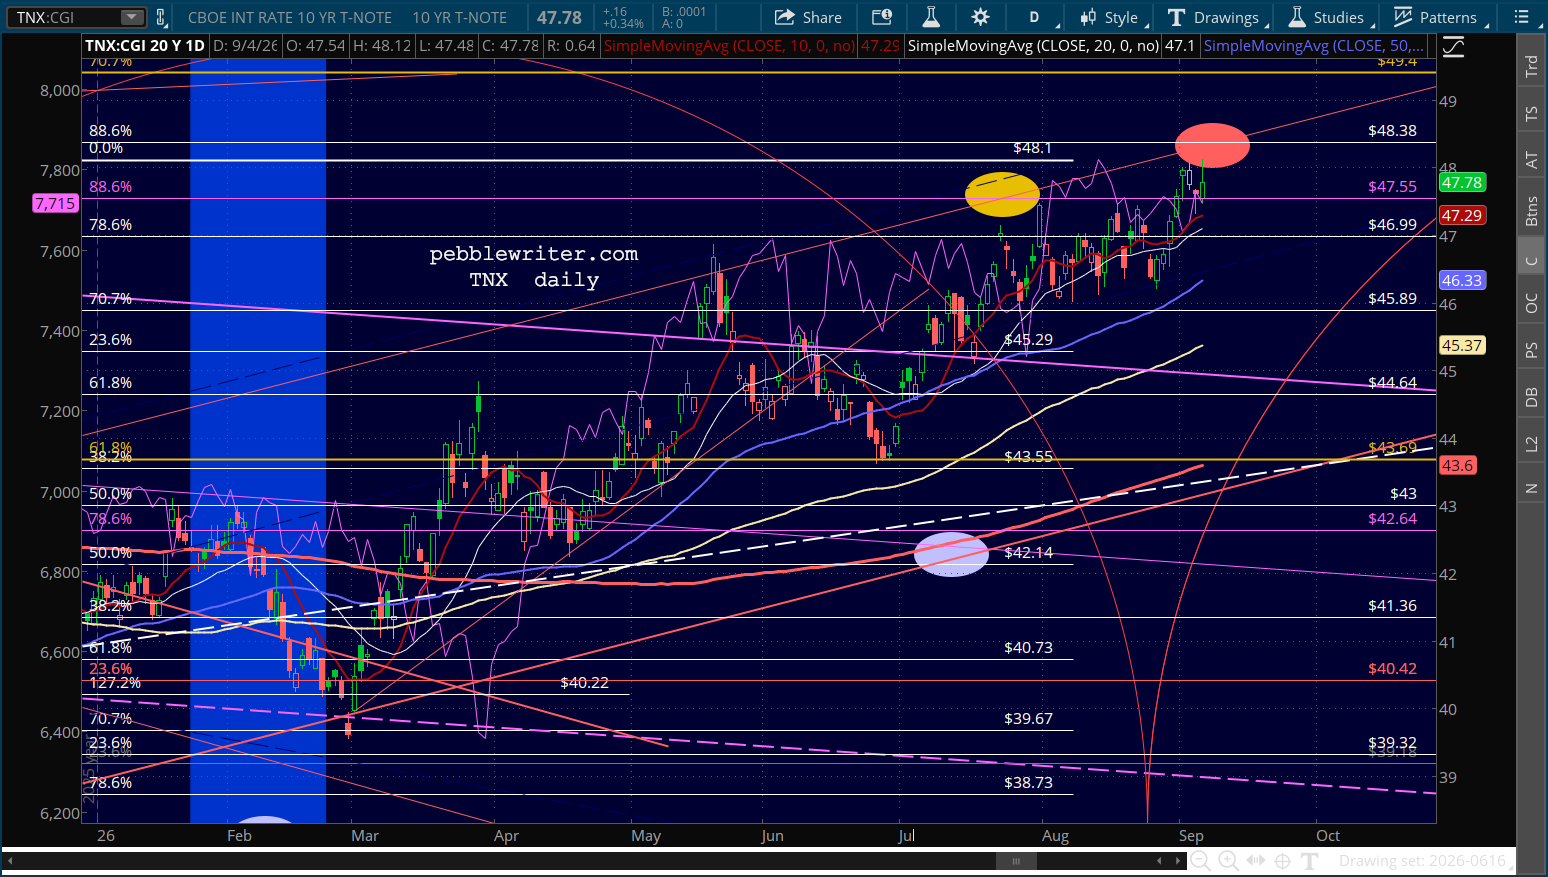
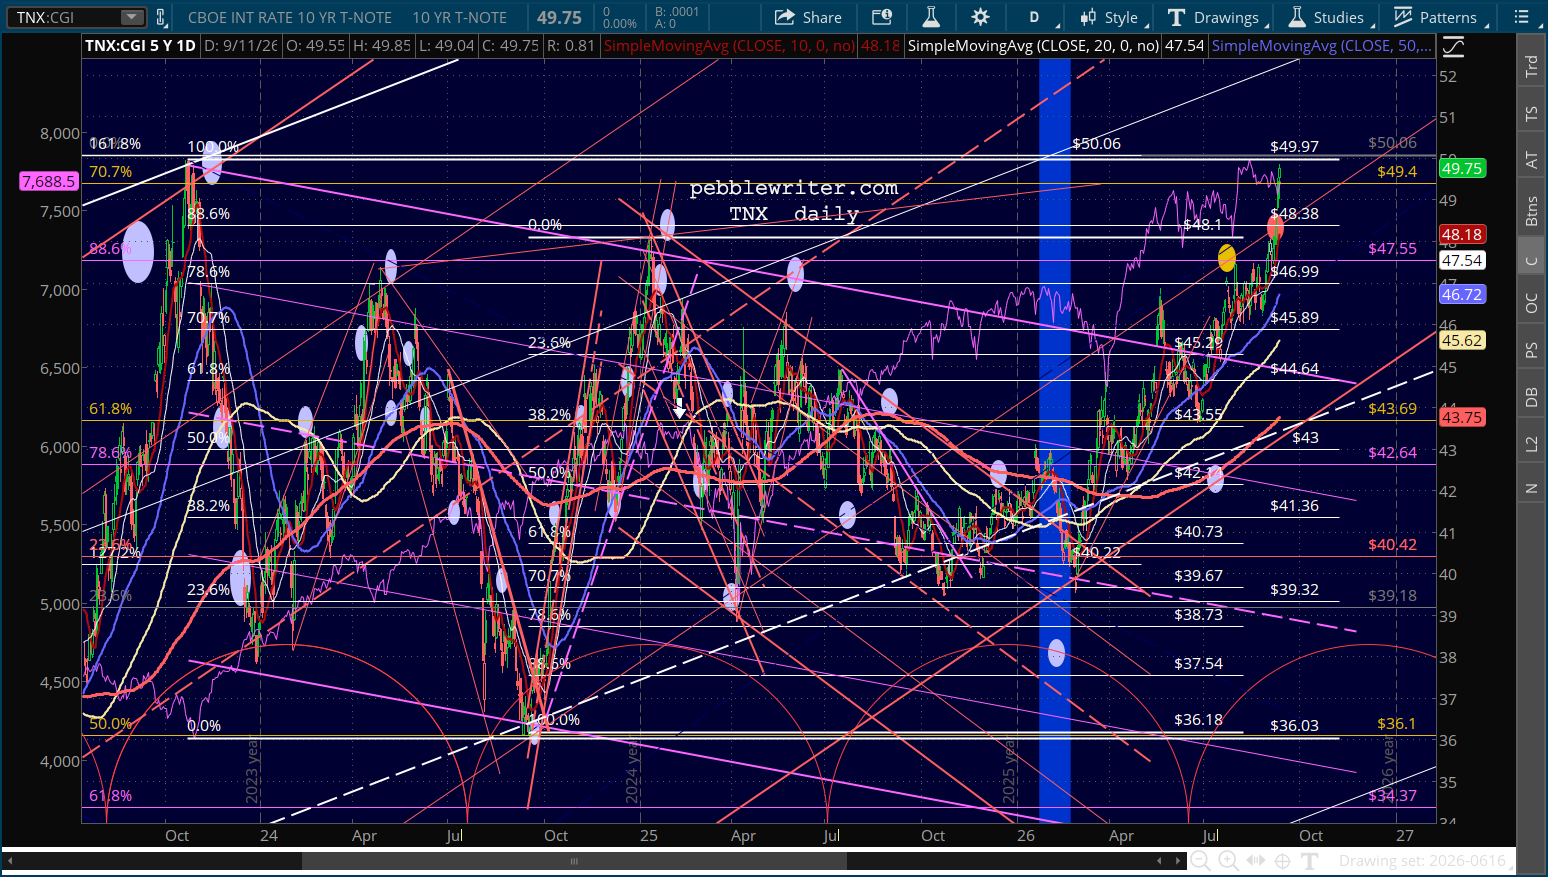
    Note also that the 10Y has nearly reached our next upside target at 4.84% – only slightly below 20 year highs.

    Suffice it to say things are about to get very interesting in the markets.

     *   *   *

    As I mentioned last week, I will on a vacation schedule during the month of September. I will post roughly once a week or more often if circumstances dictate.

    I also want to announce that I will be transitioning the website to retirement mode at the end of the year. After 15 years, 4,528 posts, 50,000+ charts, and waking up at 4am every day, I’m going to try resuming civilian life. It might not stick, and God might have other plans, but I’d like to give it a try.

    Still noodling on it, but I’ll probably transition to a weekly missive of some sort.  Stay tuned…