Month: November 2025

  • Right Out in the Open

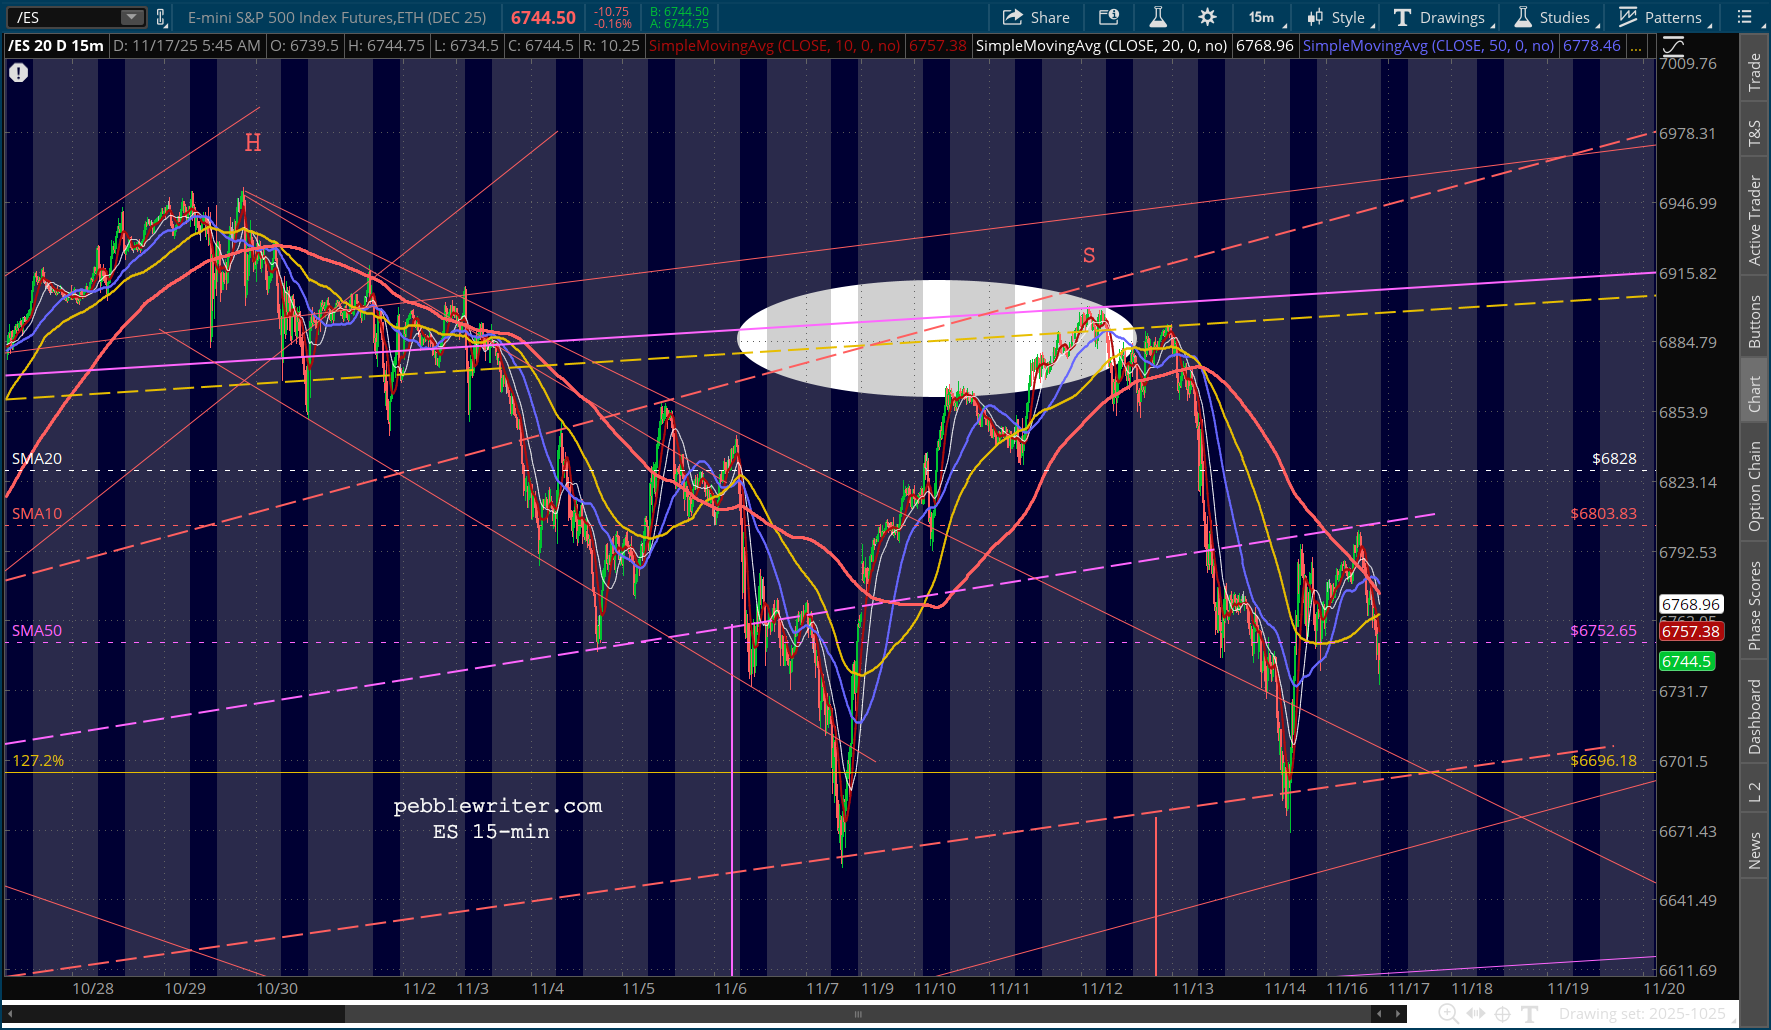
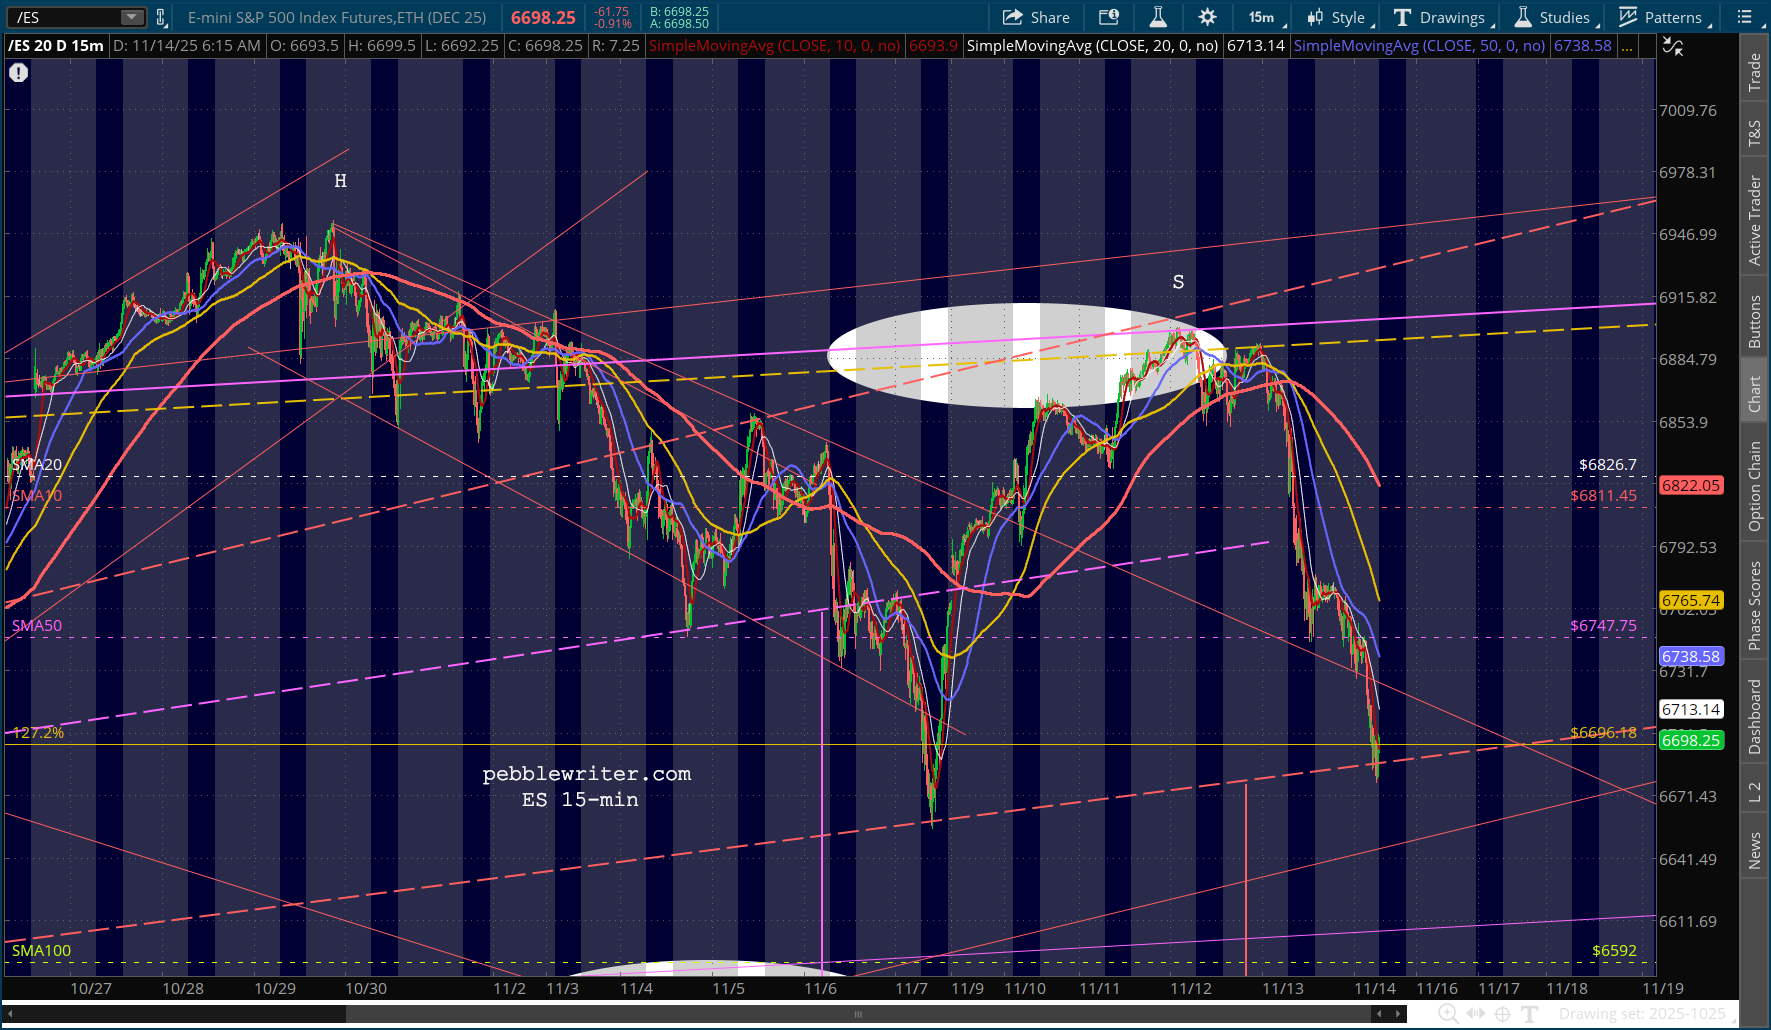
    Futures are modestly higher despite VIX being crushed by a ridiculous 8%. It’s gotten to the point where there’s not even any effort to mask the obvious manipulation.

    continued for members

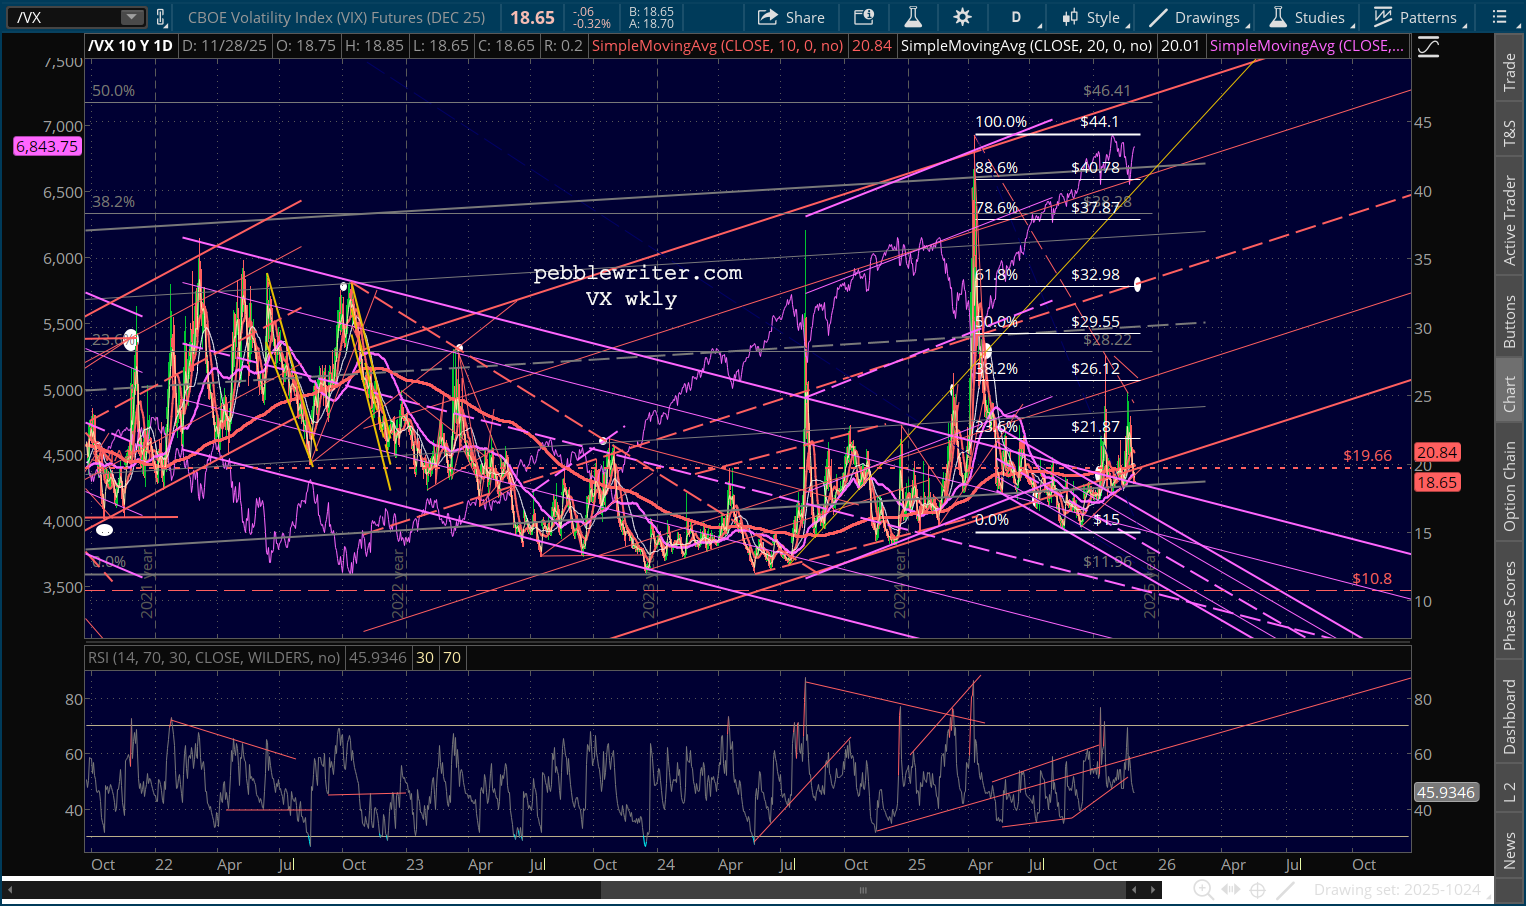
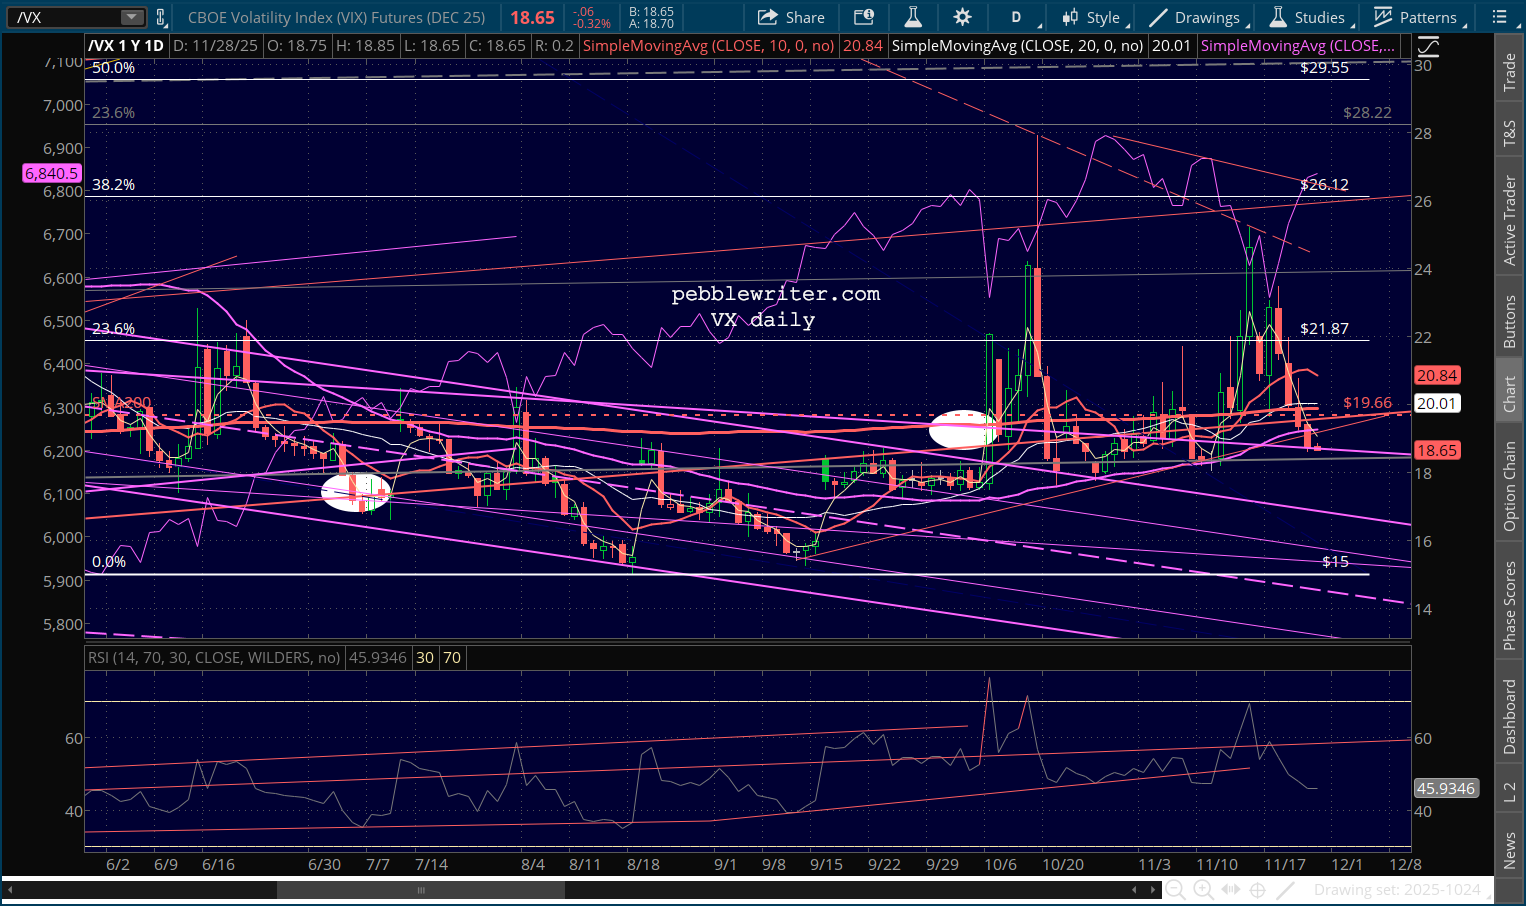
    We have to go to the VX futures to see the true state of affairs – a backtest of the large falling purple channel from Jan 2022. This isn’t to say that the channel won’t be violated again, like it was starting on May 12.

    Members will recall that Monday, May 12 was the day that Scott Bessent went on CNBC (before the open, of course) to surprise markets with the news that tariffs on China would be slashed from 125% to 10%.

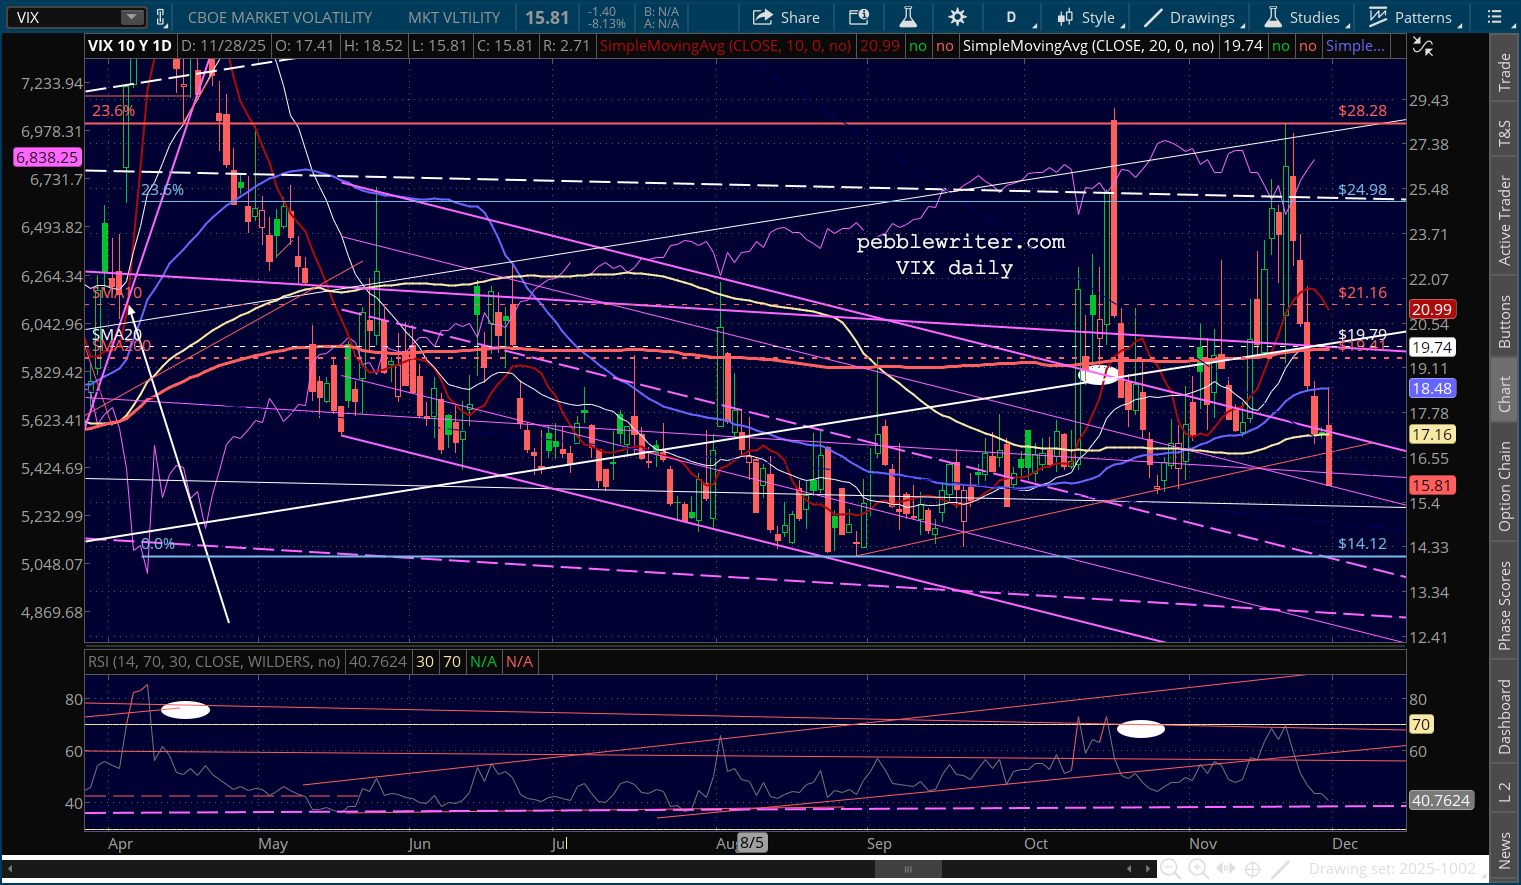
    VIX plunged 17% (back below its 200-day moving average of course) and SPX soared 3.25%, gapping back above its 200-day moving average. This followed the FOMC decision on May 7 not to cut interest rates. It should come as no surprise that the meeting with the Chinese was announced on (drumroll please) May 7 as SPX was pulling back from its .618 Fibonacci level.

    We’ll be doing a little site maintenance over the next few days, but this situation was too absurd not to mention.

    Wishing everyone a wonderful Thanksgiving holiday!


  • Charts I’m Watching: Nov 26, 2025

    Futures are up modestly after another vol crush ahead of the Thanksgiving holiday.

    continued for members(more…)

  • Old News

    Futures are flat following the release of September retail sales and PPI which both missed expectations. Retail sales rose 0.2% after a 0.6% gain in August. And, PPI came in at 0.3% after a 0.1% drop in August.
    Neither stale print should sway the FOMC’s December rate decision – though yesterday’s irrational exuberance just might.
    continued for members

    (more…)

  • Charts I’m Watching: Nov 24, 2025

    Futures are moderately higher ahead of the open and important economic data later this week.

    Wednesday’s PCE print is the only official inflation data we’ll see prior to the next FOMC decision on Dec 10.

    continued for members(more…)

  • Williams Pulls a Bullard

    Futures reached our next downside target yesterday, though two weeks later than our forecast [see: Not So Fast…] Admittedly, we heard from many naysayers back in October when we posted this chart.

    And, this morning…Days like yesterday, where a 120 point overnight rally turned into a 160 point selloff, are enough to scare anybody. But, especially NY Fed President Williams who took time out of his busy schedule to remind algos that there room for “further adjustments” to interest rates.

    It reminds us of James Bullard’s similar announcement in the midst of a 2014 selloff. He asserted that QE should continue because interest rates were too high (the 10Y was at 2%.)  It’s a great reminder of the Fed’s important third mandate: to prevent crashes.

    continued for members... (more…)

  • NVDA to the Rescue

    Futures are up sharply following NVDA’s better-than-expected earnings alleviated concerns about the prospects for AI-related companies.

    The overnight meltup was good for 80 or so points on ES. Another 20 points were added on when September’s jobs data was released, showing that unemployment had ticked up from 4.3% to 4.4%, the highest since Oct 2021. Average hourly earnings rose from 3.7% to 3.8% and hours worked remained stable.

    continued for members(more…)

  • But Wait, There’s More

    Futures have rebounded slightly following another negative session, but are nervously eyeing NVDA’s quarterly results due out after the close.

    continued for members(more…)

  • Stop Digging

    There’s a famous old quote that advises: “If you find yourself in a hole, stop digging.” This seems applicable in so many instances today: Trump and the Epstein files, AI investment, FOMC policy, crypto investment, the overall economy…

    It’s perhaps the principle which best explains what’s happening to the financial markets. There’s a correlation in chart patterns known as the Head & Shoulders Pattern. Once you’ve dropped below and backtested the neckline, there’s more downside than people expect.continued for members(more…)

  • Charts I’m Watching: Nov 17, 2025

    Futures are off modestly following Friday’s backtest of the initial head & shoulder  neckline.

    Note that SPX’s SMA200 has finally reached its former highs. As we discussed quite some time ago, this allows a significant backtest with the benefit of the support the SMA200 would offer. It’s a prime opportunity for TPTB to let a little air out of an overinflated market.

    continued for members(more…)

  • Another Test

    The market failed the first test, the smaller Head & Shoulder Pattern at 6800 that pointed to 6535. Now, it’s getting a shot at the larger one that points much lower.

    The key will be whether it can hold 6700ish.

    continued for members... (more…)