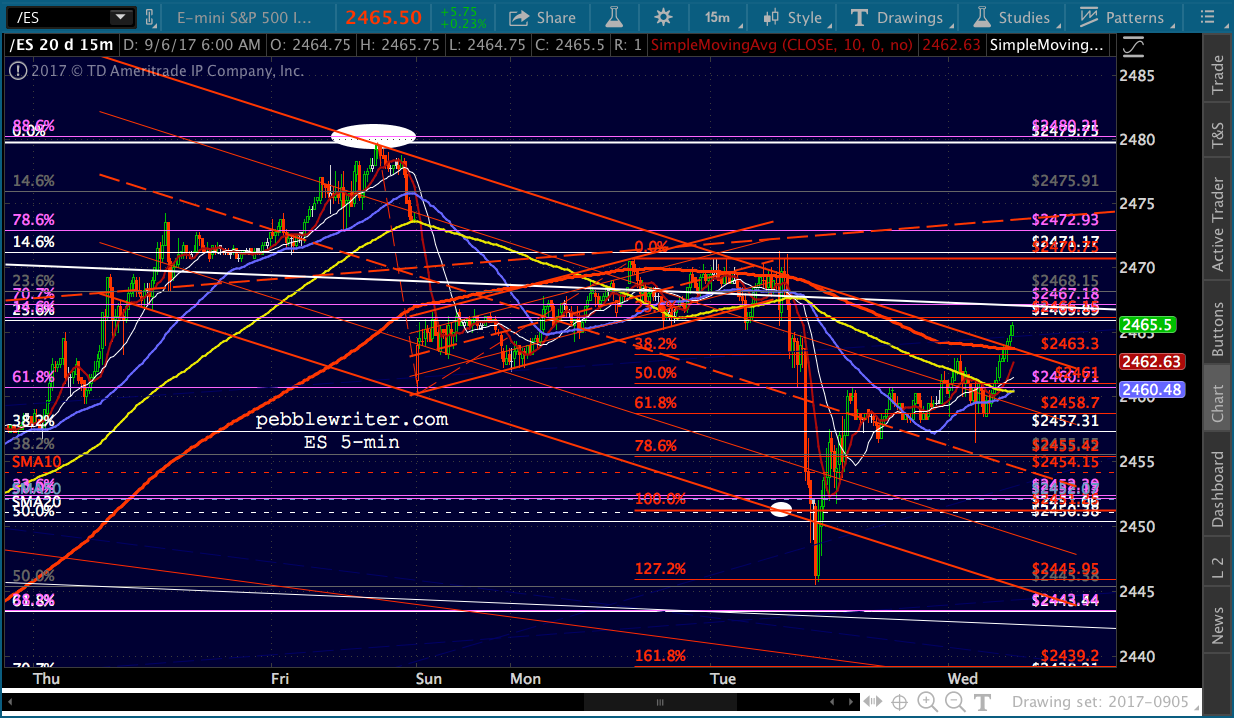
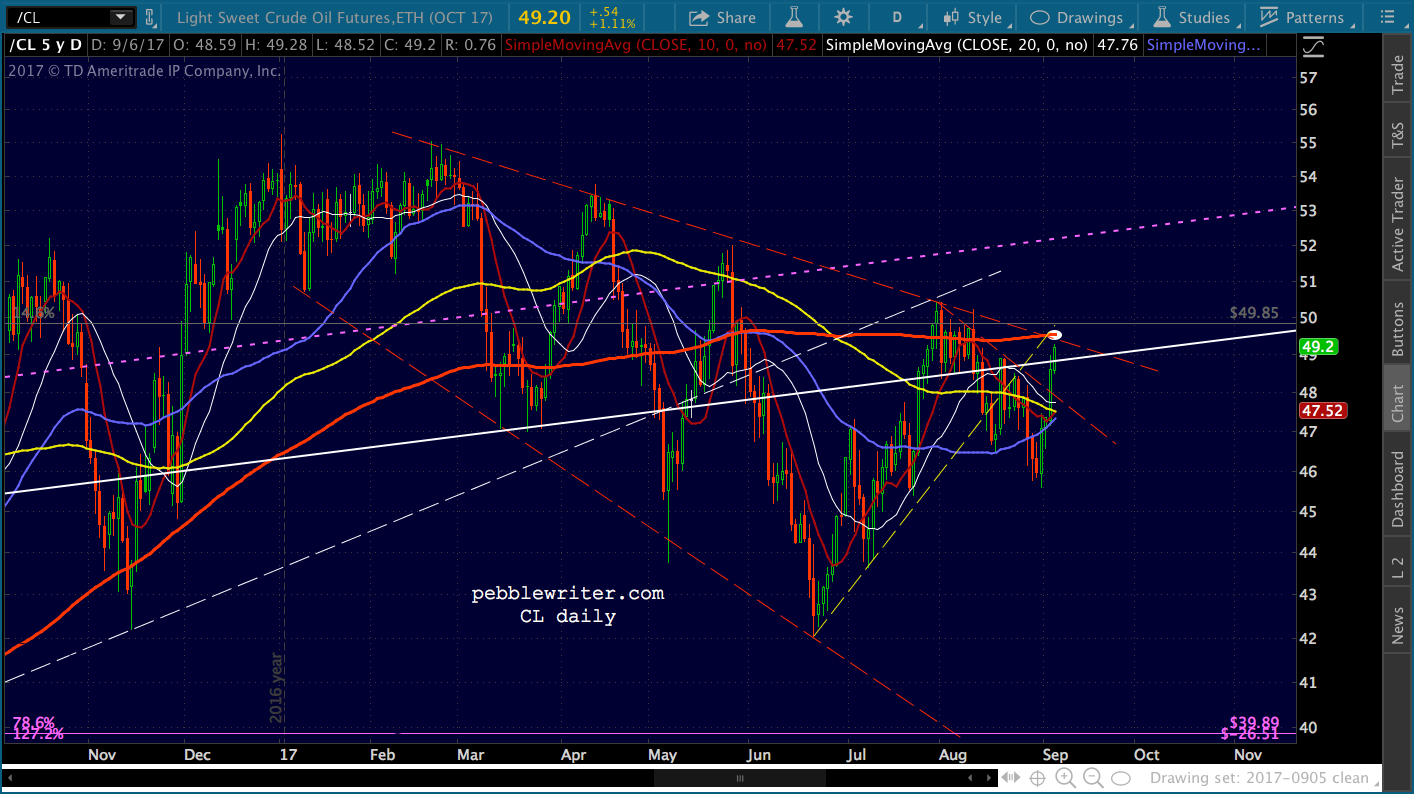
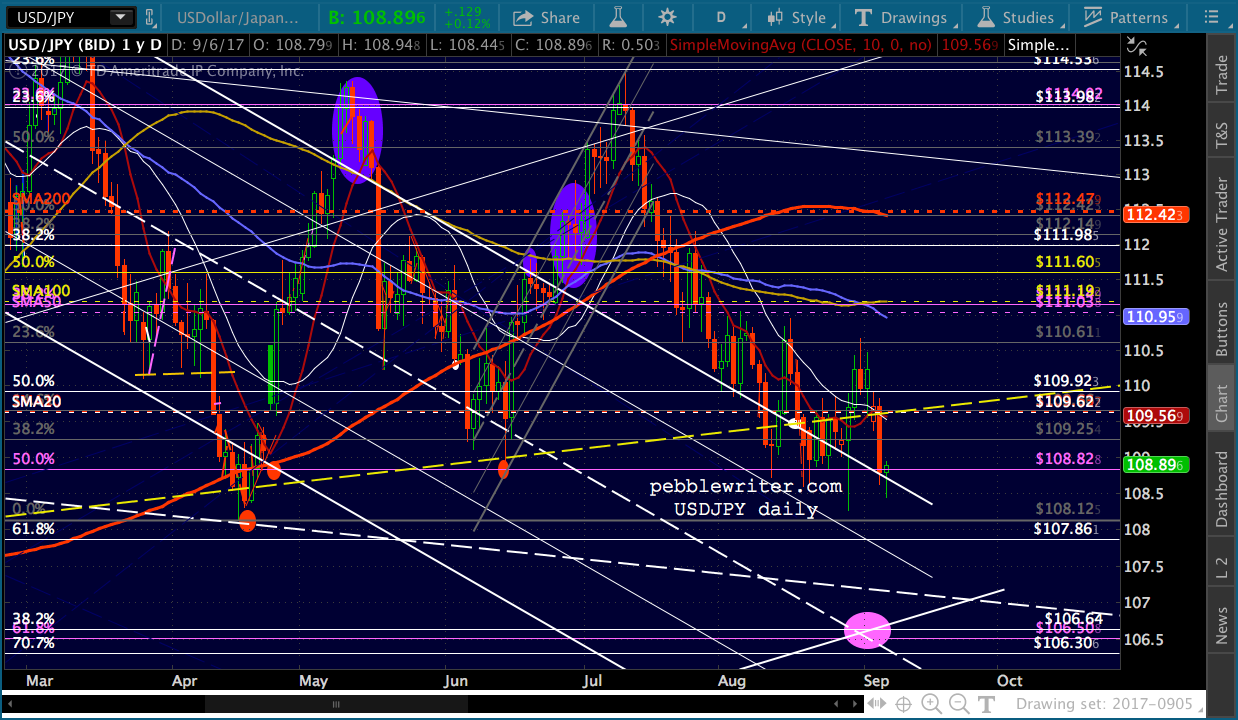
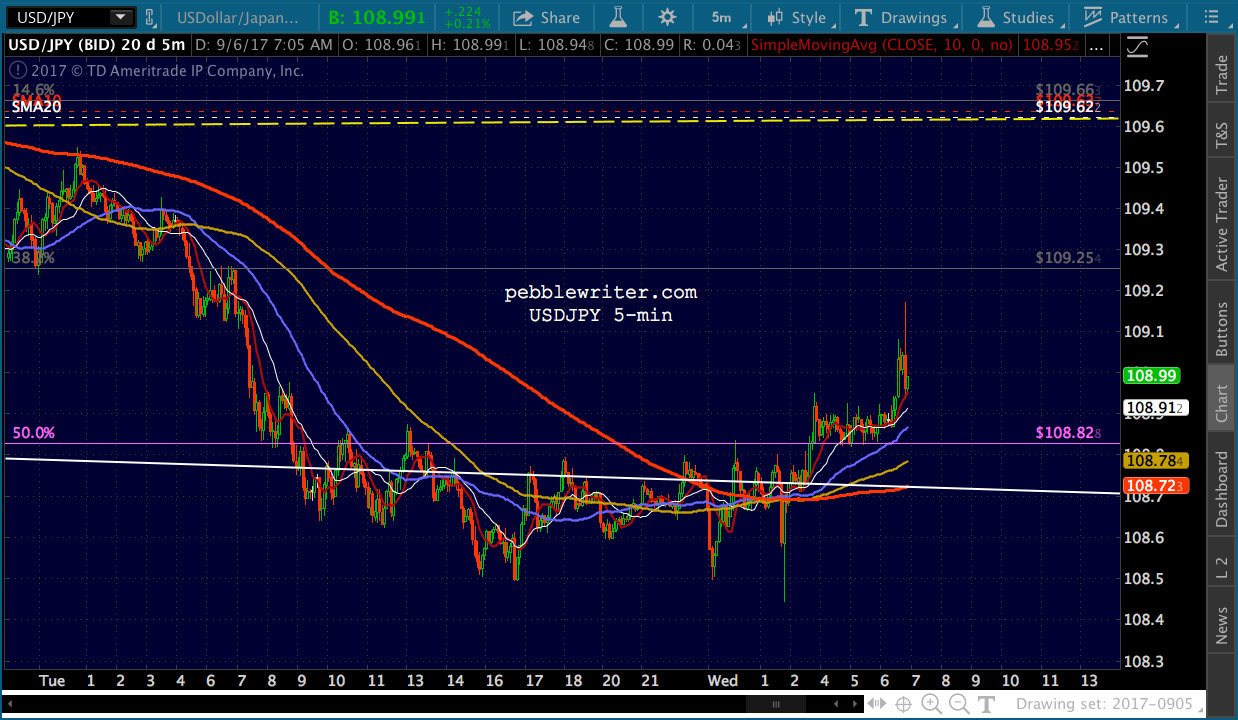
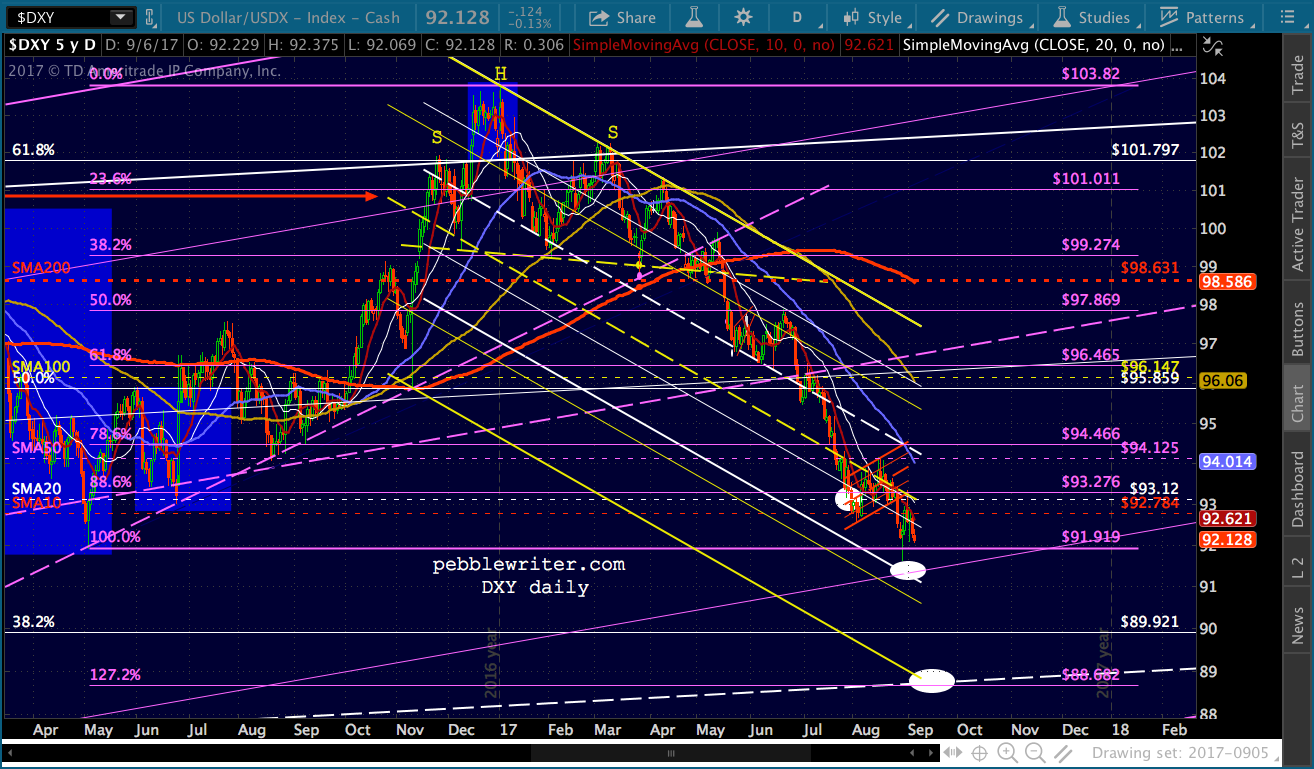
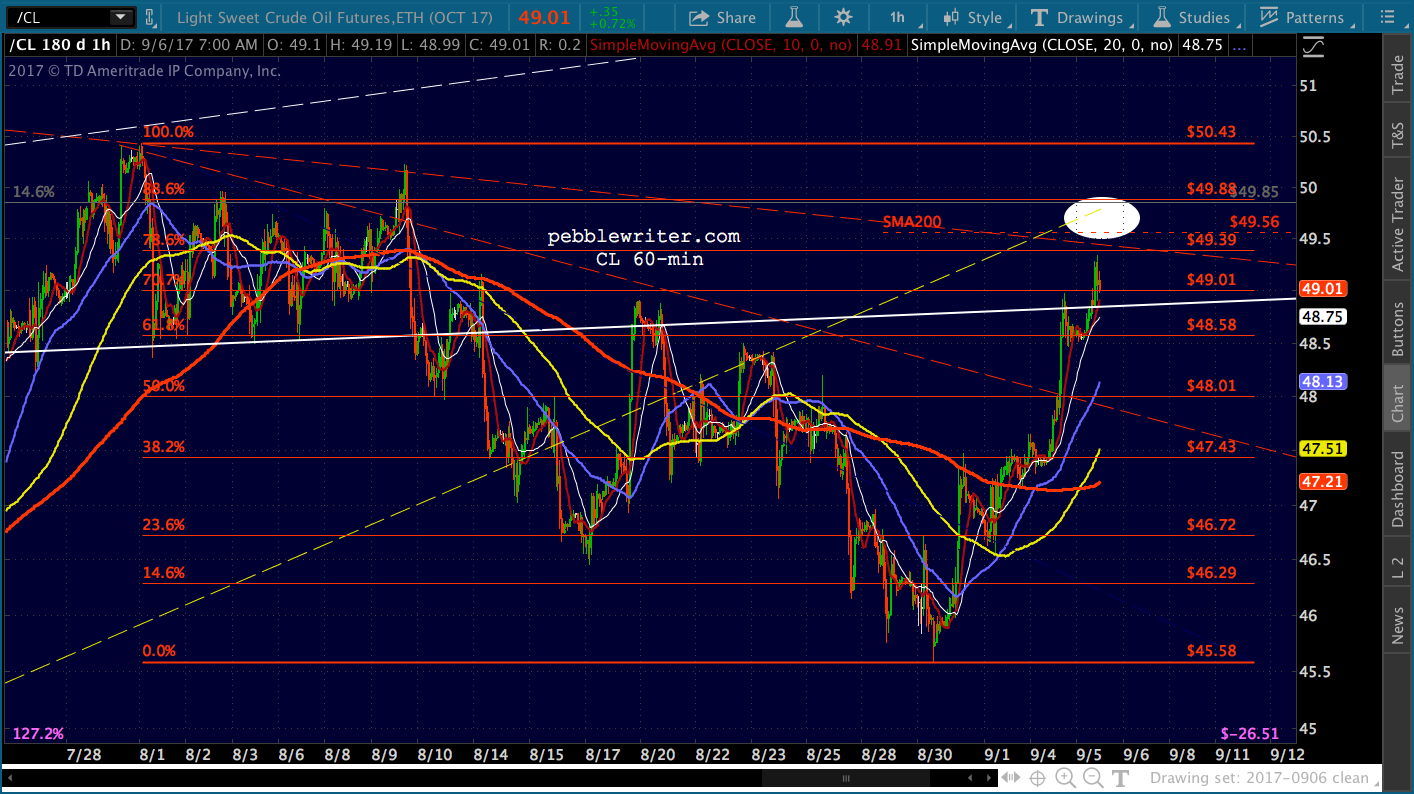
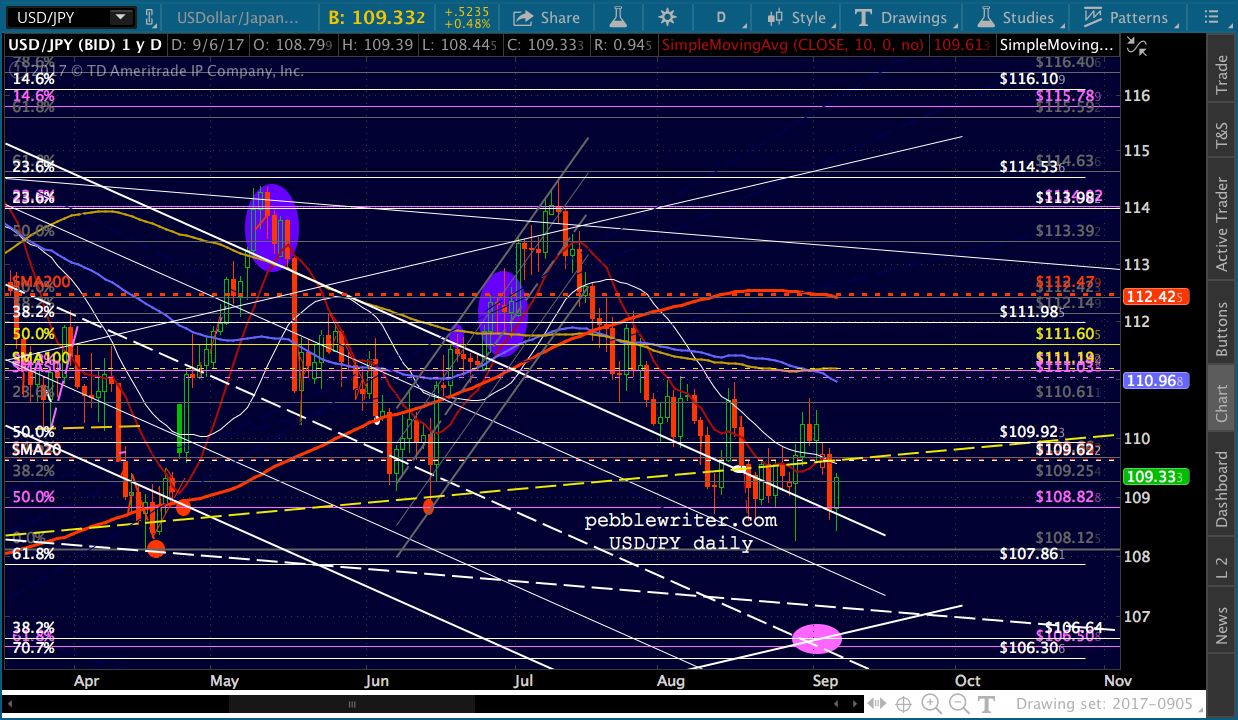
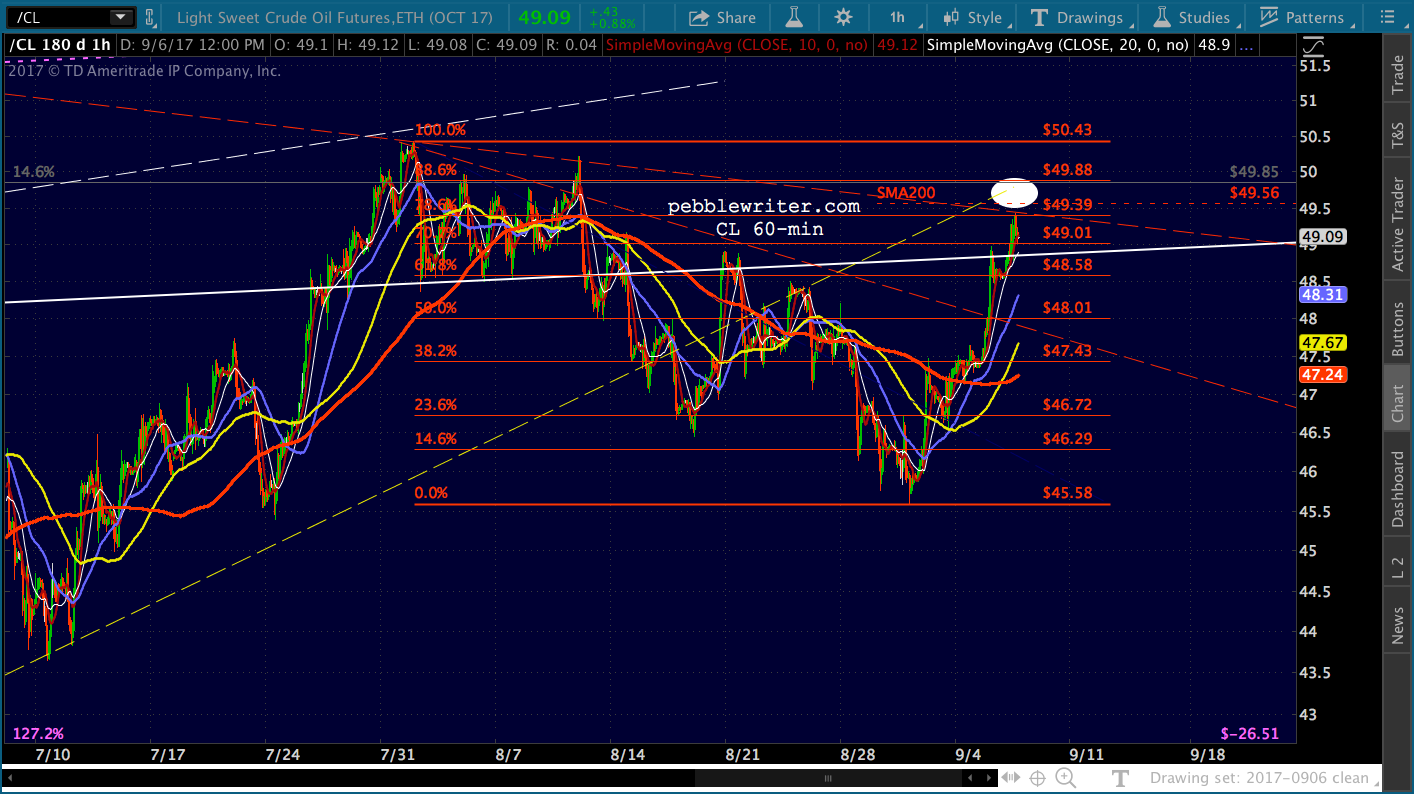
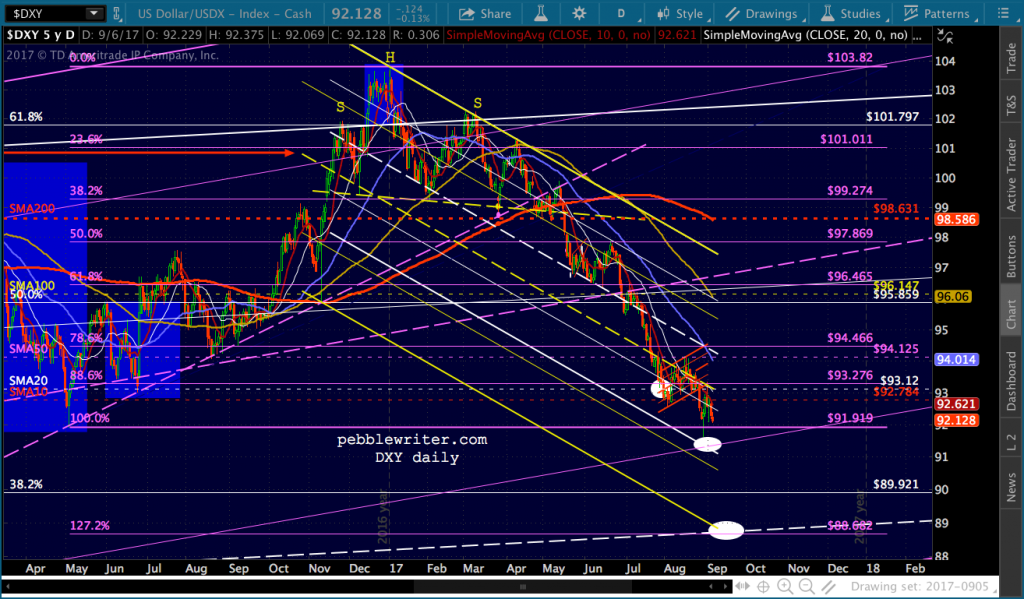
Aside from the troubling headlines, yesterday’s price action was driven by continuing weakness in the USD (especially USDJPY) and oil’s inability to push through important overhead resistance.
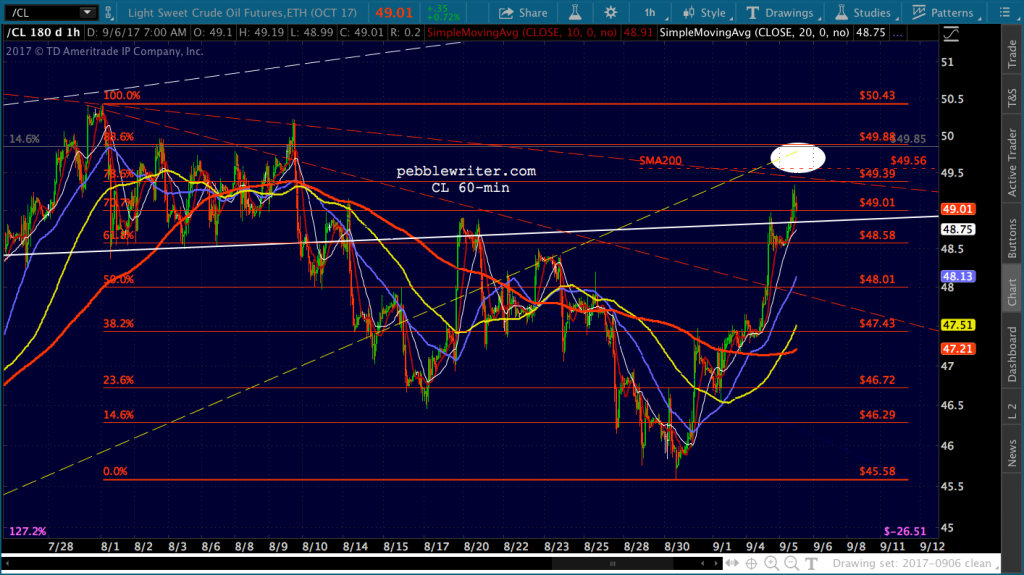
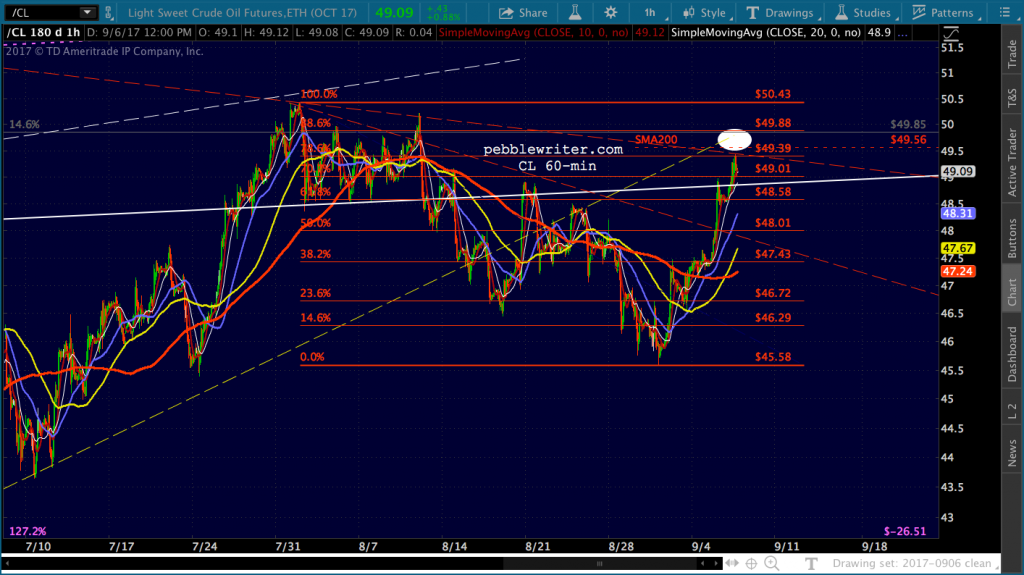
This morning, oil is pushing above that resistance. We won’t see EIA inventory data until tomorrow, due to the holiday. So, it remains to be seen whether traders will jump on board this move, or it’ll reverse intraday.
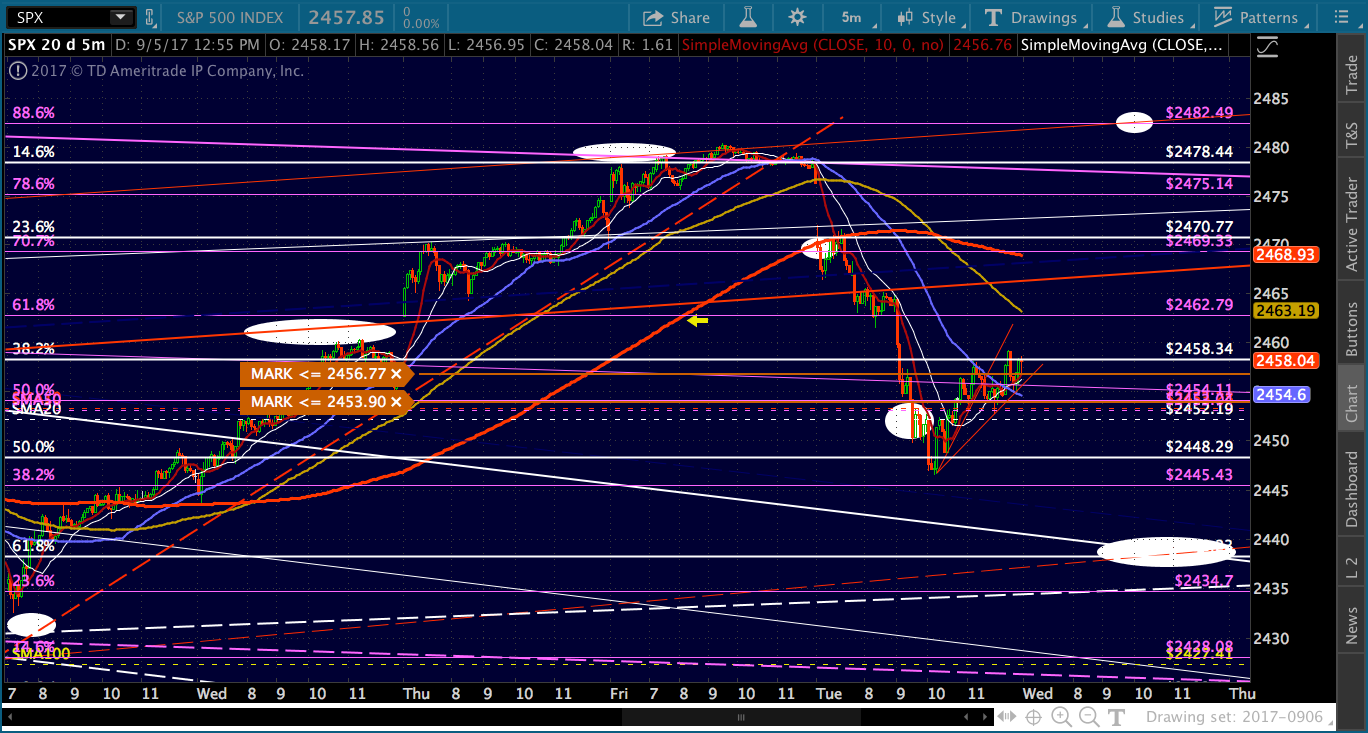
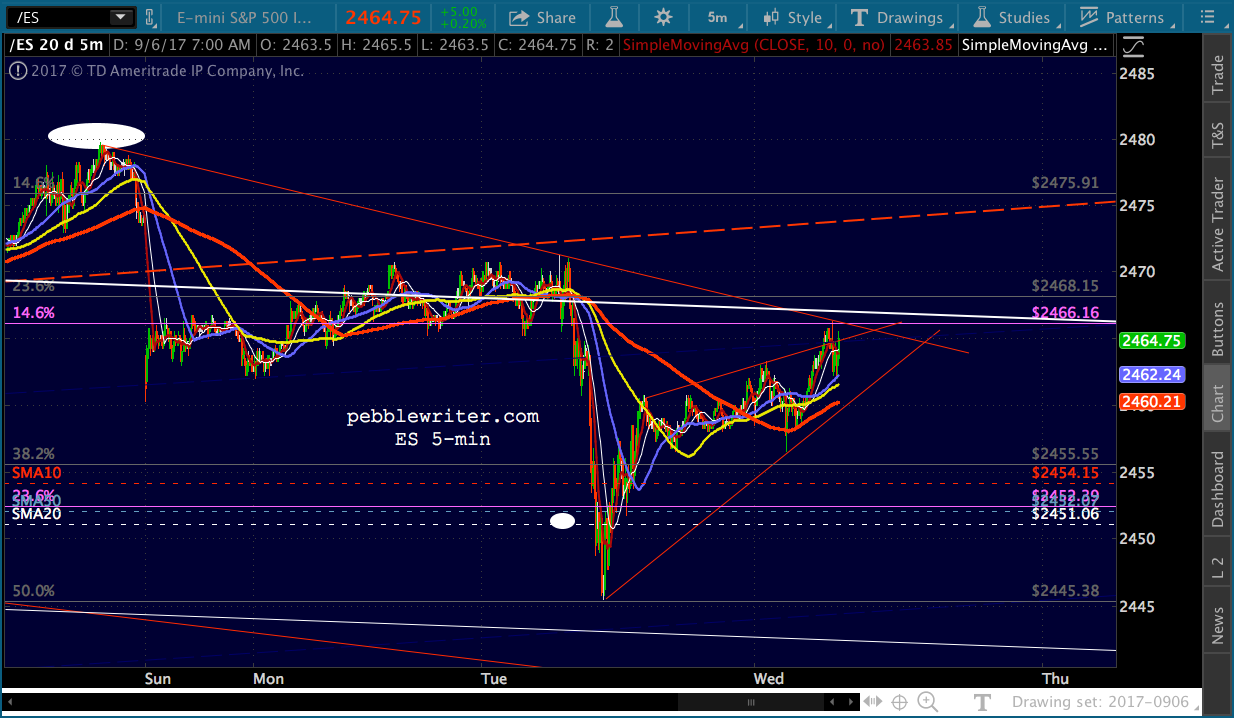
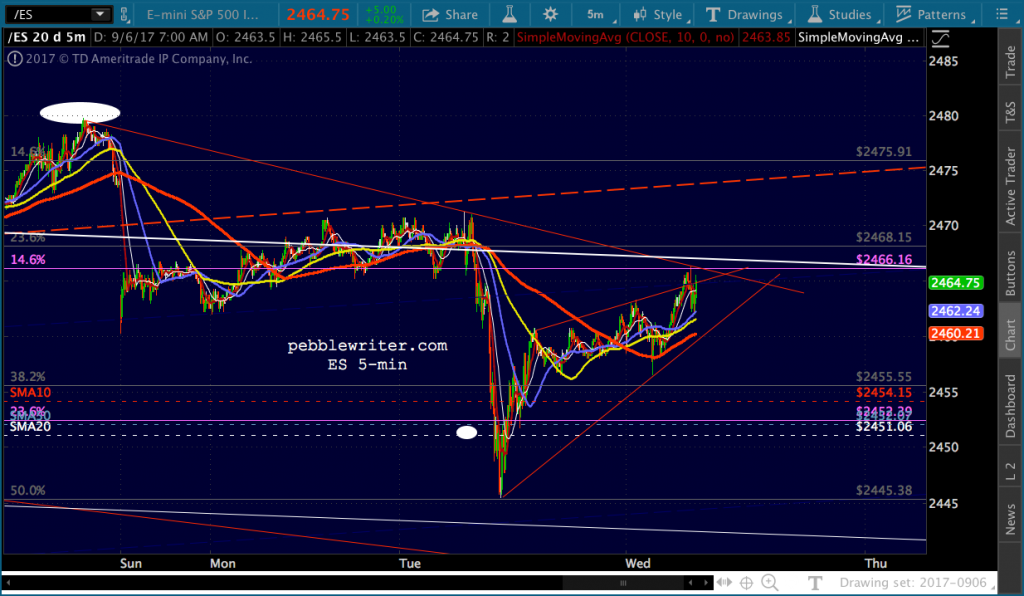
If it does, we still have no shortage of lower price targets. ES had no trouble reaching yesterday’s initial downside target, with a drop through 2450 before VIX was wrestled back under control.
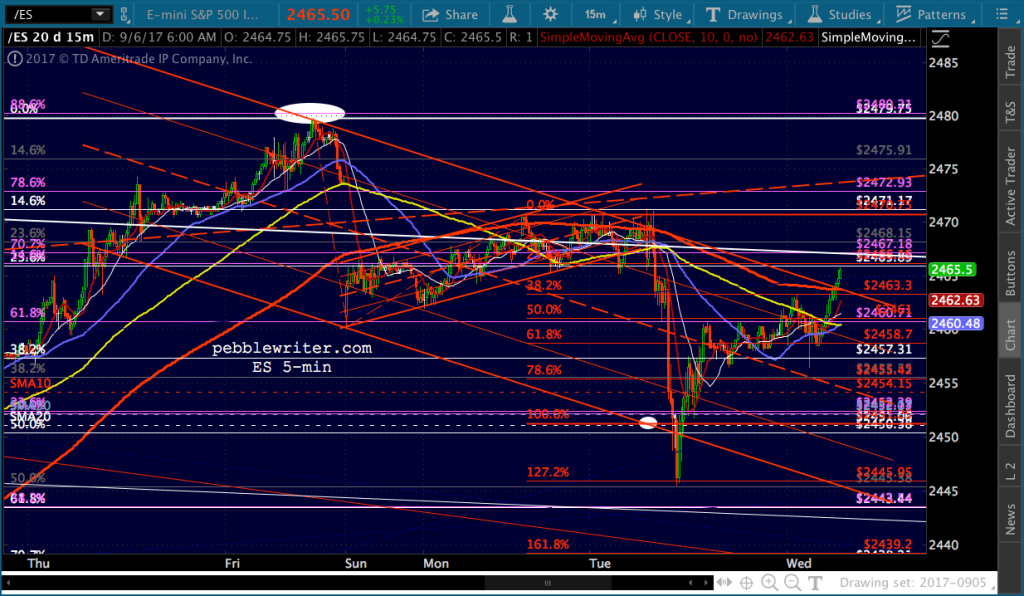 After the overnight ramp, it’s again threatening a breakout. We saw how that went yesterday. Is this yet another 1% V-shaped recovery, or a potential head fake?
continued for members...
Just a quick housekeeping note…I will post until 10:30 this morning, then have to hit the road for some meetings. With any luck, I hope to get an updated oil forecast posted as well. But, there’s a pretty good thunderstorm brewing here in Boston, and I’m wondering how long the power will remain on…
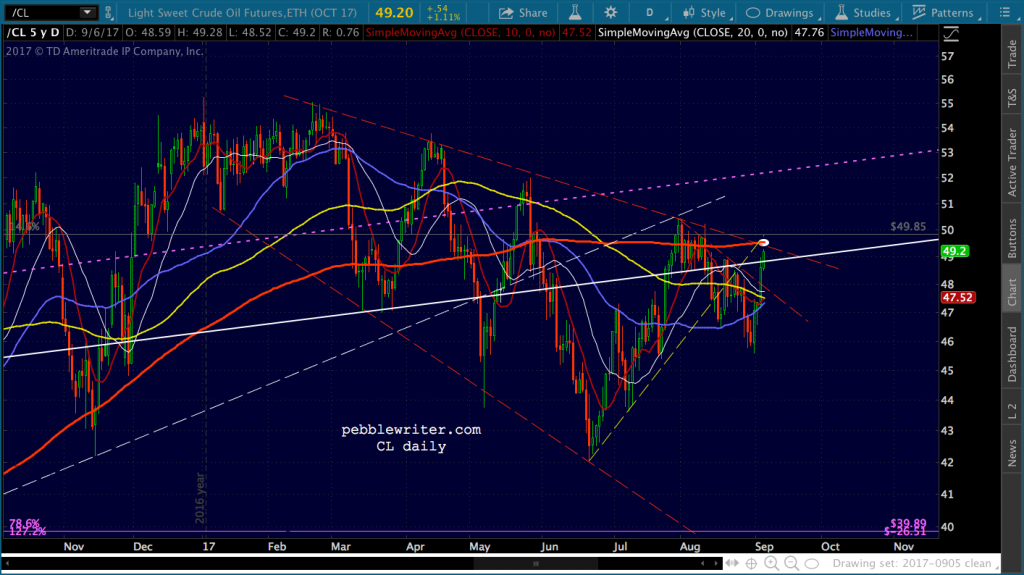
First, a quick look at WTI shows it’s running into resistance at the red TL and SMA200. Time for a reversal.
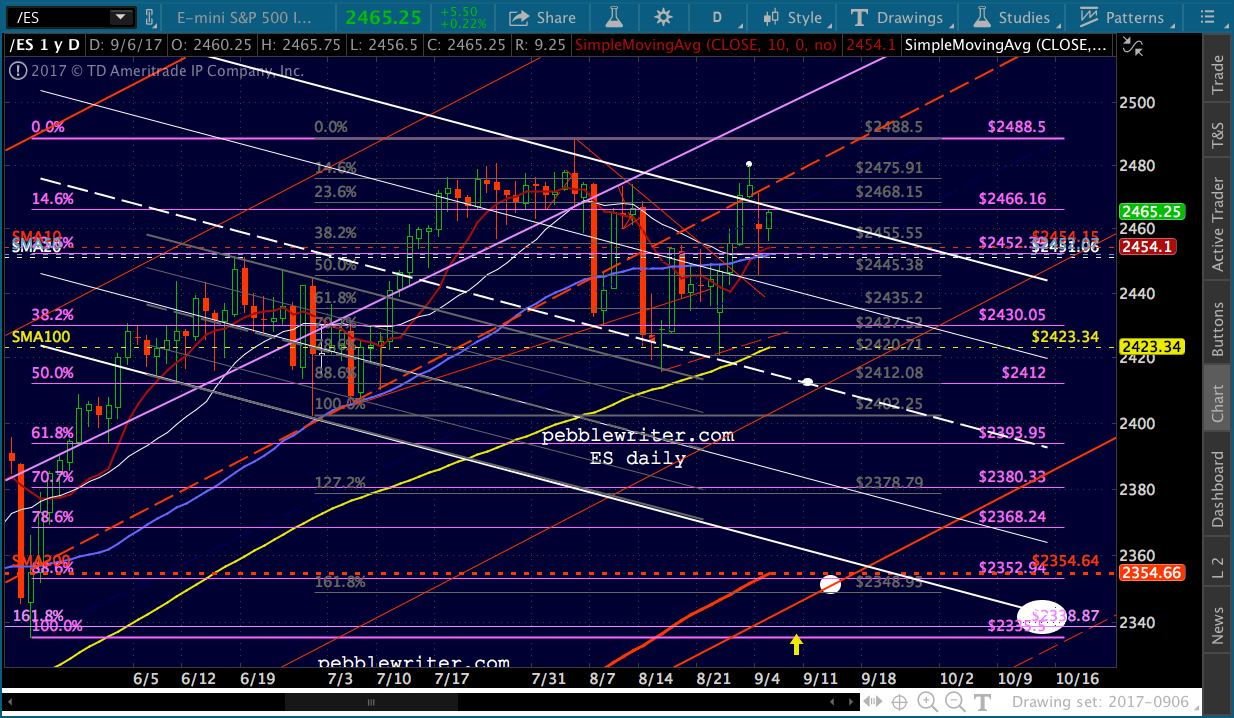
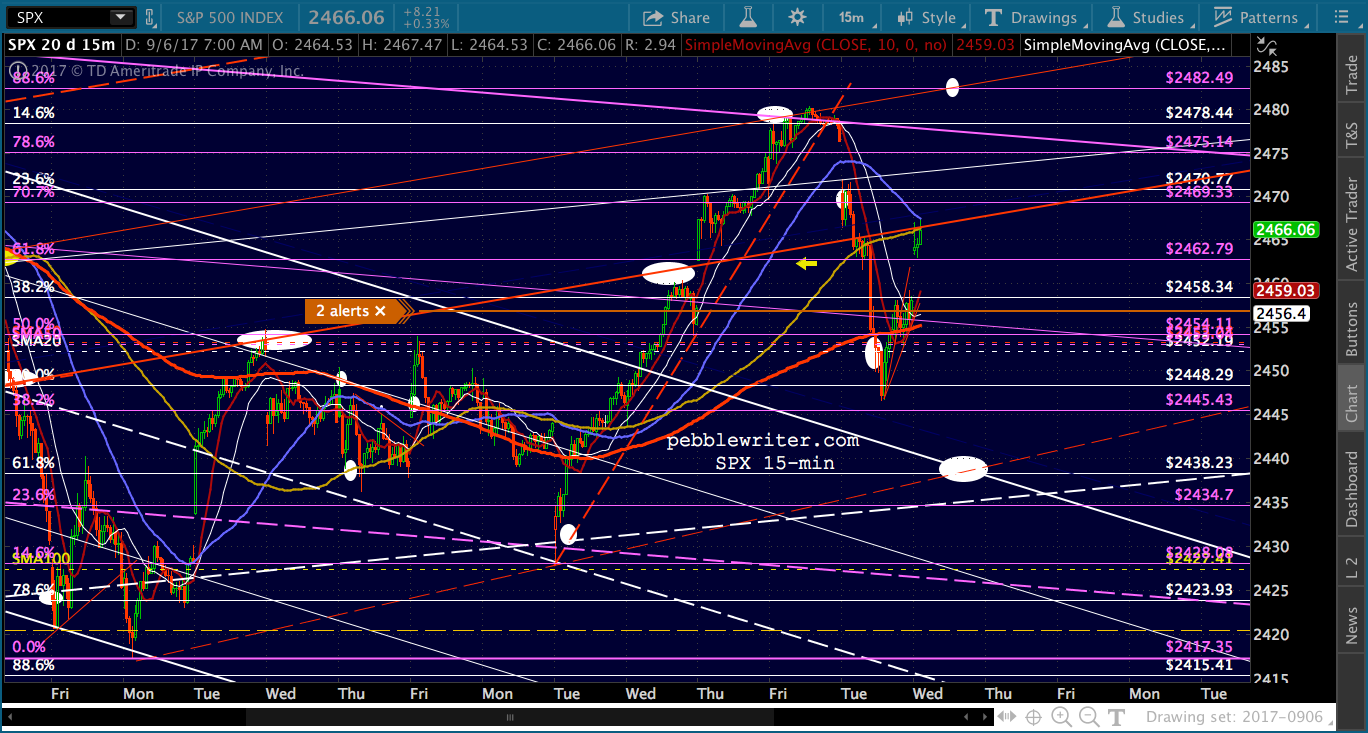
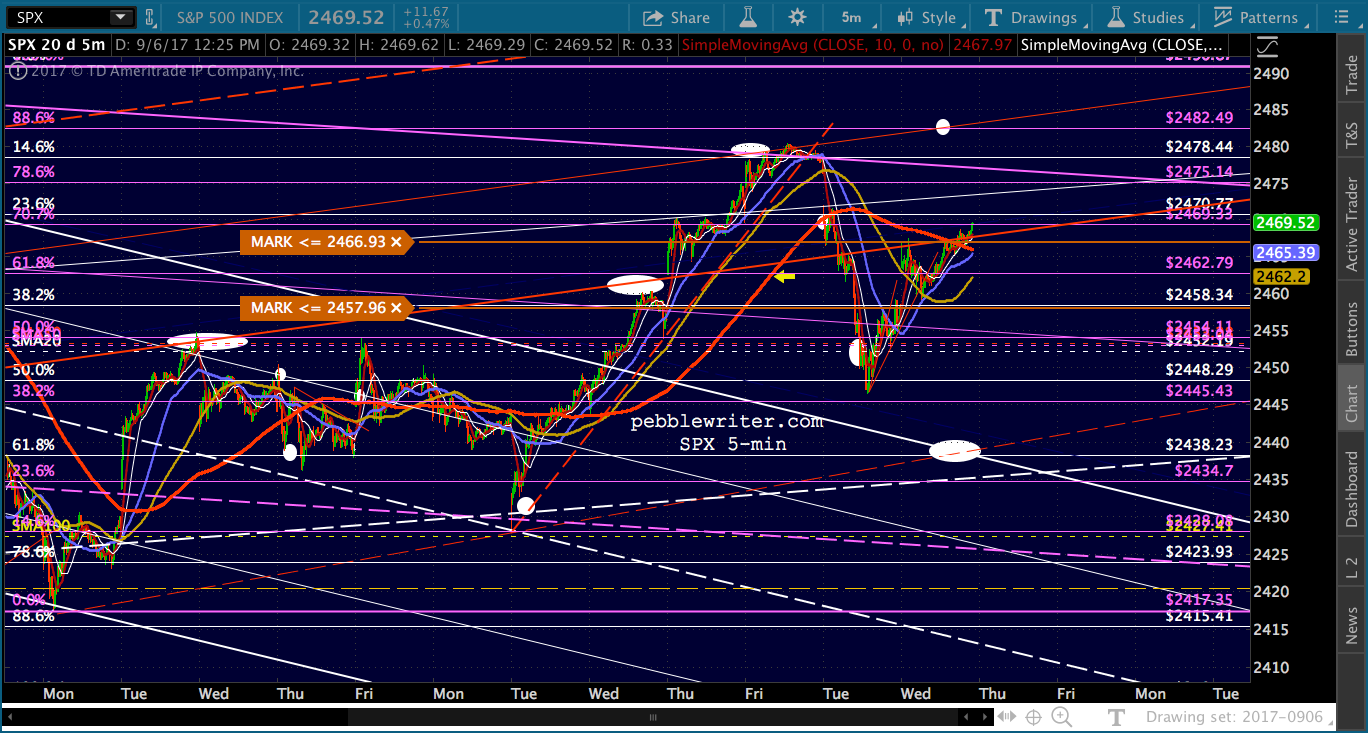
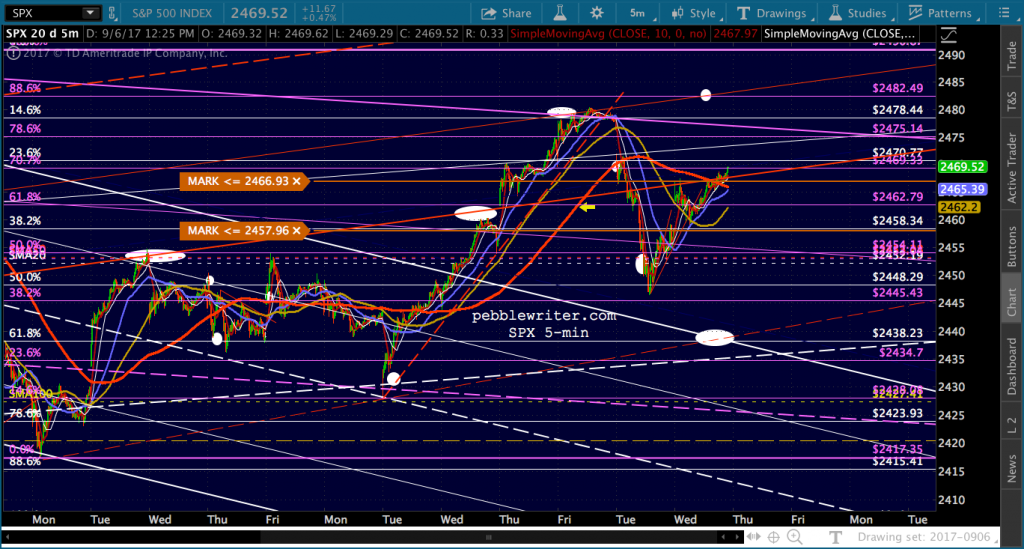
 The big picture for SPX and ES, just in case things get out of hand.
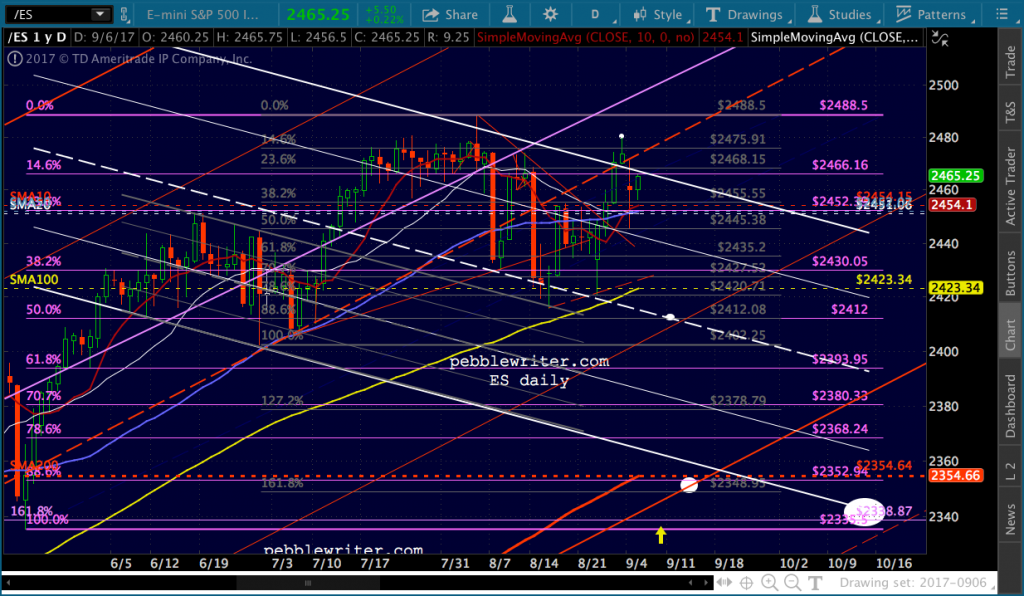
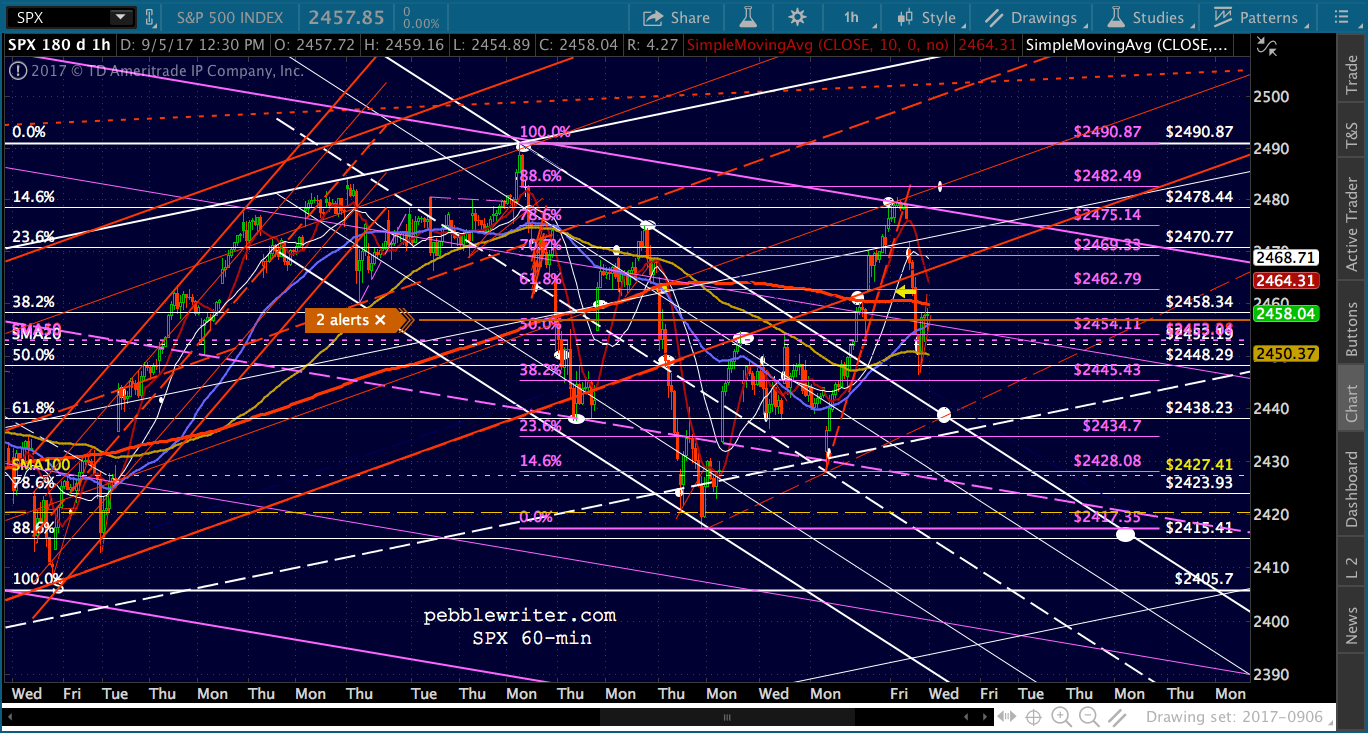
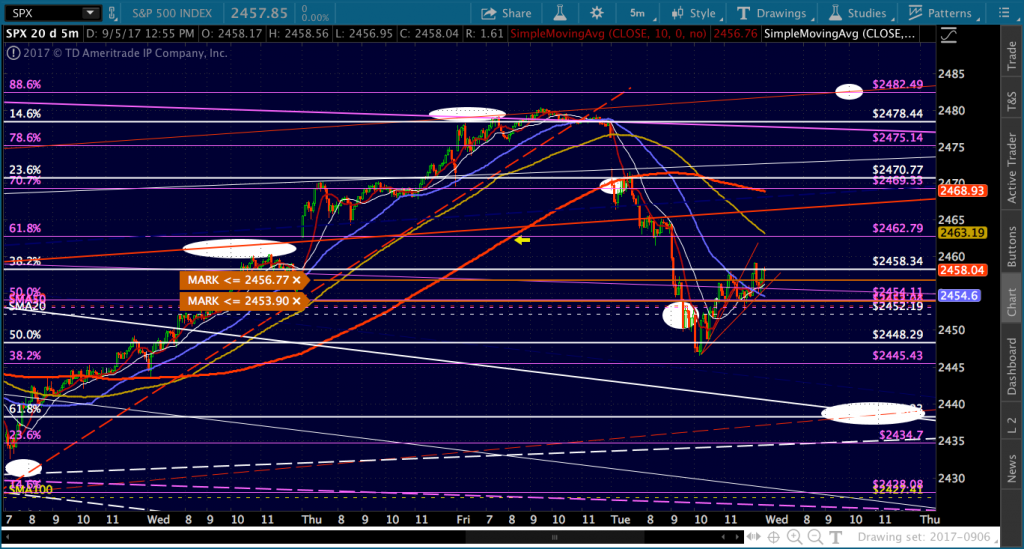
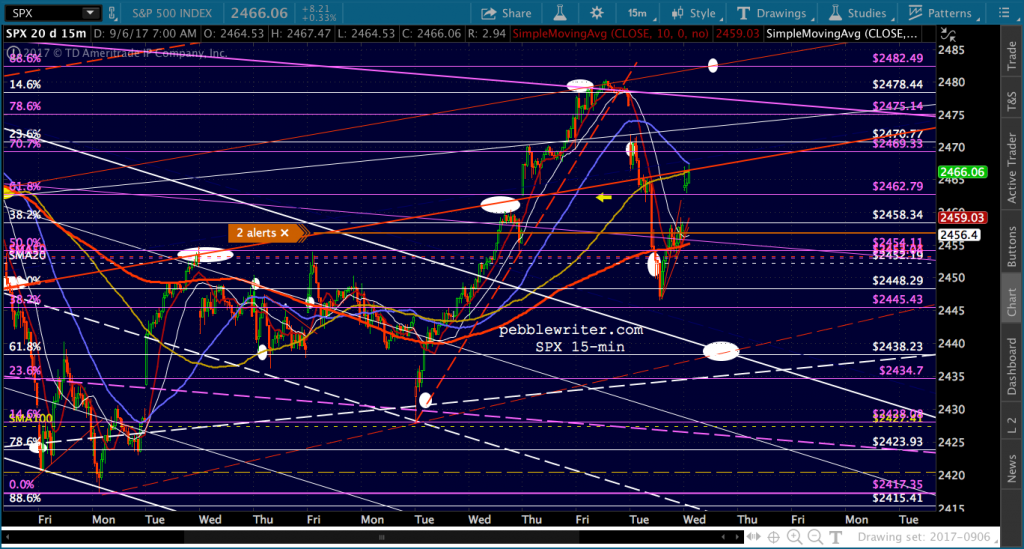
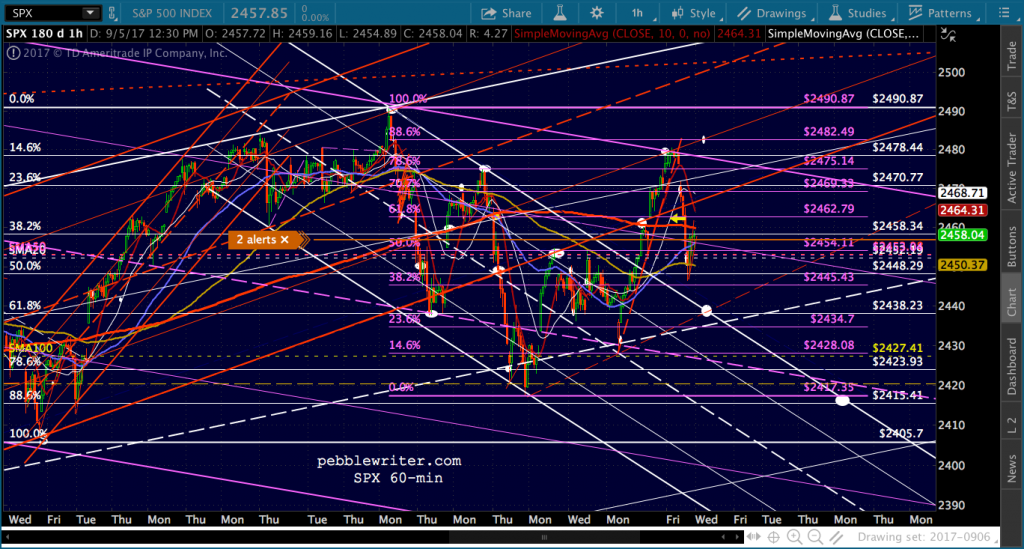 The initial bump should get SPX up to a backtest of the red channel, with the SMA5 200 just above at 2468.95. My gut tells me we’ll get another leg down. But, we’ll have to see what happens with CL, VIX and USDJPY.
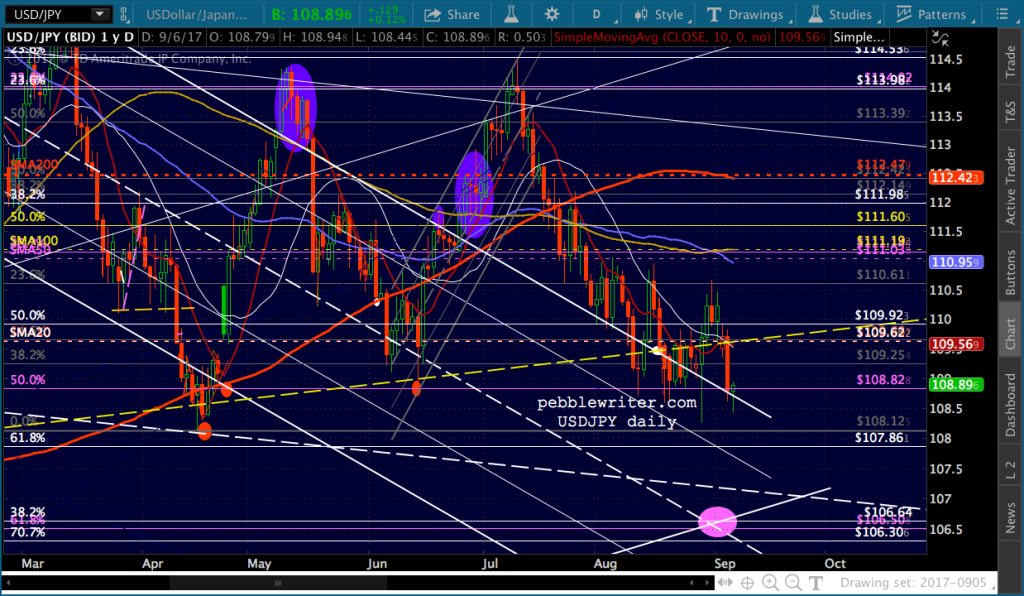
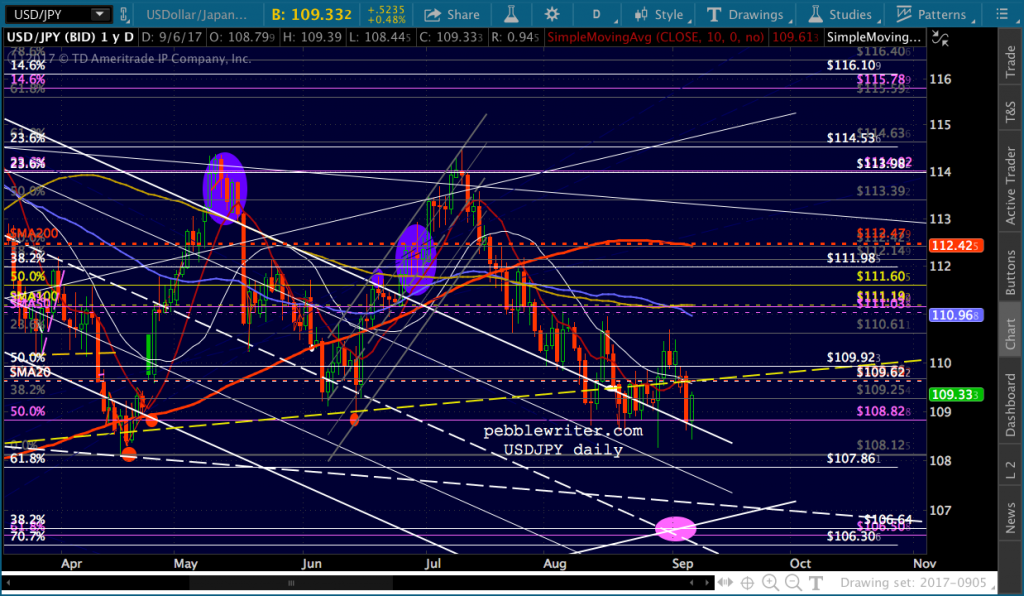
  USDJPY continues to limp along, with yesterday’s dovish Fed comments not helping much. It’s the .618 Fib that intersects with the white channel bottom that has me thinking this could be more than the usual 1% V-shaped dip.
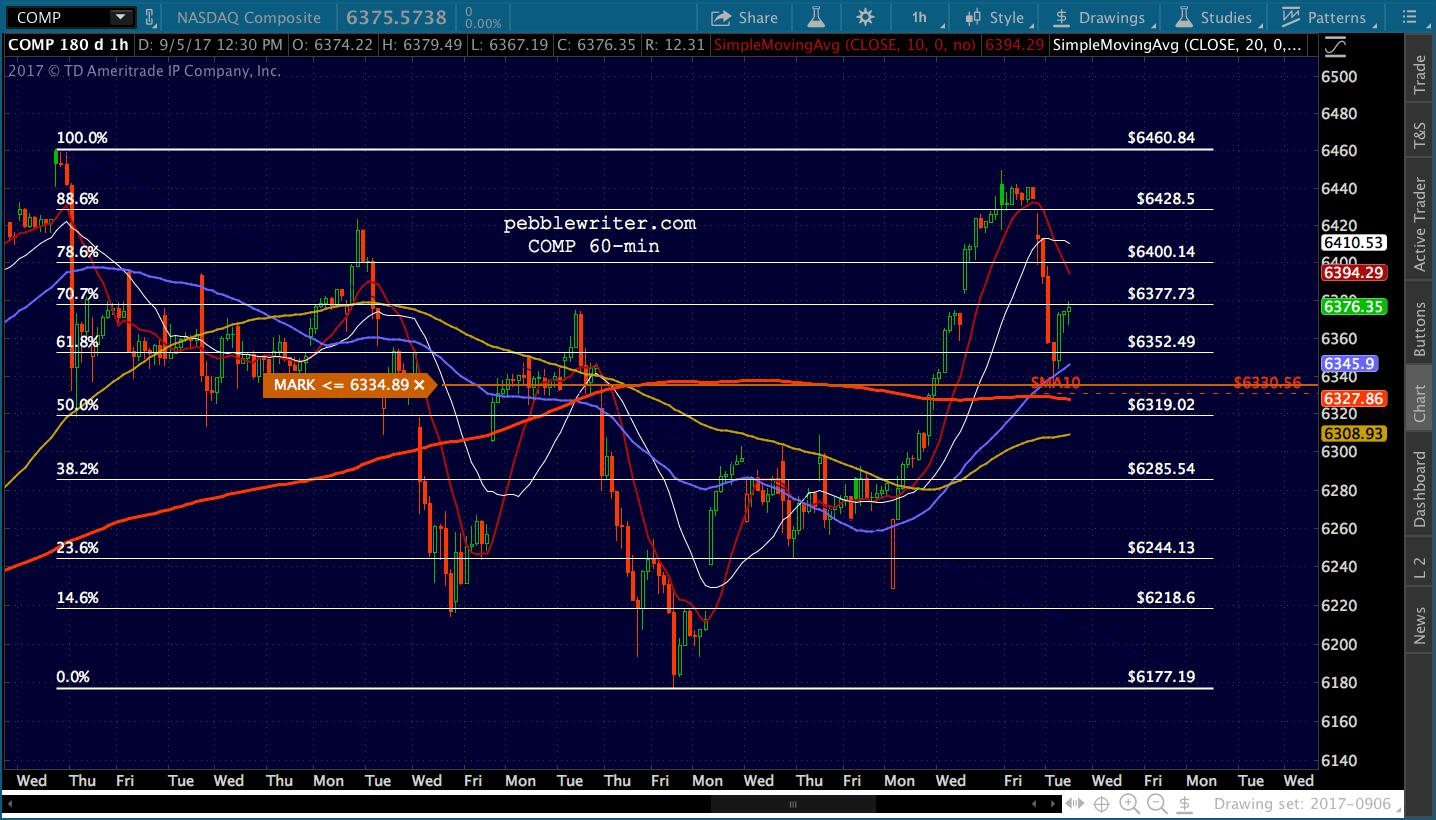
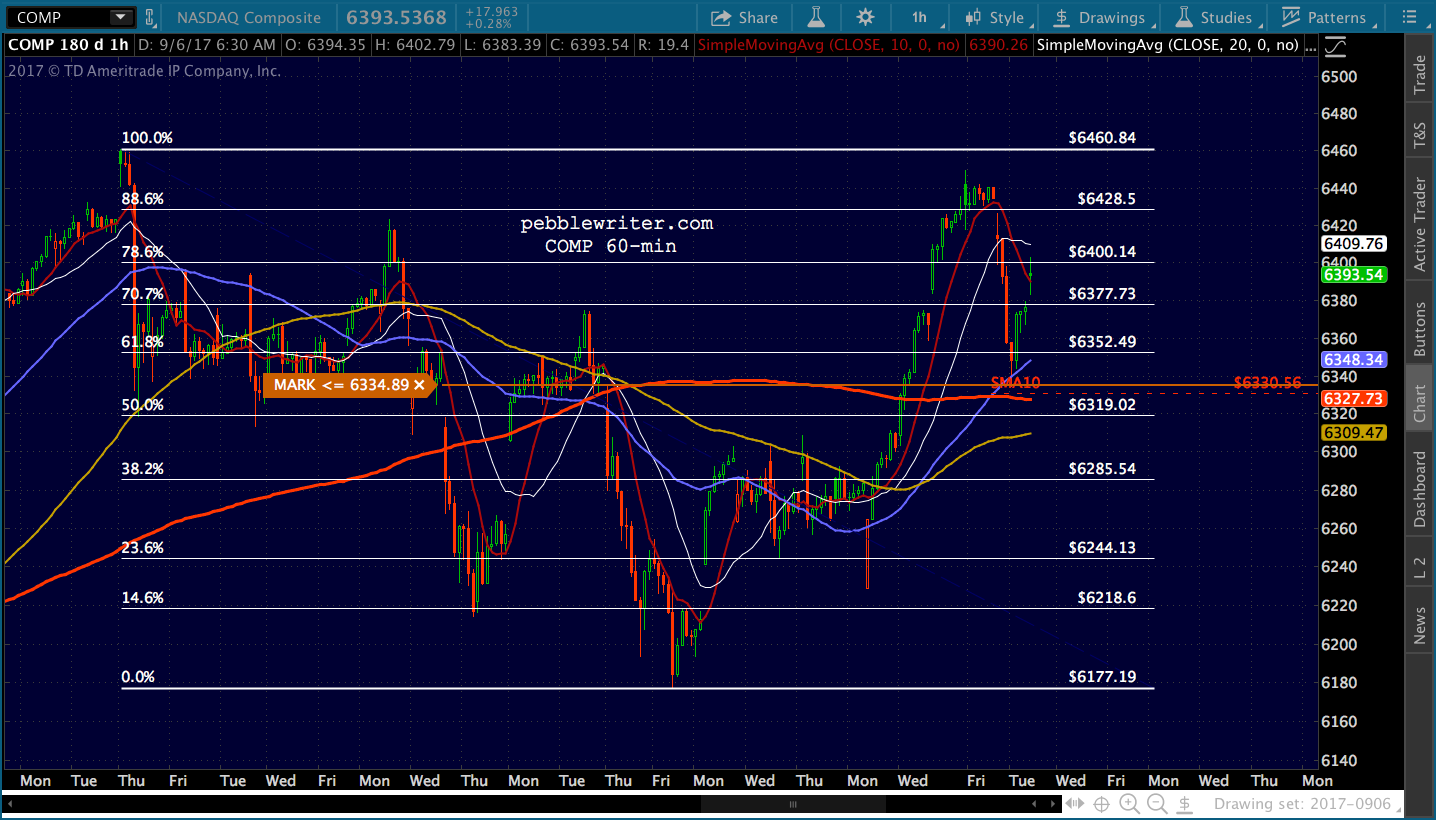
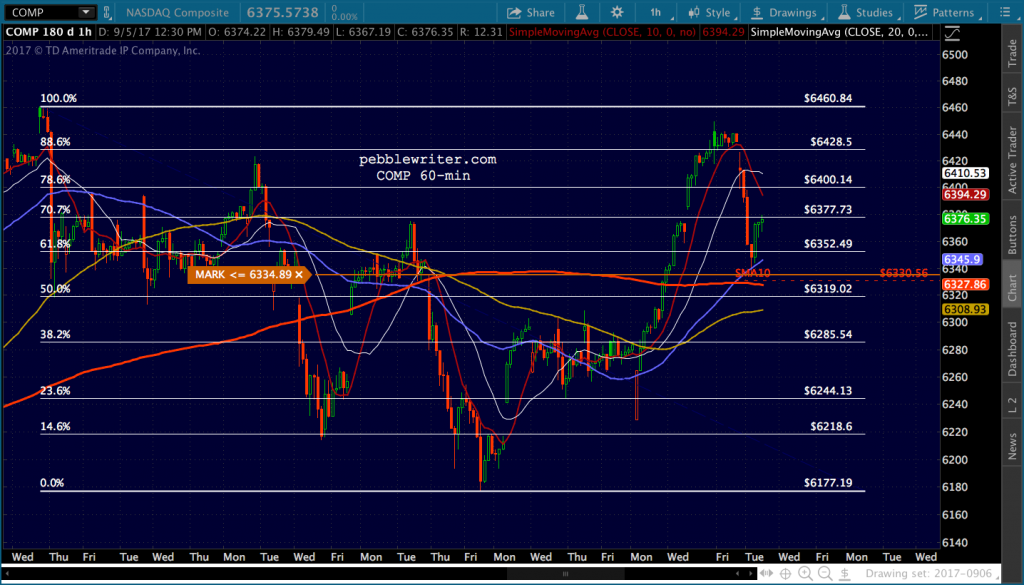
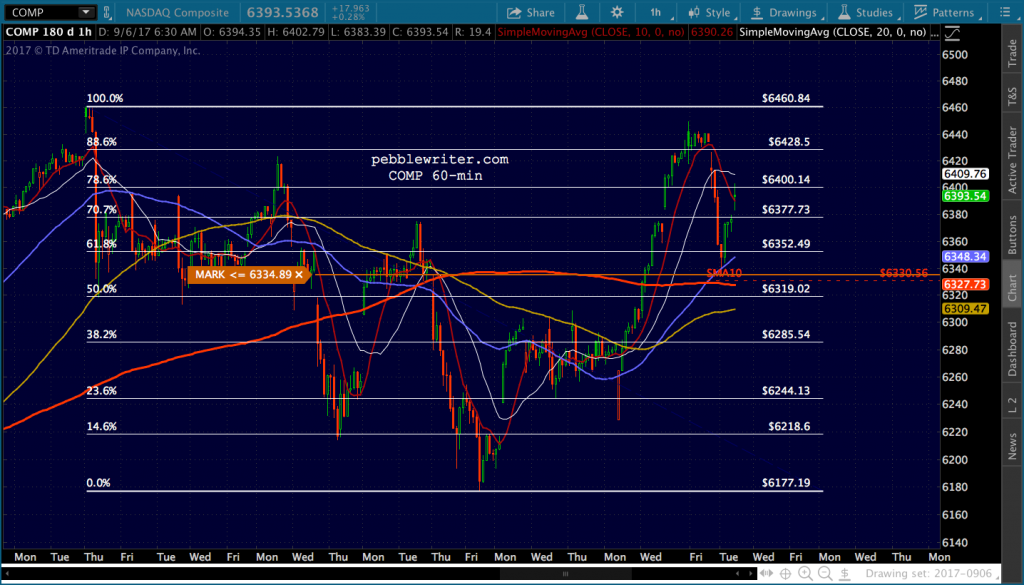
 Also, we’ve been keeping an eye on COMP, which just missed tagging its SMA10 yesterday. Might it take another swipe at it today?
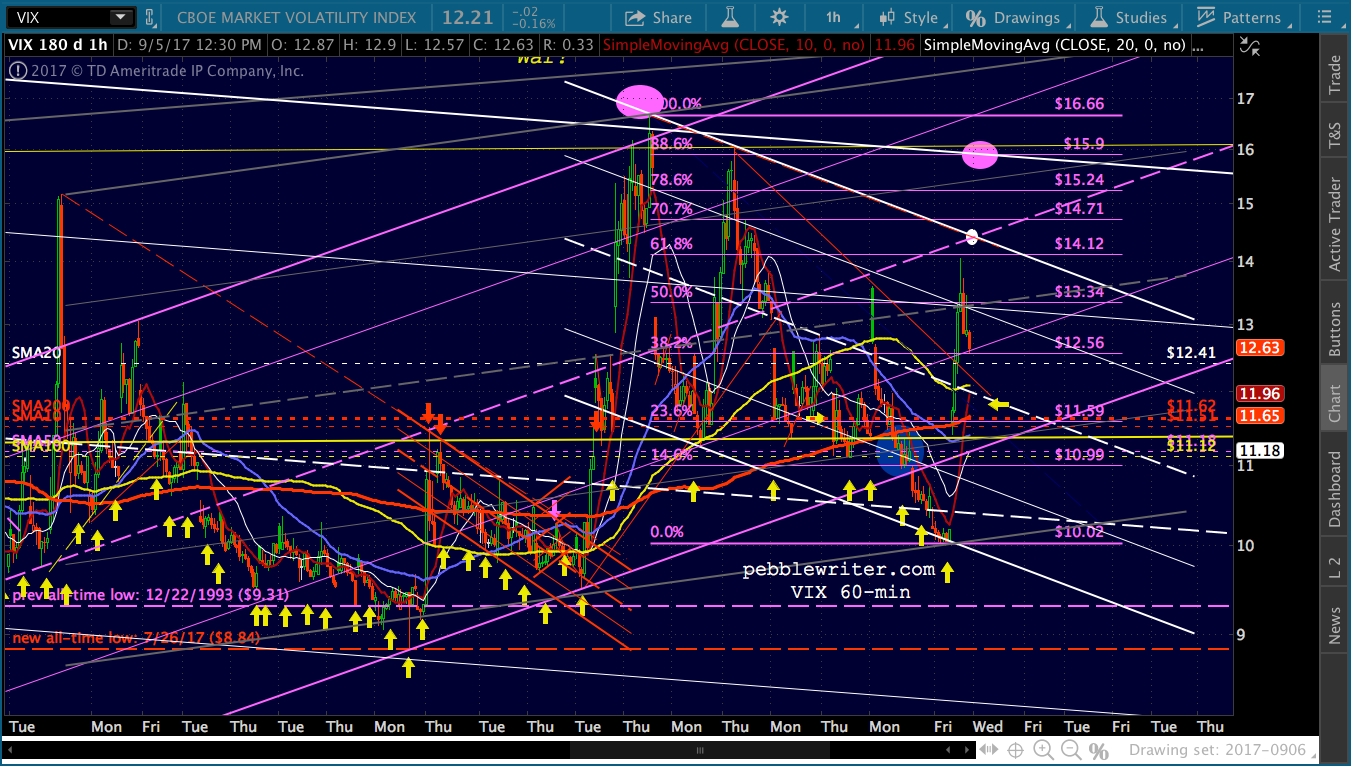
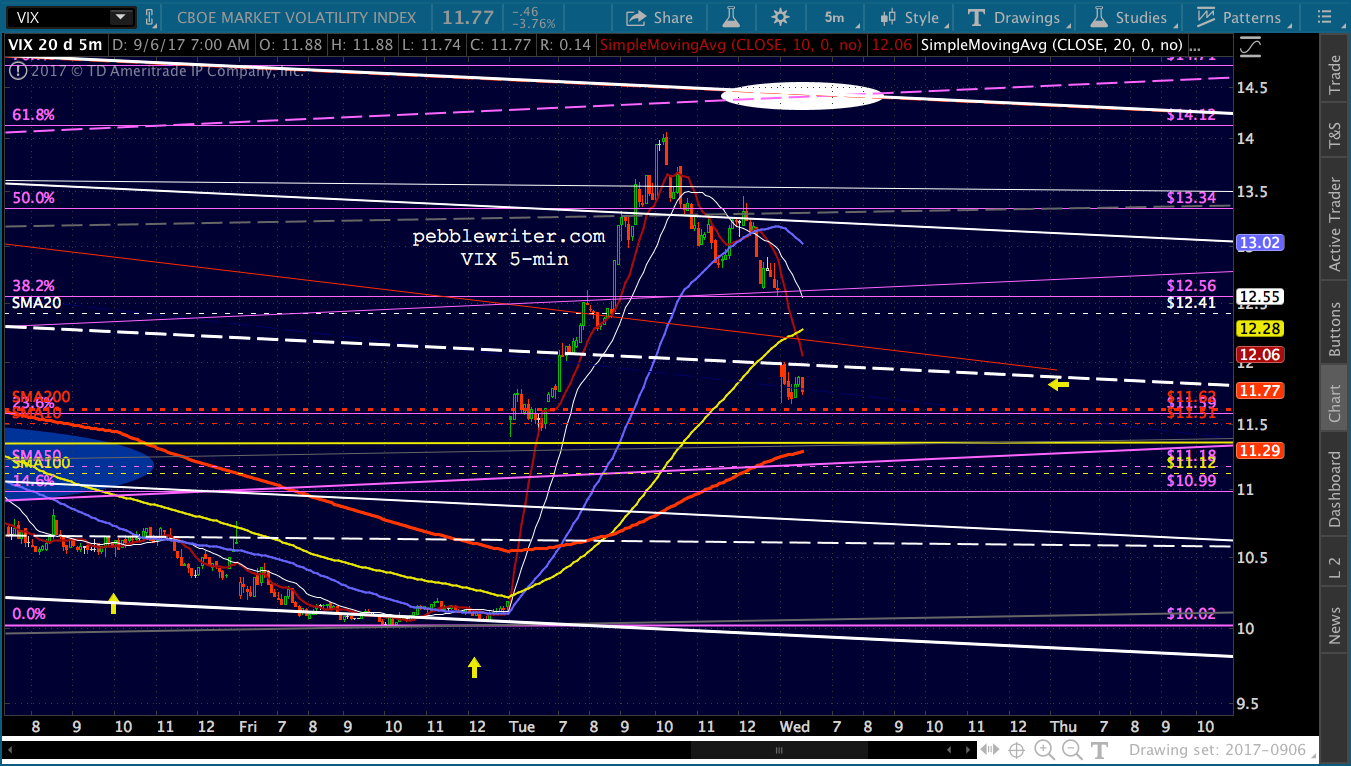
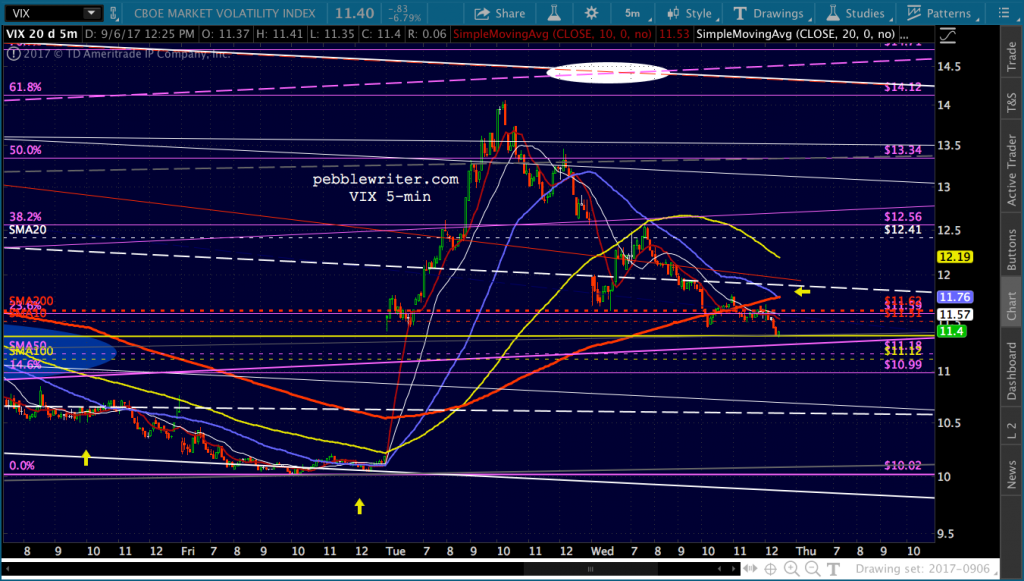
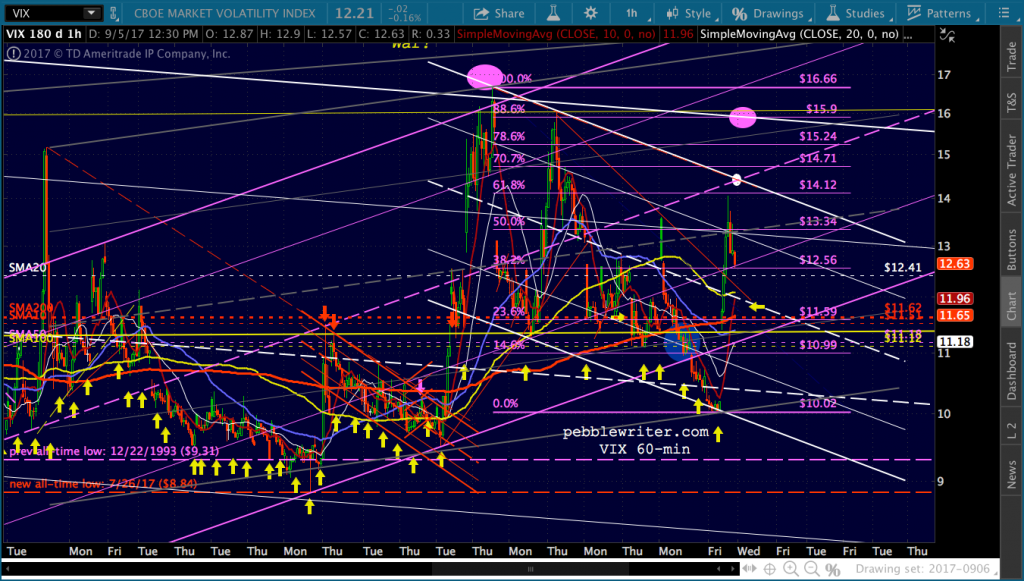 And, last, VIX — which has two clearly defined upside targets if allowed to go in that direction.
UPDATE: 10:06 AM
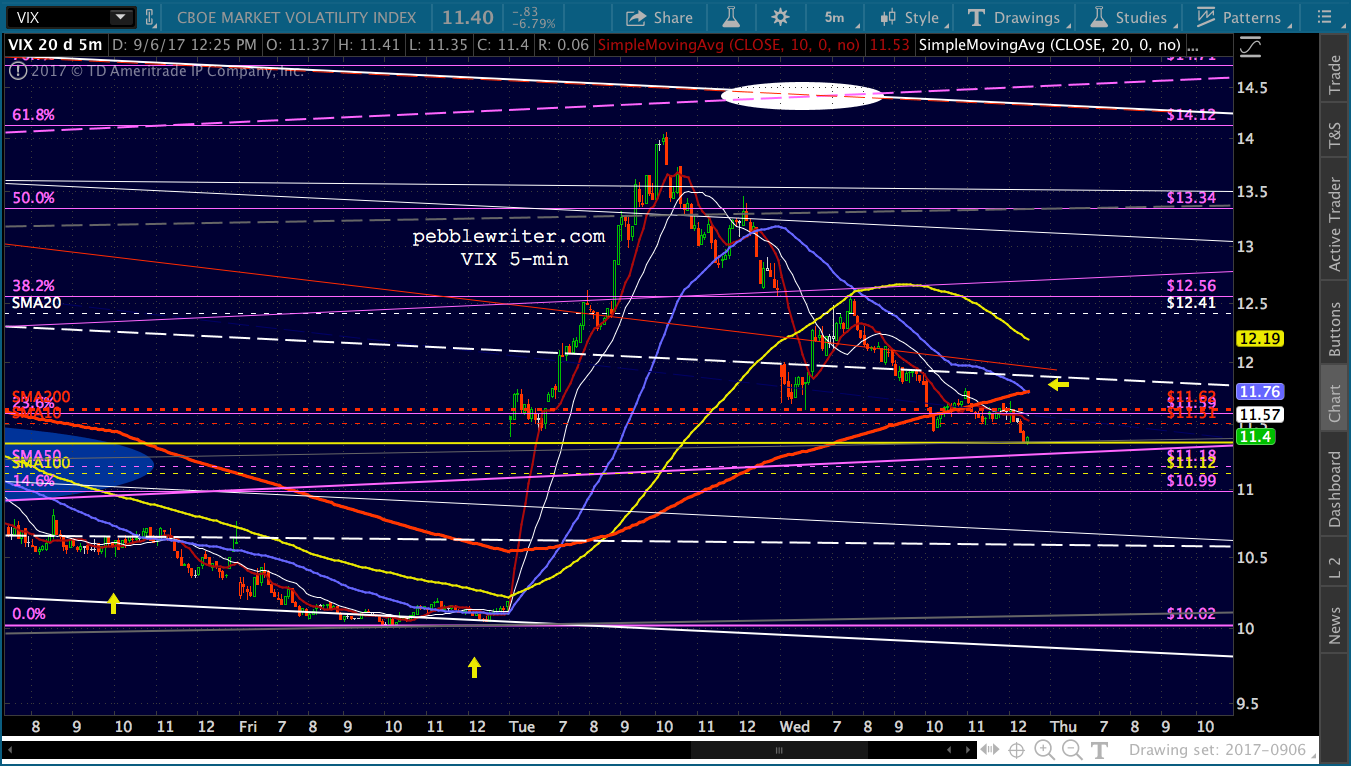
VIX has dropped down to test the SMA200, and USDJPY is rallying for no particular reason. Otherwise, the initial pop would have fizzled by now. But, it’s still early…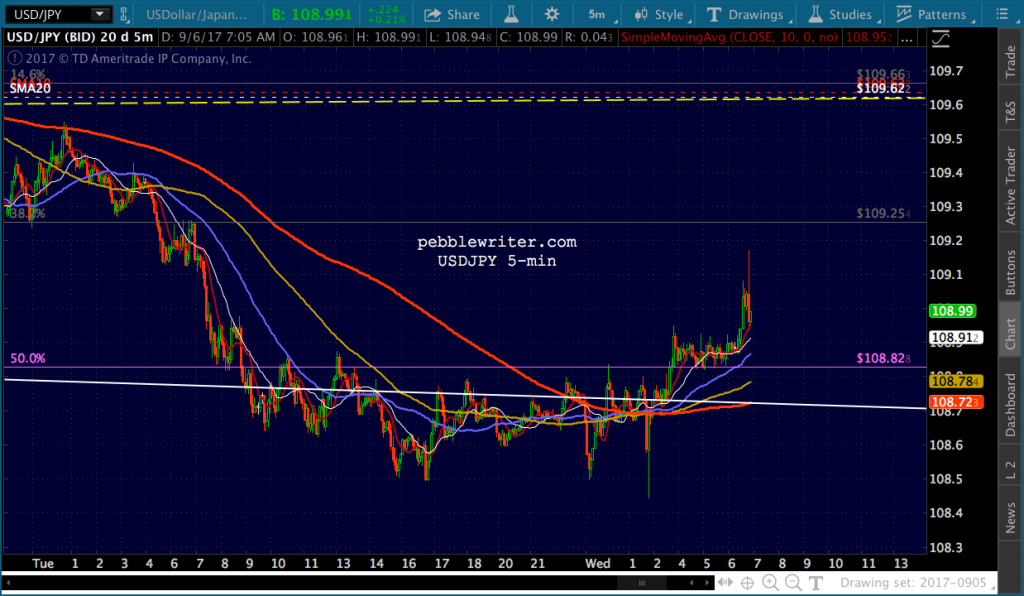
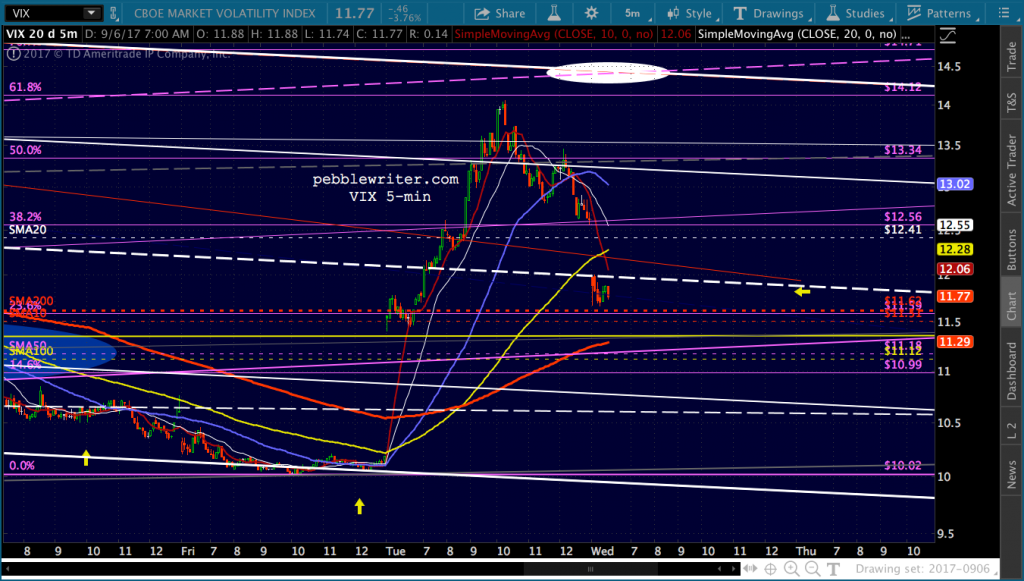 I think it’s as simple as whether or not VIX bounces at the SMA200. If it does, we’re looking at another leg down to 2438 or lower. If it plunges through it, then 2482.
 I’m going to focus on CL and try to get that posted before I have to take off.
UPDATE: 3:30 PM
SPX is sitting just above the SMA5 200, exactly where it’s either going to reverse lower or break out. The implication is that it’s going higher to the .886. But, the fact that VIX hasn’t collapsed or CL broken out or USDJPY made new highs argues otherwise.
Note that VIX is below the SMA200, but not below the yellow channel bottom. It’s either a pretty good tell or a pretty good head fake.
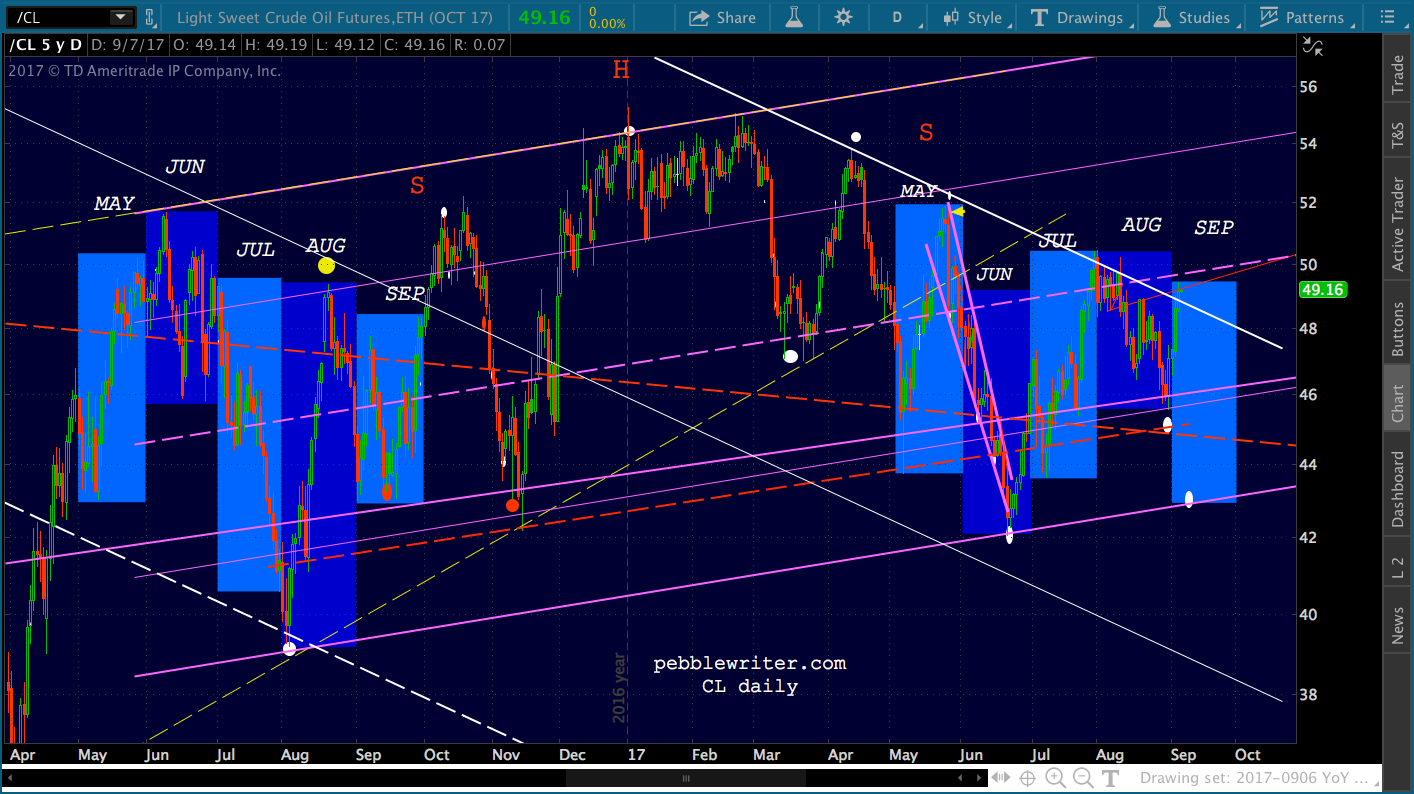
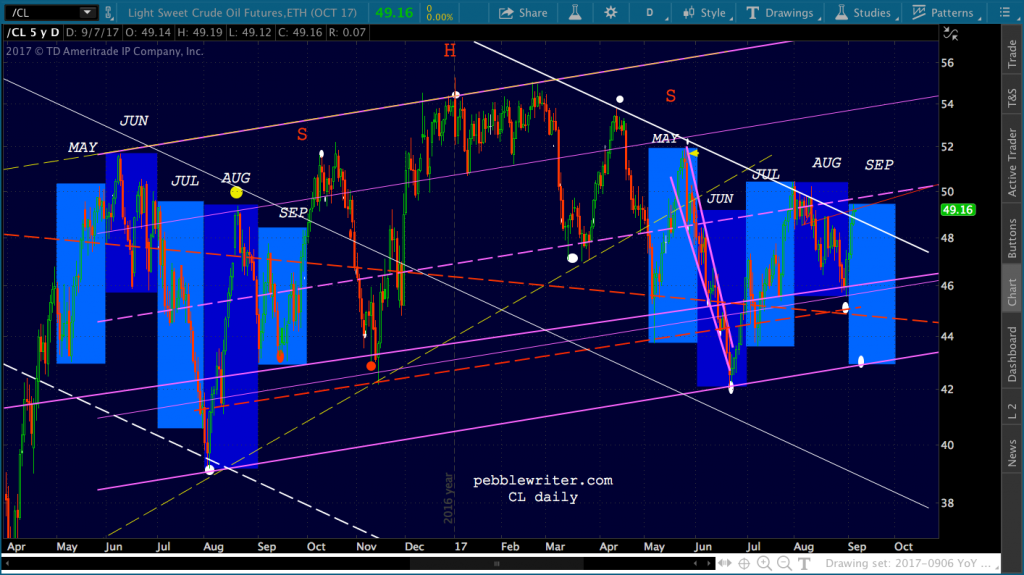
As to CL, I think this is the top. But, I have more calculations to do before providing a target. I’m in transit, but should have a chance to post those charts around 5:30-6:00 EST.
 UPDATE: 6:20 PM
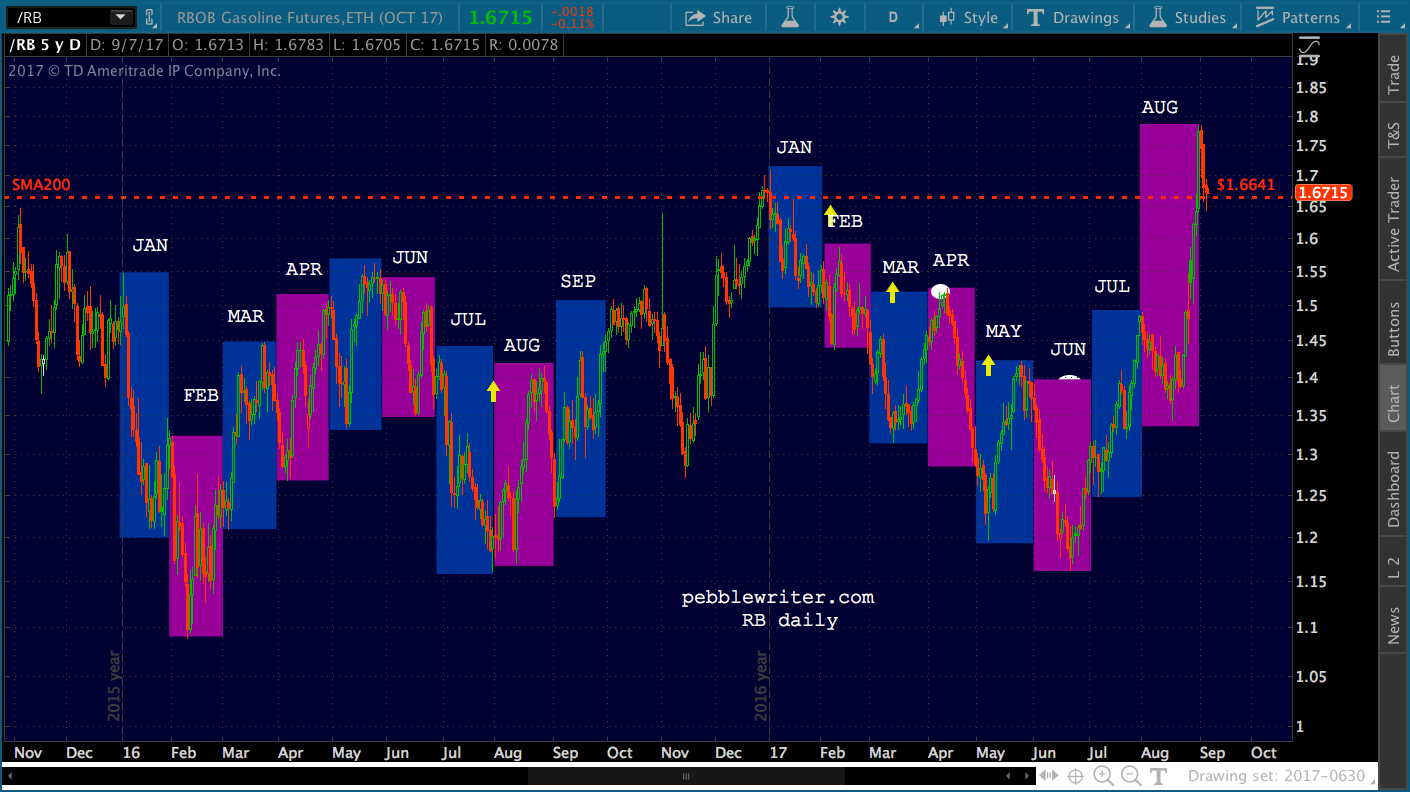
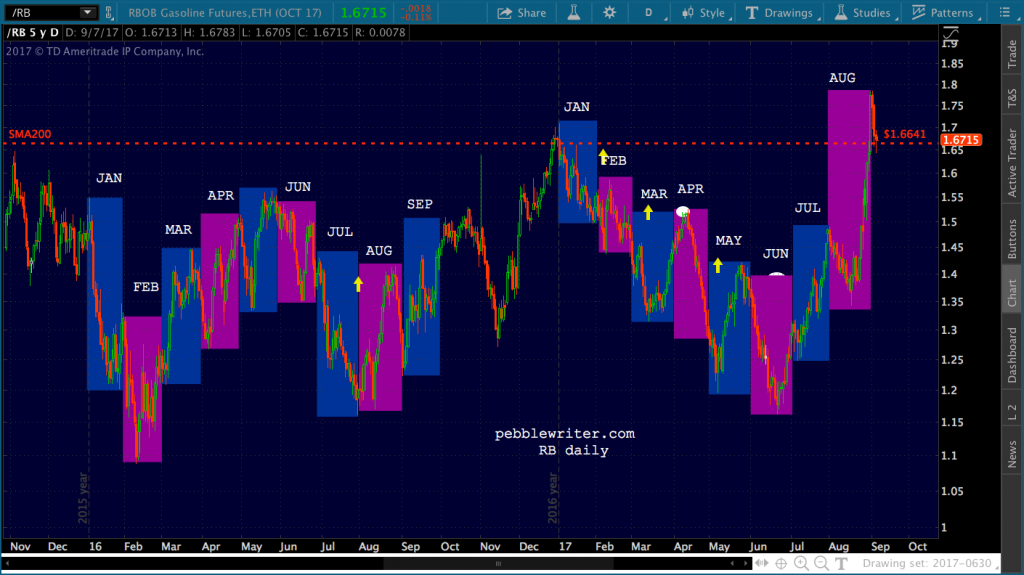
For CL, the two charts below support my expectation that prices are headed lower. Whether you’re talking about CL or RBOB, the August YoY comps spell higher inflation than the Fed would like (higher inflation = pressure to raise rates…not desirable in this environment with slowing economy and high “hidden” inflation.)
I don’t have my oil price database with me on this trip. But, the EIA is showing a very healthy monthly increase in average gas prices for August (3.9% MoM and 8.4% YoY.) I believe this is understated, but my back of the envelope calculations indicate CPI should come in at 1.9% or higher.
Given that August’s YoY increase will be wildly higher, we should expect CPI to easily exceed 2% and potentially 2.5%. I think the Fed will have no choice but to try to tamp down inflation and, therefore, oil/gas prices. The fact that API reported a 2.8 million barrel build versus last weeks 5.78 million barrel draw is icing on the cake. But, we’ll find out for sure tomorrow morning when EIA data is released.
 More tomorrow morning.