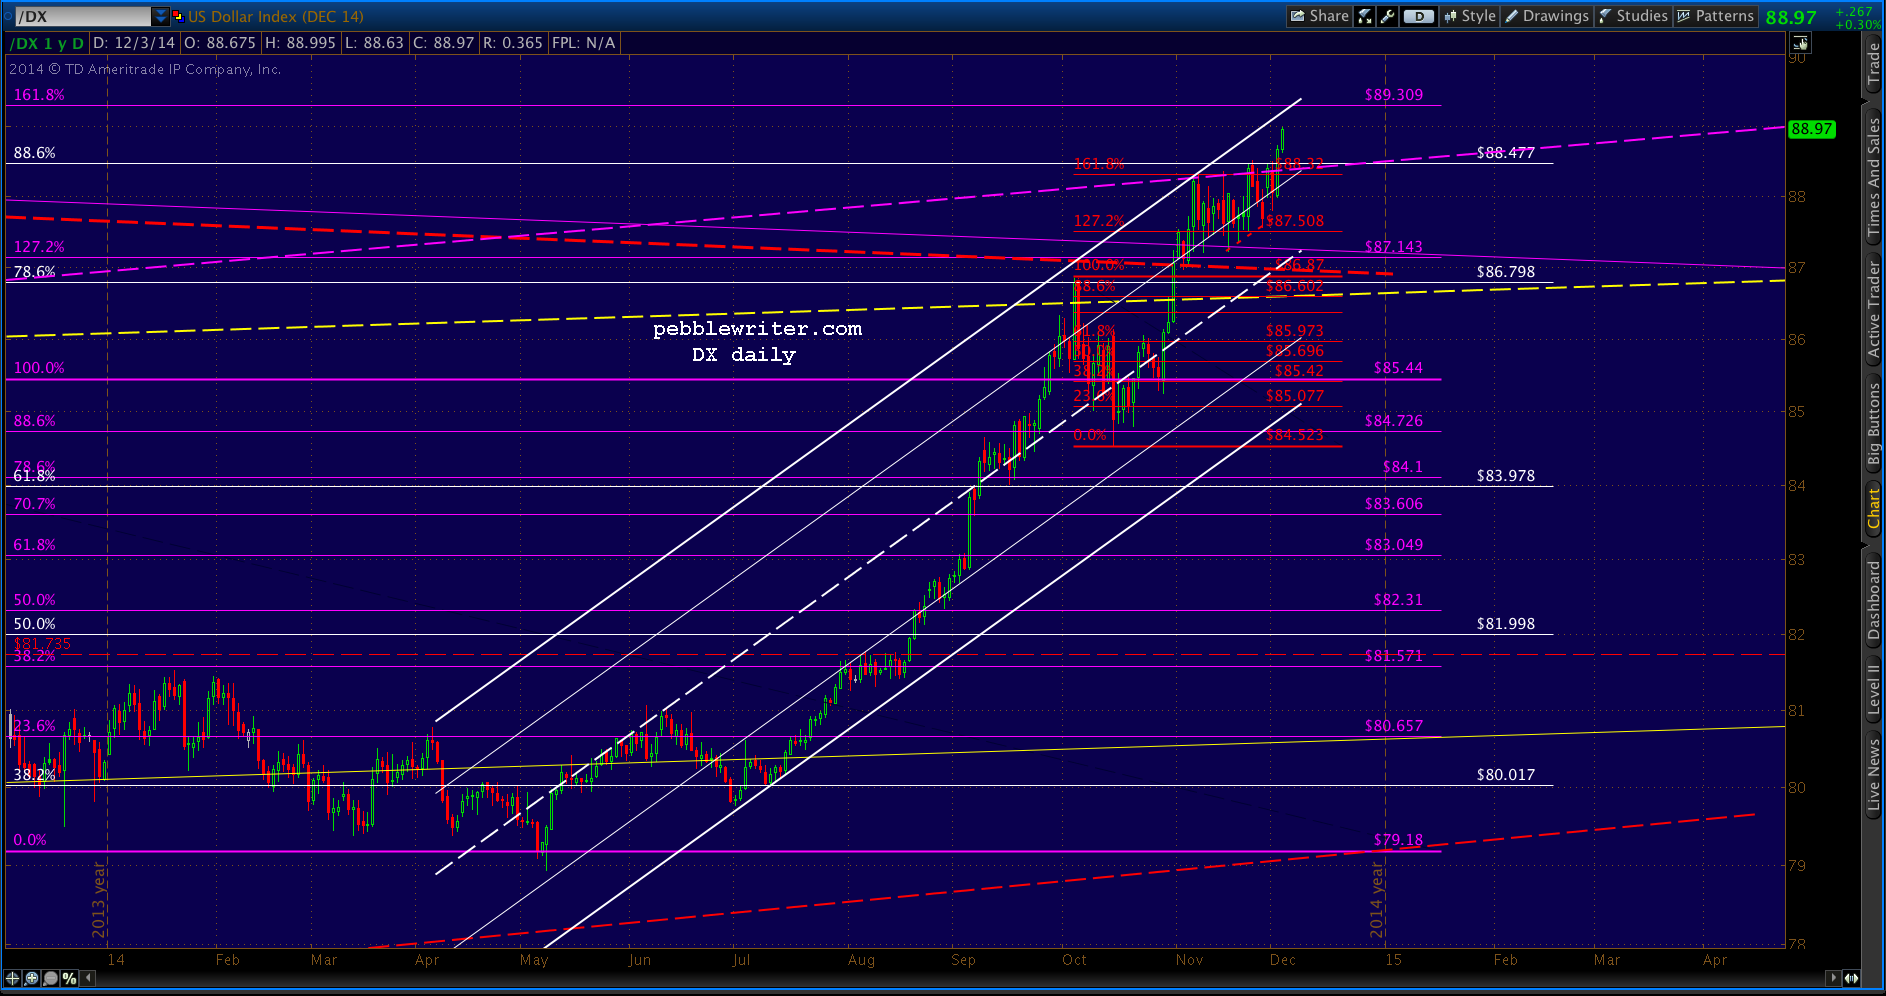
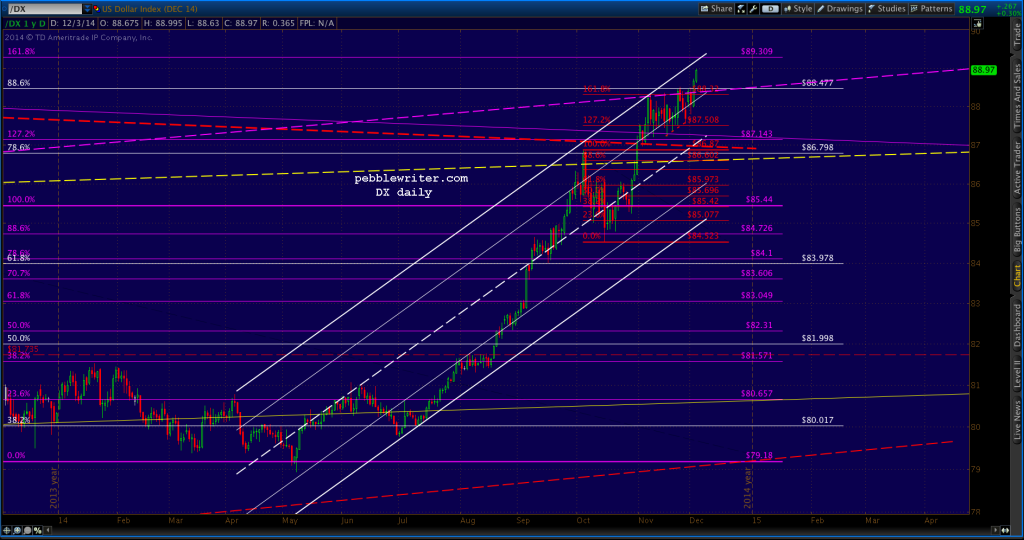
DX reached a major Fibonacci level (white .886) on Nov 21, reversing just enough to hint at a more significant reaction to come. But, the reaction was muted, and in fact DX repeatedly tagged and retreated from that level three more times before punching through late yesterday.
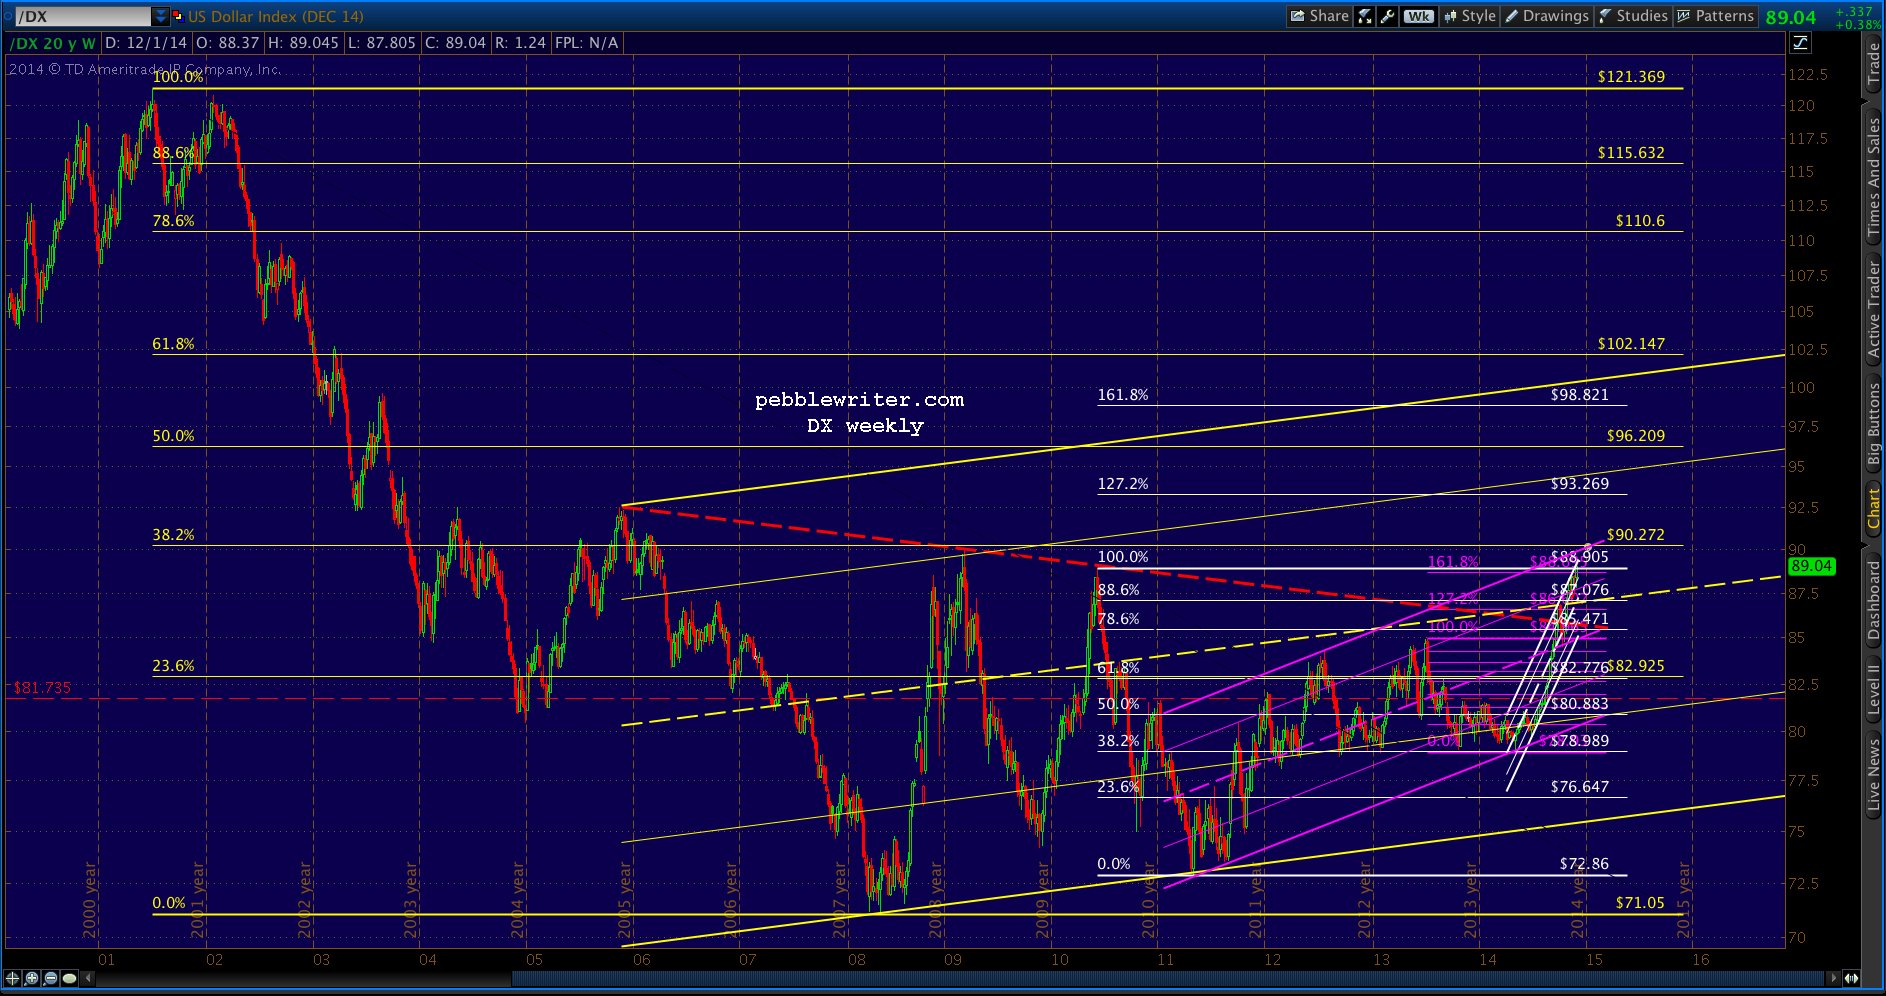
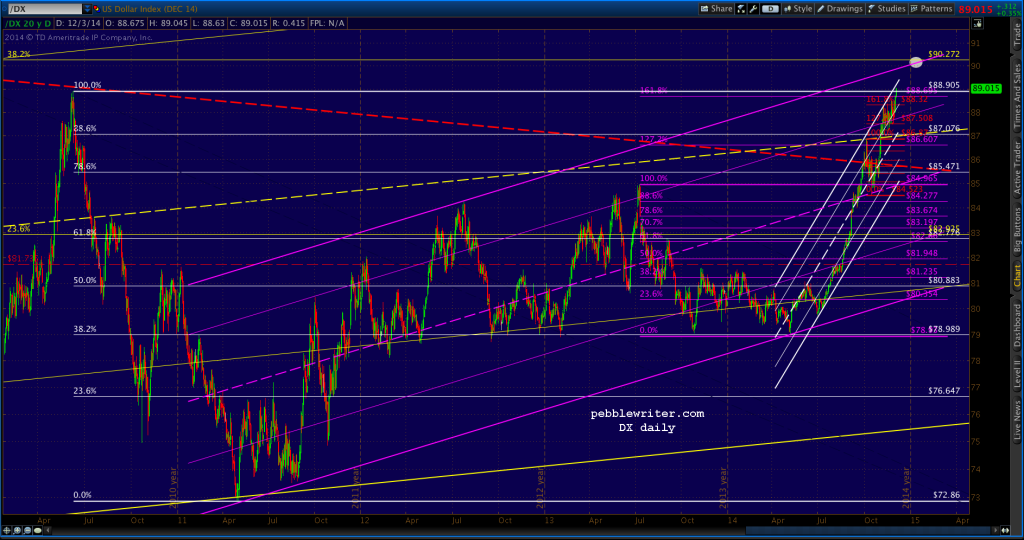
 Adjusting for the contract change and moving the Fibonacci grid to the later peak in Jun 2010, we can see DX has today exceeded that peak and is closing in on the .382 (90.27) of the largest drop: from 121 in July 2001 to 71 in April 2008.
 The weekly chart:
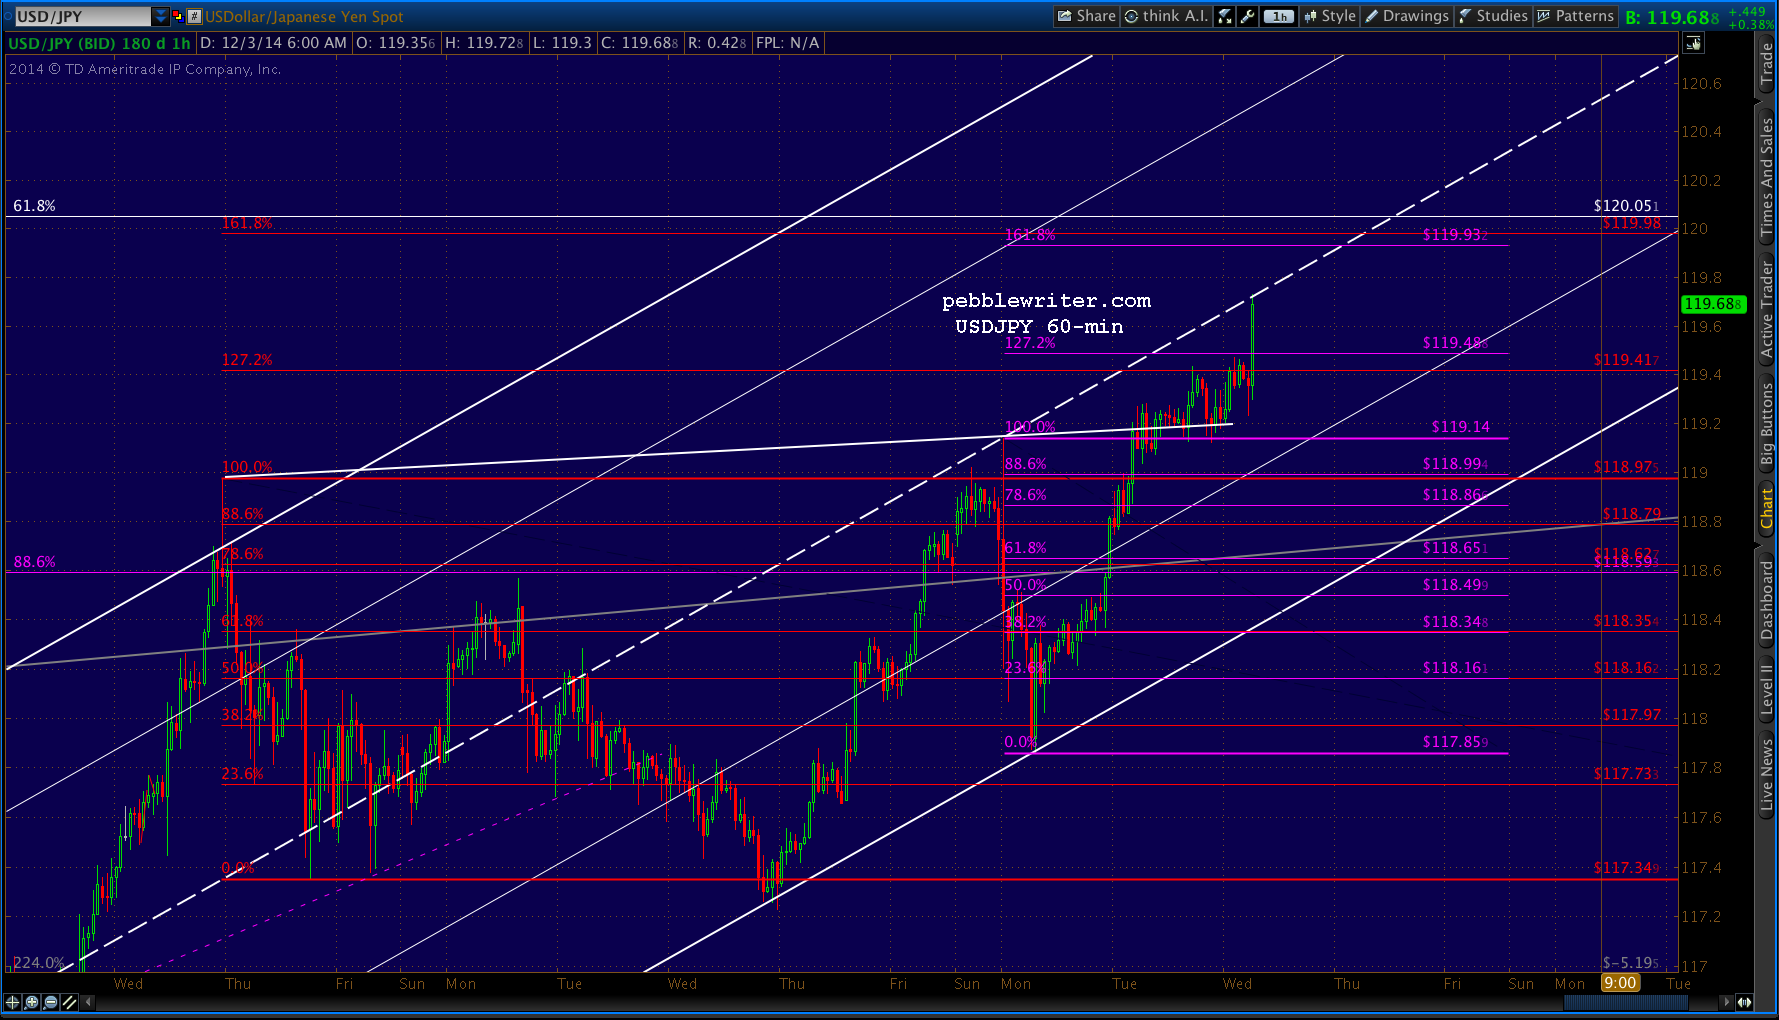
 I’ve read all sorts of gobbly-gook over the past month regarding the market impact of a stronger dollar. The bottom line is it makes the yen cheaper by comparison — meaning it fuels the yen carry trade, which means higher equity prices. Note the USDJPY’s spike higher this morning.
 For those who are new to the concept, the yen carry trade has been around for a while and is fairly straight-forward. Borrow in yen at near 0%, invest in higher yielding instruments such as US treasury bills and pocket the difference. The only risk is that the yen would appreciate against the invested instrument’s currency, and one might face an FX loss when closing out the transaction.
When the BOJ announced they were going to cheapen the yen into oblivion, everything changed. Investors suddenly didn’t have to worry about the currency risk; instead, it would be a currency gain. They also found a more lucrative place to invest the proceeds of their borrowing: equities.
Since the BOJ also decided to prop up the Nikkei, investing the proceeds into Japanese equities became less risky. And, when the Fed jumped on board with the Bernanke (and now, Yellen) put, US equities became more of a “sure thing.”
Today, we see tick-for-tick increases in US equities every time the yen dips (and USDJPY spikes.) The correlation has been around 96% since the mid-October swoon. 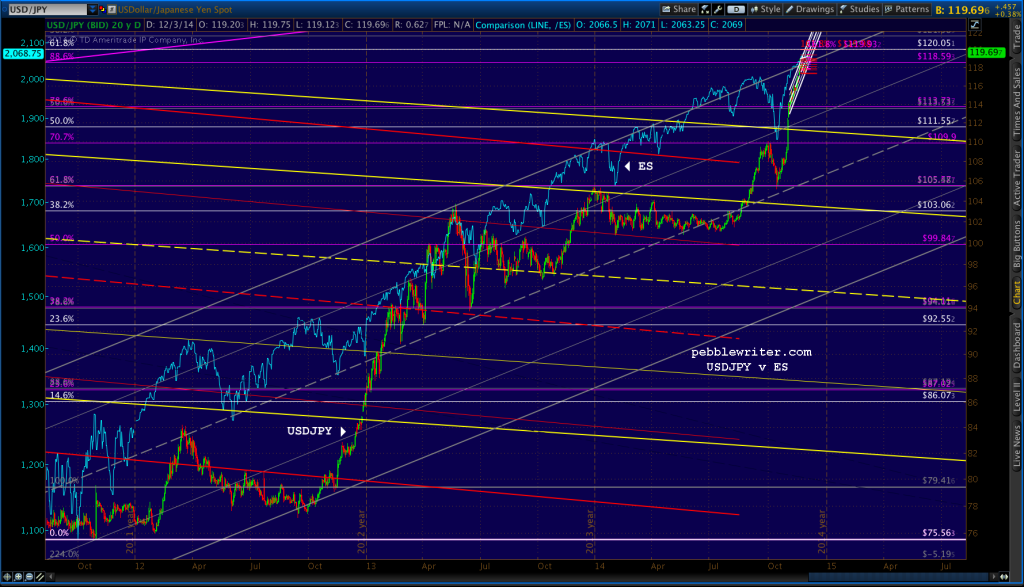 The only times we see divergence between USDJPY and ES are when USDJPY dips precipitously. But, then, there are other means with which to prop up ES, such as VIX. USDJPY often “resets” after the US cash markets have closed (it’s done its job for the day by levering ES higher) lest it sail right off the top of the chart.
As long as the yen continues to cheapen, and central banks continue to intervene in equity markets (directly and indirectly) the yen carry trade will continue to work.
Abe has shown little interest in throttling back Japan’s QQE, even in the face of mounting criticism of the impact on households and businesses alike (cheaper yen = more expensive imports – especially food and fuel.) In fact, the latest decision to expand QQE on October 31 is considered by many (including yours truly) as a desperate last gasp of policy which has clearly not managed to invigorate the Japanese economy.
From the US standpoint, a much stronger dollar conveys many benefits. Imports (fuel, food, cars, Toyotas, etc.) are obviously cheaper, which makes keeping inflation under control a lot easier. This, in turn, helps silence the “QE leads to runaway inflation” critics. And, in a perverse twist, it gives the Fed ammunition for more QE down the road: “we’ve got to protect against deflation!”
The biggest prize of all? Low inflation permits interest rates to stay exceptionally low without a lot of intervention. Higher inflation would pressure interest rates higher — the last thing a country that’s $18 trillion (up from $10 trillion in 2008) in debt needs [note: more like $70 trillion in debt if one includes off-balance sheet obligations.]
Although the Fed intervenes in treasury markets to push interest rates around, it’s better and cheaper all around if the pressure for higher rates can be nipped in the bud. A higher US dollar accomplishes that. But, who does it hurt?
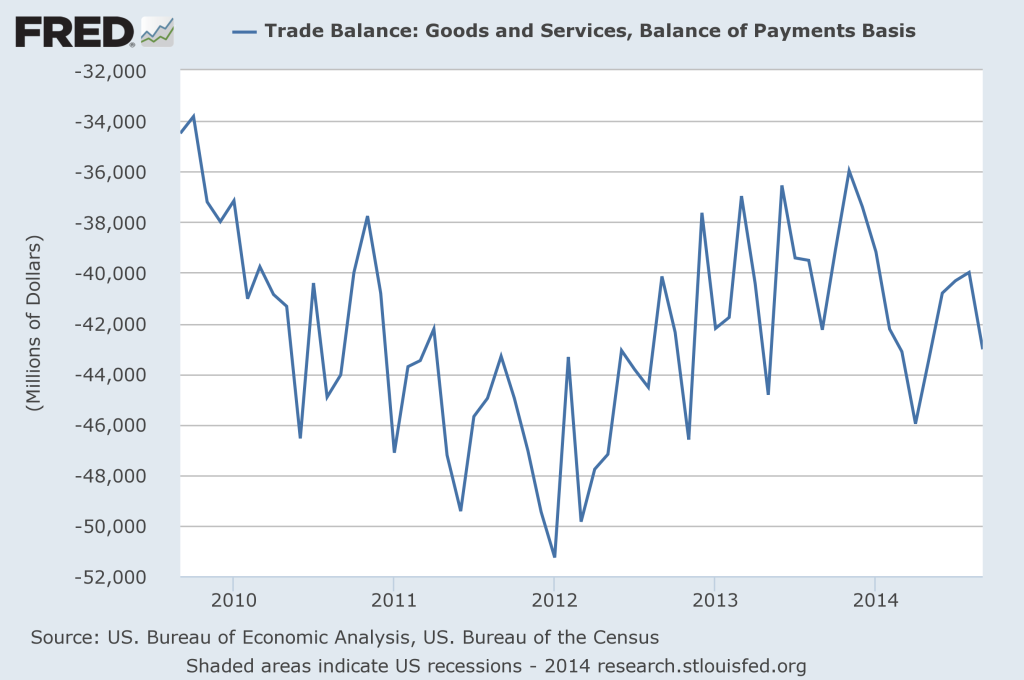
Obviously, US exporters are fighting an uphill battle. The US trade deficit, which bottomed out at $35 billion per month in November 2013, topped $46 billion this past March (when DX was 13% cheaper) and is probably headed higher.
 But, according to the World Bank, exports of goods and services comprise only 14% of US GDP. The only countries with lower percentages are Afghanistan, Haiti, Nepal and a handful of African countries most people have never heard of. So, we can’t very well expect TPTB to scuttle the very financial survival of the country for the sake of exporters.
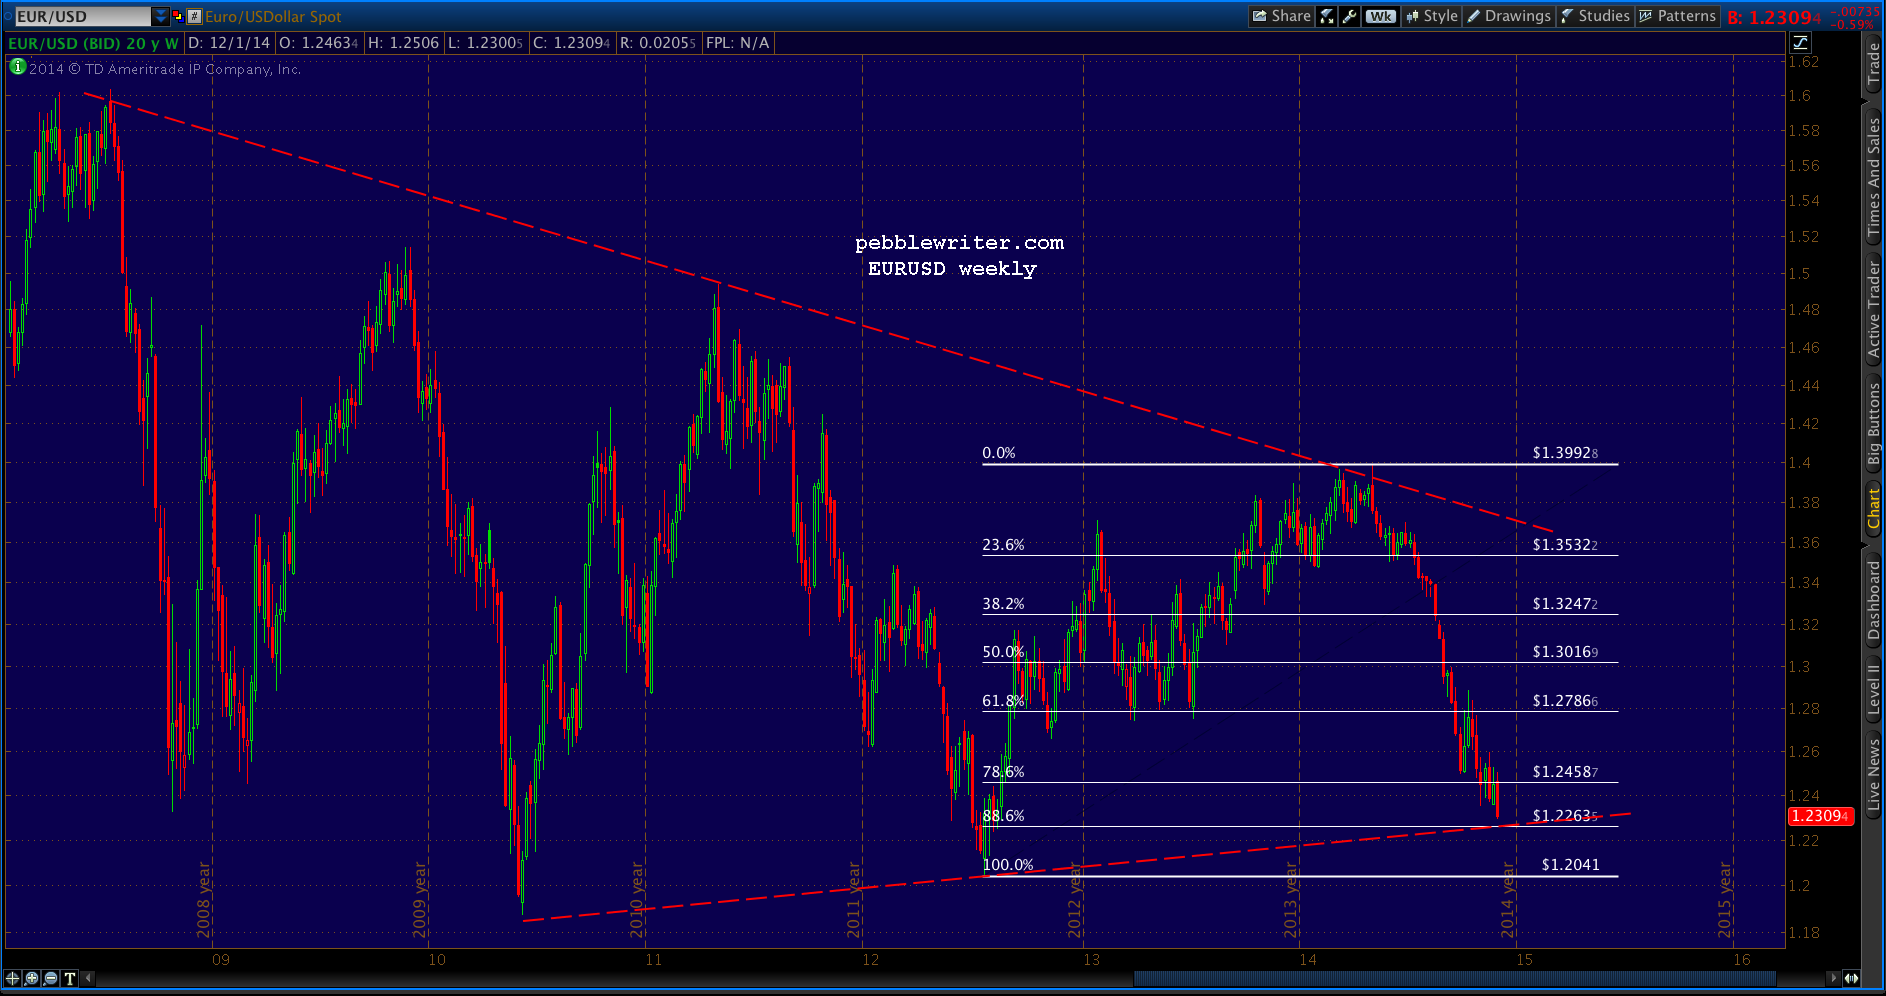
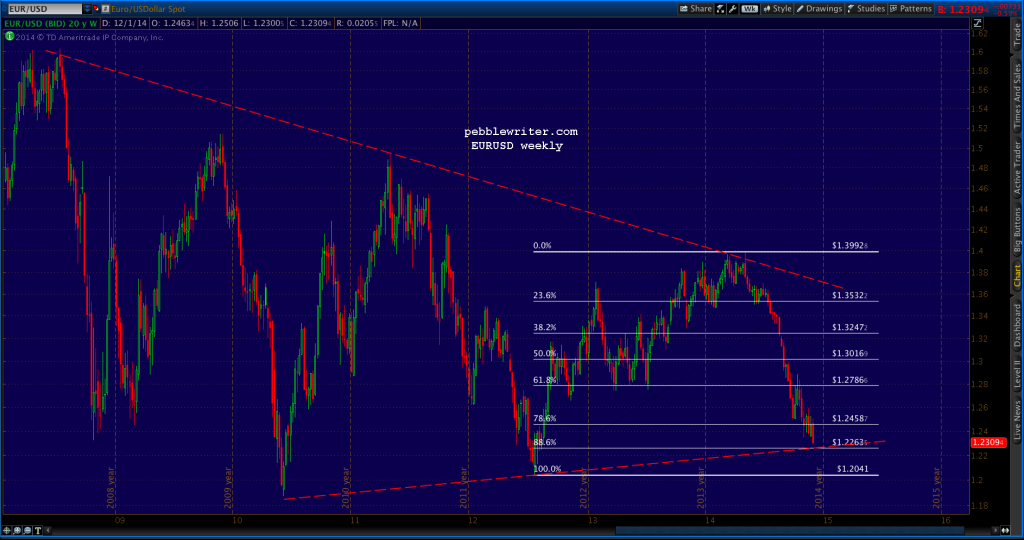
One wild card in the whole equation is the euro — the largest component of the dollar index. I fully expect that, should political pressure eventually throttle Abe’s efforts to cheapen the yen further, the ECB will be there with a new vehicle for the carry trade.
The interest rate differential between the eurozone and the US is already enough to fuel a healthy level of investment. But, the euro is approaching a natural point of reversal at 1.2263. Should it fail to reverse there, carry traders will sail into 2015 with the wind at their back. But, a sharp reversal could unwind a lot of fat and happy’s.
 The important questions: what are the most likely scenarios for the yen, the euro and the dollar, and what are the implications for equity markets?
My favorite scenario involves the DX, EURUSD, the USDJPY, VIX and the 10-year notes all hitting specific upcoming targets at the same time. Each of them would suggest a reversal for stocks; in an unrigged market, it would be a big one. But, I don’t see the big reversal occurring just yet.
First, the levels:
- USDJPY — 120.05
- EURUSD — 1.22635
- DX — 90.272
- ZN — 124.095
- VIX — near or even below 10.28
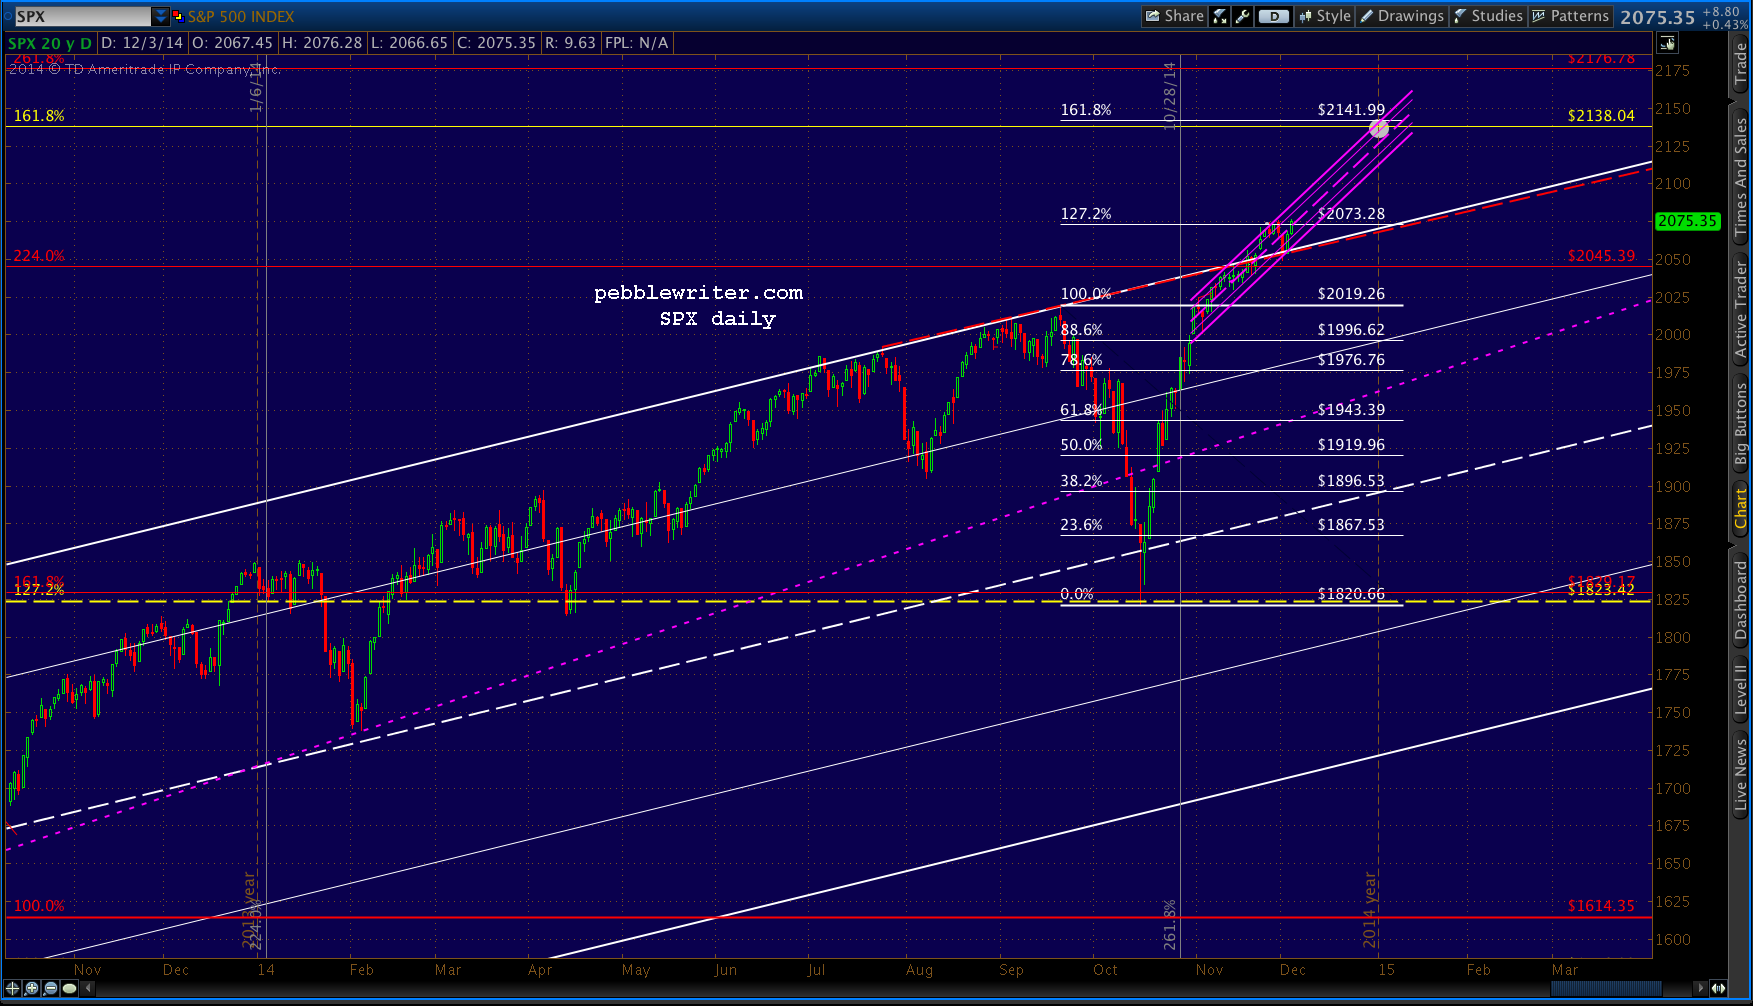
Each of these represents a level which, if reached, could propel SPX to 2138 — the 1.618 extension of the drop from 1576 to 666 between 2007 and 2009. In concert, the bullish impact of each would be multiplied — which is why I expect SPX to sail right up to and through 2138 in same fashion as it did at 1823 (the 1.272) about a year ago.
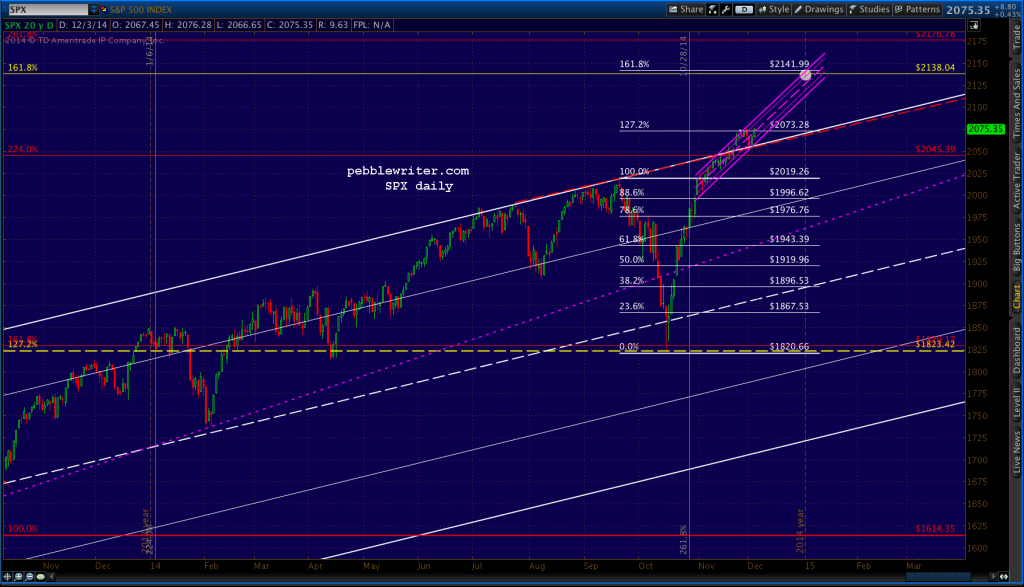
The timing, as I’ve discussed many times lately, will most likely center around the upcoming holidays. But, if 2138 is reached prior to year’s end, I’ll look for a strong push higher and a backtest after 12/31. I think it’s important to TPTB to log as high a number as possible in the year-end books. Gaining 65 points in 20 remaining sessions means a lot of chop between now and then, so we could see some wild swings.
Should any of the indices max out prior to the grande finale, look for the others to carry the load. There could easily be a succession of lifts from individual components rather than one concerted effort.
Once 2138 is topped, the game shifts into maintenance mode. And, frankly, that’s too far down the rabbit hole for me to see at the present time.
GLTA.


 And, the daily chart vs SPX…
 Remember, this is the .618 of the 50% drop (from 147 to 75) that began in 1998 (i.e. the big one) and the first of the 5 key targets outlined yesterday in our year-end forecast [see: Update on Currencies.]
 The USDJPY should reverse here. The implications for equities?