Technical analysis and chart patterns don’t always pan out. But, when they do, the results can be pretty amazing.
* * *
COMP chart from Nov 23, 2021…
 This morning…

DJIA chart from Jan 4, 2022…
 This morning…

S&P 500 futures chart from Jan 6, 2021…
 This morning…

The Nikkei futures chart from November 3, 2021…
 This morning…

The EURUSD chart from May 28, 2021…
 This morning…

The dollar index from June 7, 2021…
 This morning…
The Bitcoin chart from Dec 9, 2021…
 This morning…

There were misses, too. It was unclear back in mid-2021 whether the correction would be allowed to commence with an ugly December 2018-style downturn or the Fed would keep the party going through year-end – knowing full well that those without large stock portfolios would bear the brunt of runaway inflation.
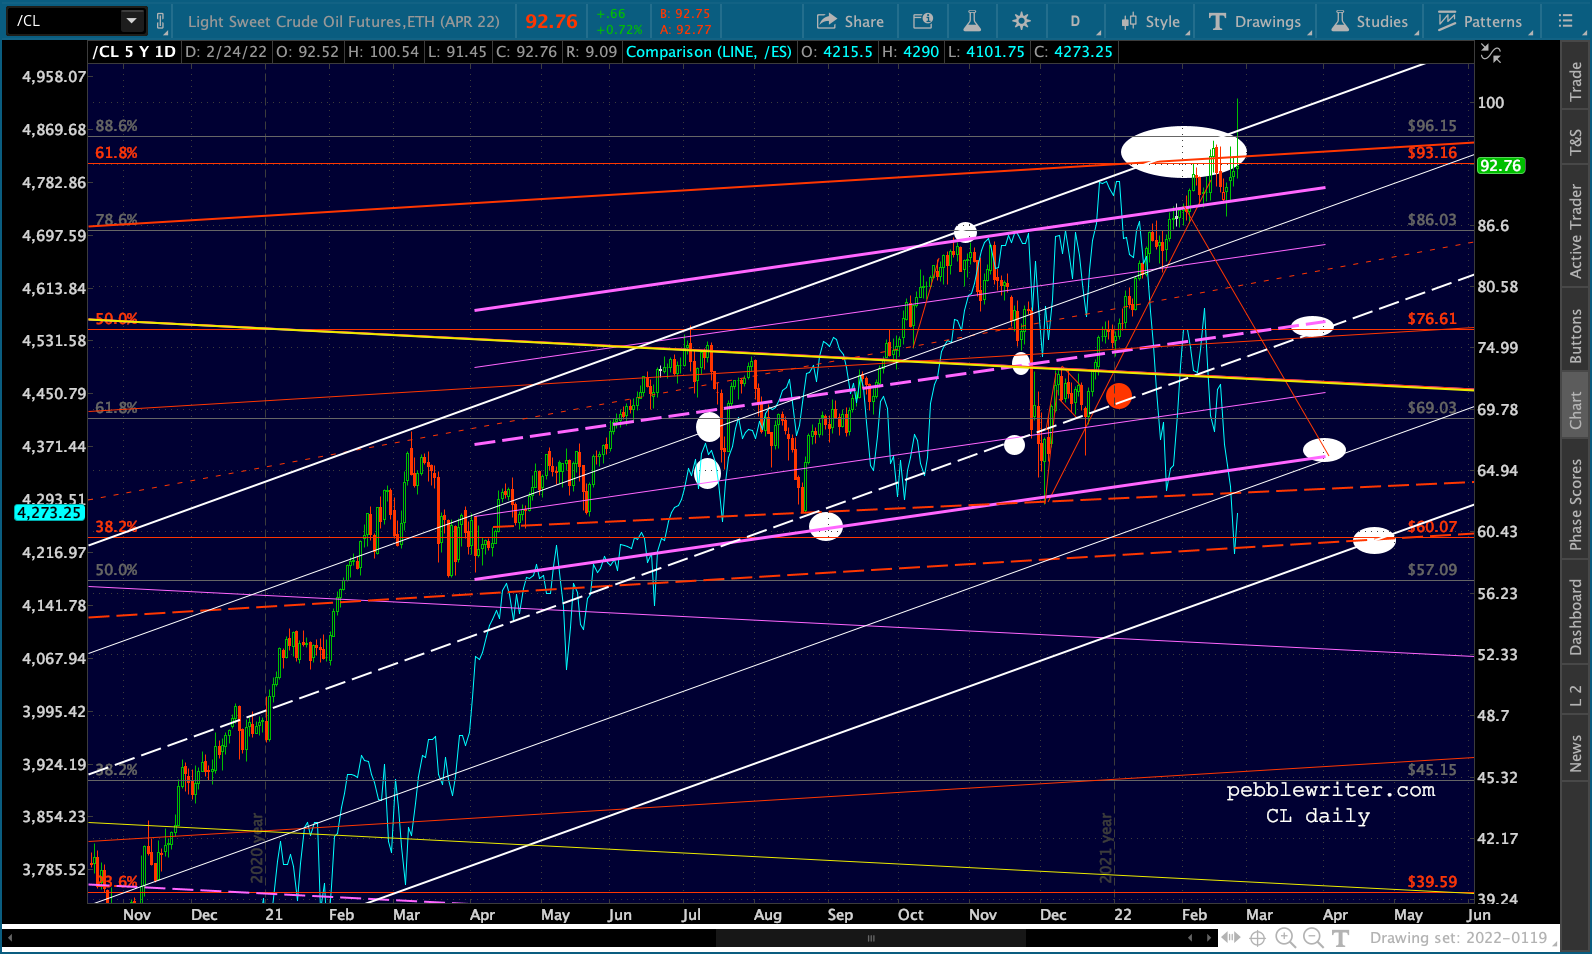
I also didn’t believe that central banks would let oil and gas prices soar to current levels. I assumed that they, like I, could anticipate how disastrous a decision that would be and what a bind it would leave them in.
Now Russia is invading Ukraine and the Fed’s policy options are extremely limited – none of them attractive let alone effective. In other words, things will get worse before they get better.
And, that’s okay. As we pointed out in early January [see: One Way or Another] there are lots of ways to force interest rates lower. But, given the magnitude of the Fed’s policy mistake, only one is likely to work at this point.
That leaves us with the interesting prospect of a market correction that’s scary enough to bring rates down off the ledge, but not so scary that real damage is done. The current taper schedule means QE will end in March. So, there’s plenty of time to to put such a plan into place before the Fed would be expected to start raising rates significantly.
Here we are.
continued for members…
The SPX charts still show lower prices ahead, but most likely in early March, reaching 4000 on Mar 2, 3956 on Mar 9 and 3855 in mid-March.
 Given that VIX is showing reluctance to make new highs…
 …and USDJPY has popped back above the red fan line…
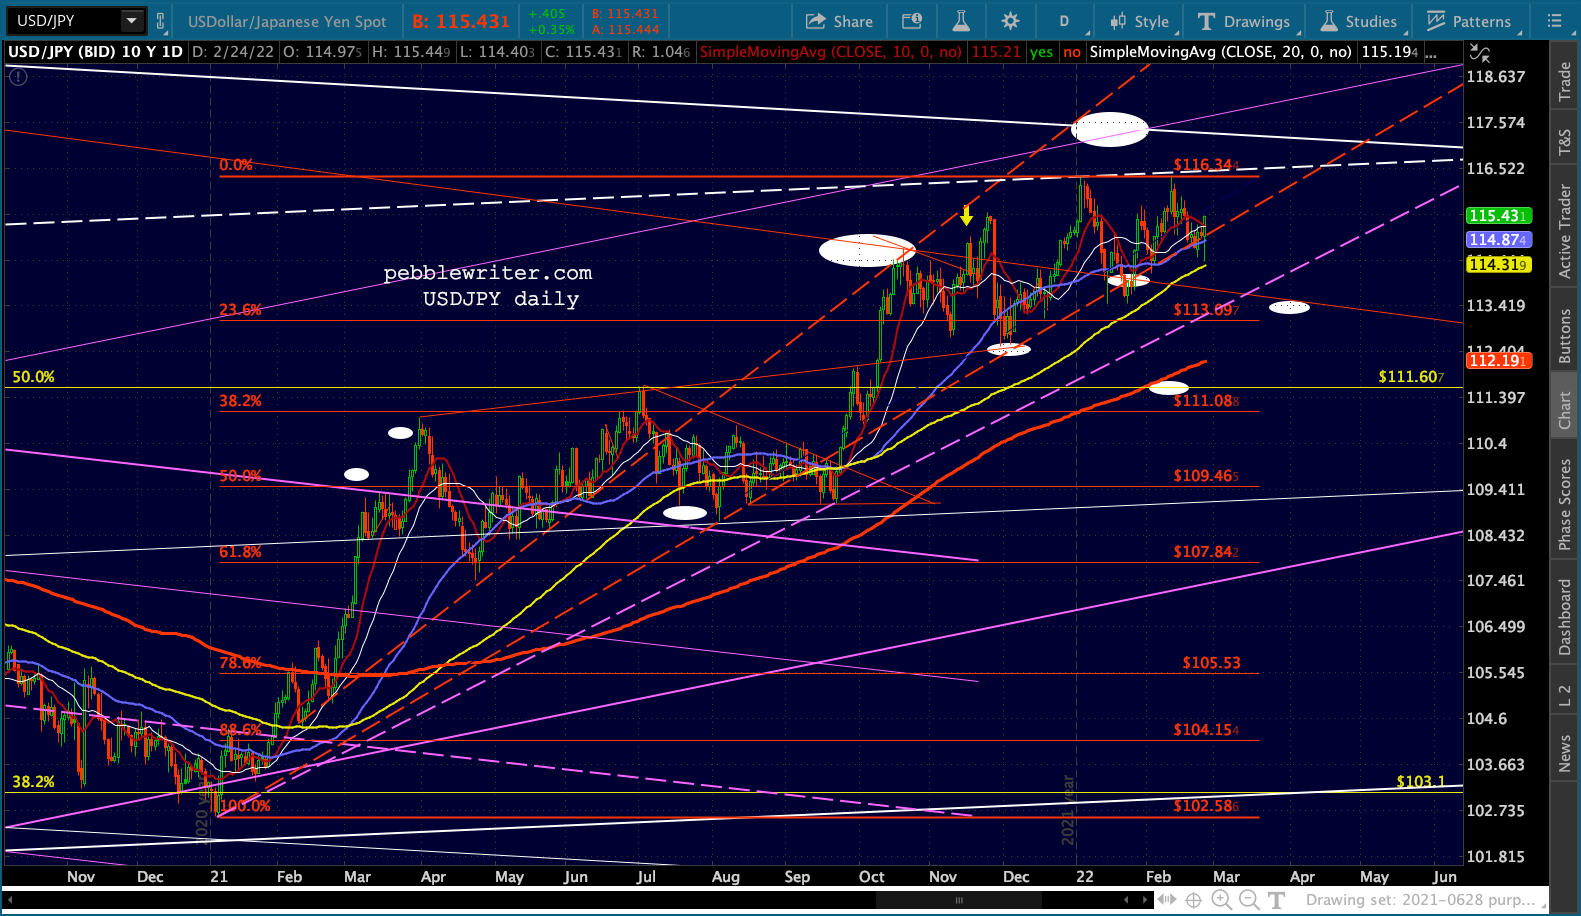 …and CL is getting a boost from the Ukraine situation…
  …it seems likely that the final plunge to those lower targets will wait until next week. But, given the uncertainty of the military action, no promises.
UPDATE: EOD