

After a precision tag of its channel bottom yesterday, SPX has an important decision to make. It’s complicated by today’s quad-witching, sometimes the scene of a massive ramp job.
 This one is different, however, as we’ve detailed in studying the price action of multiple important factors. With six weeks to go until the election, we’ll take a look forward at the most likely scenarios for stocks, bonds, currencies and oil/gas.
continued for members…The daily chart for SPX shows multiple important intersections of Fib retracements and channel lines. Once the rising white channel breaks down, the rising yellow channel should reassert itself, with the 2.618 and 2.24 yellow Fib extensions likely playing an important role.
 The ES version of the white channel shows lower lows available before its bottom is tested.

 In both ES and SPX, note that a .618 retracement of the rise from Mar 23 would put them right at the 2.24 Fib levels (ES 2728.79 and SPX 2703.62.)
Assuming the falling white channels from our correction warning on Aug 28 hold, we should see ES test its rising white channel bottom next week and its SMA200 as soon as Sep 24. Since SPX has already tested its rising white channel bottom, this would mean a channel breakdown.
The currency picture shows things taking longer to develop – more like Oct 22 or so. This is obviously getting pretty close to the election, so it wouldn’t surprise anyone to see increased volatility at that time.
Note that DXY’s falling wedge reaches our 91.358 target at the white .786 and white channel midline around Oct 22.
 EURUSD’s second downside target at 1.11-1.12 marks the intersection of the falling purple channel midline, the rising red TL, the purple .618 retracement and the SMA200 – all on Oct 22.
  The oddball is USDJPY. Its falling red channel reaches its our 102.37 target at the red .886 much sooner, around Oct 5.
 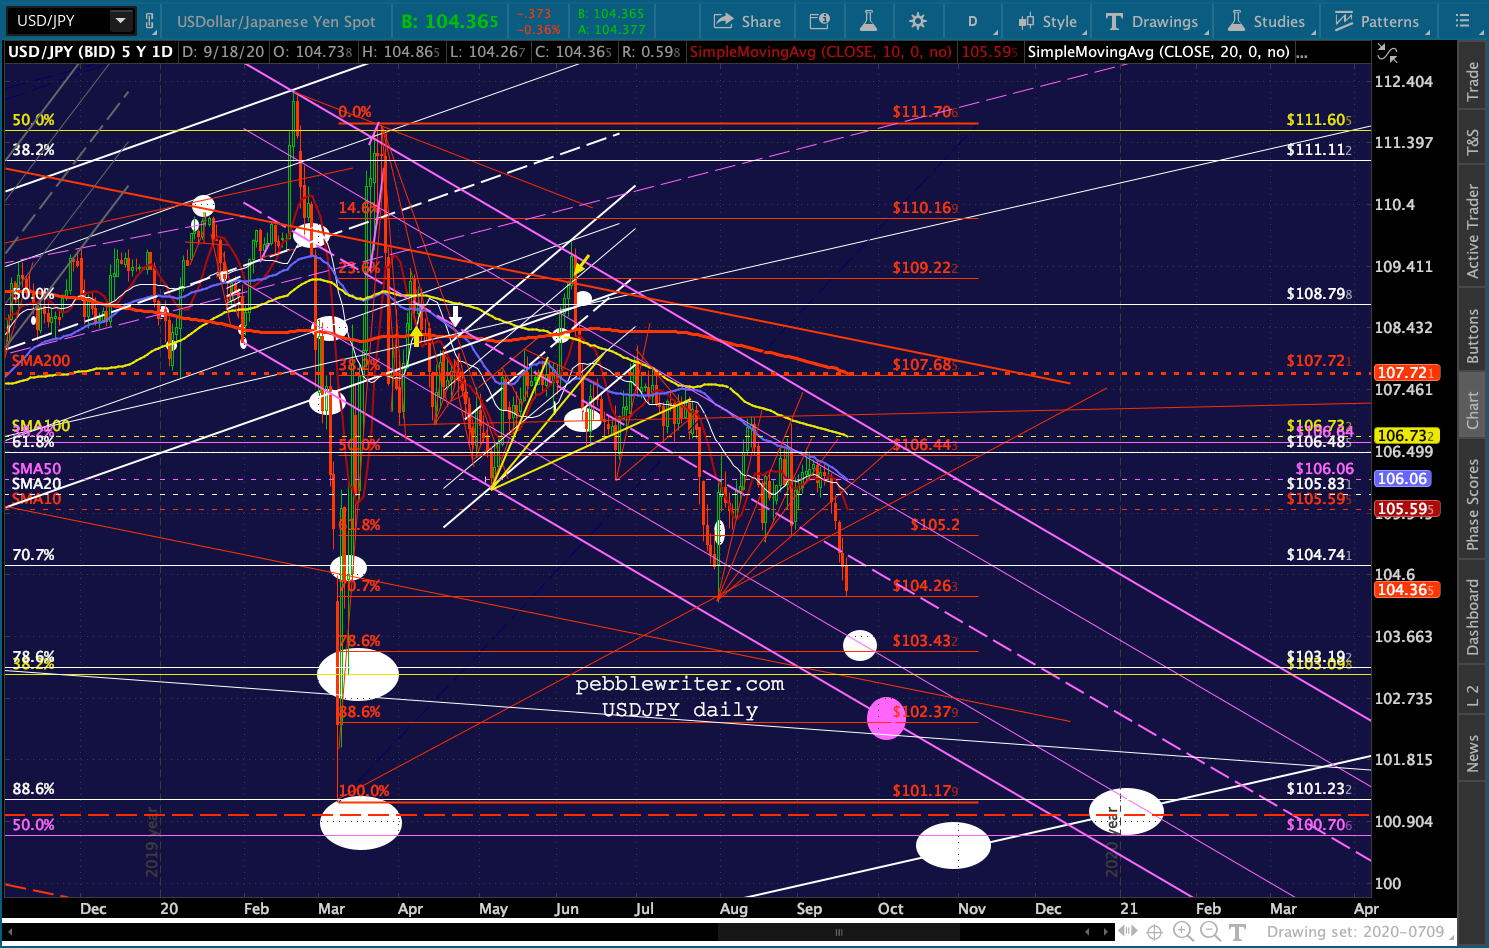 As we’ve been discussing, EURUSD’s drop should be net negative for stocks. USDJPY almost always is. DXY should see some wild swings.
GC and SI have both been coiling since mid-August – with strong support just below current prices and clear upside targets at 2162 for GC and 35.23 for SI that fall right around election day.


 If you squint just enough, it’s not too hard to imagine a quick plunge in DXY that breaks below the red TL and tests the .886 at 89.877 and sees SI and GC spike up to those targets, followed by a fear-inspired spike in DXY and retreat in GC, SI and EURUSD.
Though I wouldn’t rule out the opposite: a dip in GC and SI to test support before a rally.
Oil and gas have both spiked sharply over the past few days – more than the fundamentals would explain. I suspect they’re being employed to prevent an equity breakdown on quad-witching day and will correct starting early next week.
 A falling channel is starting to take shape in RBOB. It should be used as a means of detecting when/whether RBOB breaks out.
 I haven’t been able to find one yet in CL, but the weekly chart still speaks volumes about the downside potential.
 As does TNX’s weekly chart indicating the 10Y could drop to 1.54 bps or even negative.
 There are countless scenarios that could play out between now and election day: Nov 3. If Trump continues to trip over his own tongue and additional former insiders continue to come out of the woodwork with salacious stories to tell, the gap will continue to grow.
Should this happen, it’s quite possible he’ll resign at the GOP’s urging with “health problems” and let Pence carry the ball into the election. This would need to happen rather soon – within the next 2-3 weeks.
If Trump stays in and loses the election, I think it’s fairly likely he’d resign prior to Biden taking office and let Pence pardon him.
If Trump wins the election, presumably markets would continue to rally except to the extent a crumbling economy and growing pandemic might matter – if at all.
And, if Biden wins the election, it’s fairly likely we’ll see some tax-driven selling – those seeking to avoid higher tax rates.
Then, of course, there’s the possibility of a contested election – where all hell breaks loose. God knows that could be an unmitigated disaster.
Whatever the outcome, there is excellent potential for significant risk off disruptions in both equity and fixed income markets. As always, we’ll take it one day at a time and see what the charts say.
UPDATE: 3:33 PM
VIX just reversed back to go, putting the kabosh on additional drops for SPX/ES – probably through the close. The falling channels are shaping up nicely though. I’m signing off for the day…wishing everyone a great weekend!


