

Many bears have simply given up betting on a downside that, despite plentiful recession indicators, feels increasingly unlikely. Since the S&P 500 completed its Inverted Head & Shoulders pattern back in December, the index has piled on nearly 14% [see: A Look Ahead at 2024.]  The many, many bulls point to a generally strong economy, healthy employment picture, and the transformative potential of AI to justify the market’s historically high valuations. The bears see things differently.
For an excellent summation of the bears’ case, take the time to read John Hussman’s Universal Capitulation and No Margin of Safety. He makes some very compelling points regarding valuations…
We’ve observed greater extremes only twice in U.S. financial history: the week ended December 31, 2021, and the week ended August 26, 1929.
Other market gurus have also rung alarm bells, from Bill Gross’ warning of “excessive exuberance” to Chris Senyek’s concerns about the “potential formation of another late-90’s-style TMT [technology, media and telecom market] bubble” to Jeff Gundlach’s admonition that “this feels a lot like 1999…there’s a lot of risk in markets that have run this far.” Even perennially bullish Warren Buffett is sitting on $168 billion in cash, and recently wrote that “markets now exhibit far more casino-like behavior than they did when I was young.”
We’ll take a look at some of the most compelling economic data and charts that should provide guidance on the remainder of 2024 and beyond.
continued for members…
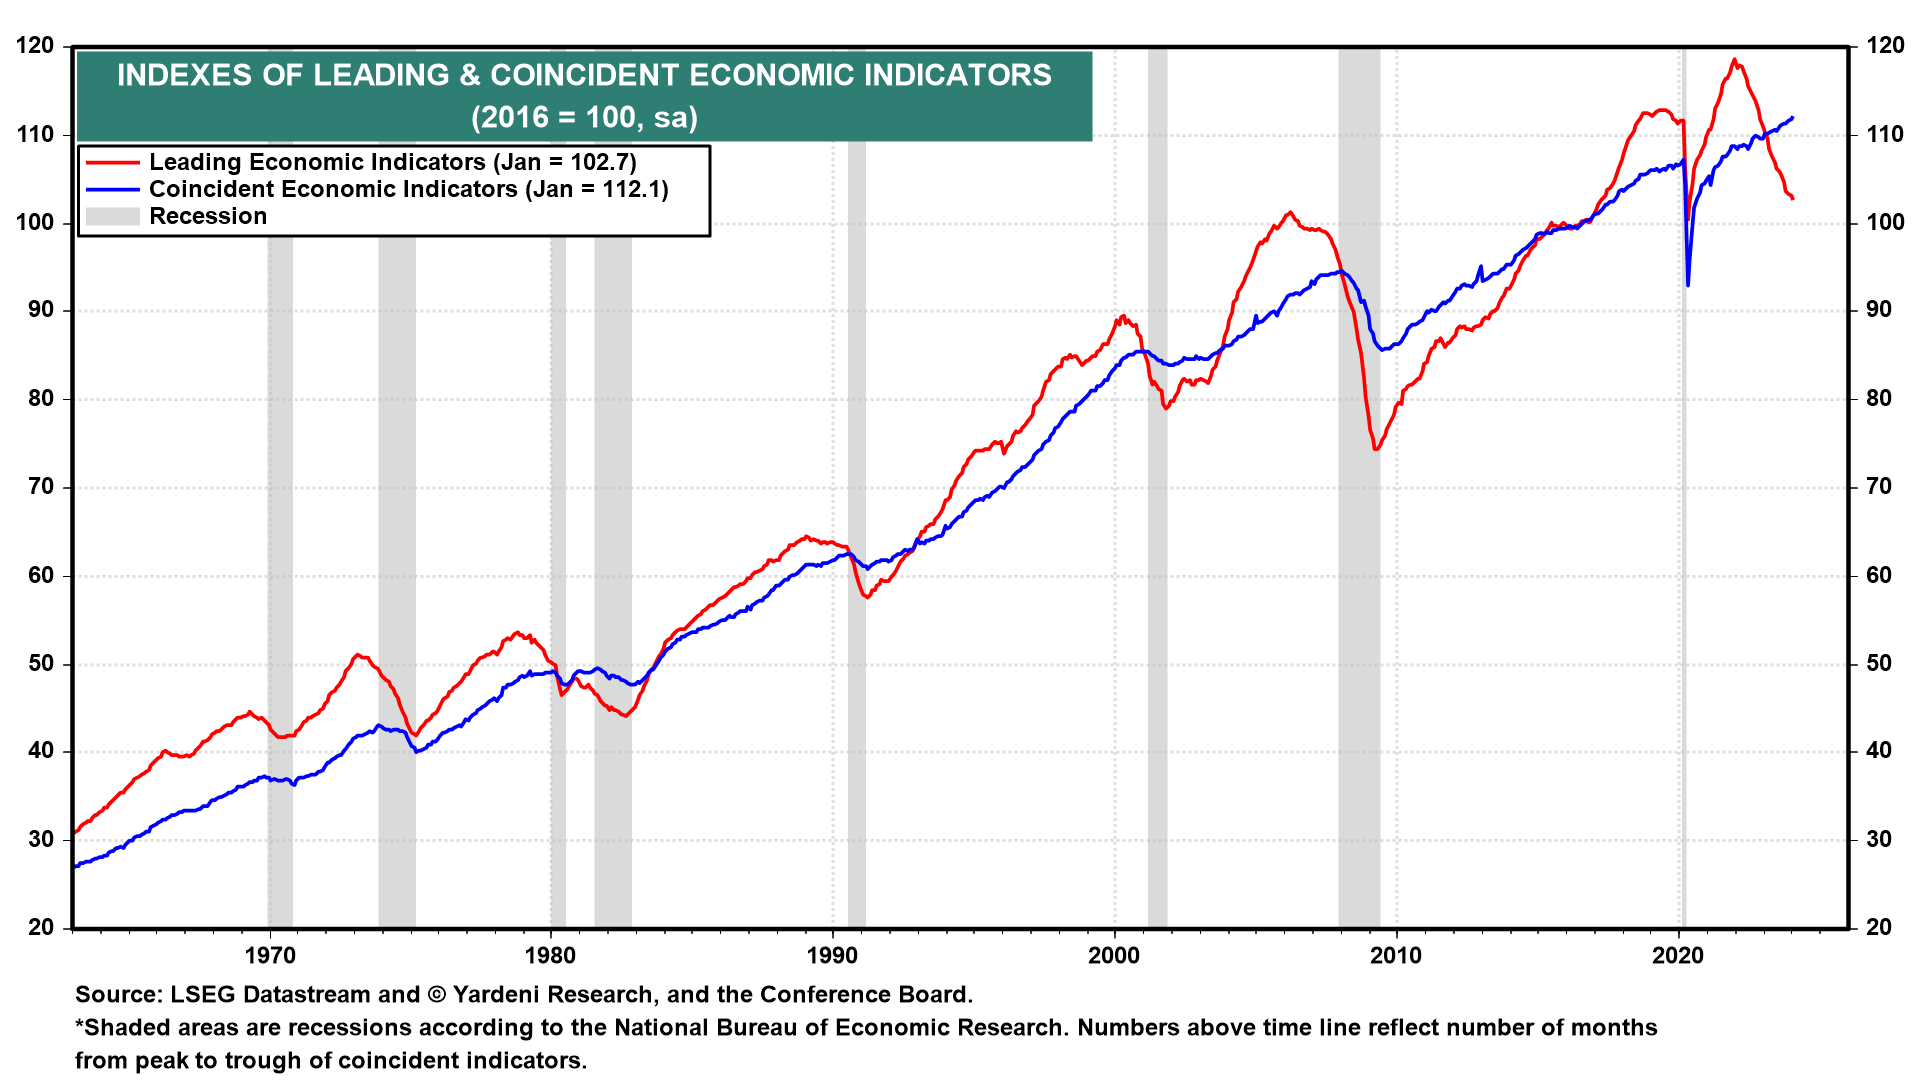
We’ll start with a few economics charts – though there has seldom been as compelling argument that the economy and the stock market are not the same thing.
Although the Conference Board’s Leading Economic Index has turned slightly positive…

…it’s hard not to be at least a little nervous about the long-term picture.
Inflation remains a significant worry, despite the decline from last year’s highs. The past few months, it has stalled at levels not seen since 2012. It hasn’t yet reached 3%, let alone the Fed’s vaunted 2% target.
 With oil/gas prices on the rise, inflation remains a concern. Should they reverse recent gains, on the other hand, CPI would continue to drop. The chart below shows that if gas prices remain at current levels, the YoY change would continue to drop until at least the 2024 election.
 The February CPI print showed a 3.8% MoM increase in gasoline prices – by far the largest increase in any component.
 But, it was the -4.2% YoY decrease in energy prices which was most responsible for bringing CPI down to 3.2%. This bears continued close scrutiny.
The other big YoY increases are in services: 5.7% in shelter and 9.9% in transportation – with shelter accounting for two thirds of the total YoY increase in all items less food and energy.
We can’t go very far into a discussion of inflation without detouring into the bond market. Last week we looked at some of the longer term trends in the 10Y, with a particular focus on the obvious cycle marking the periodic lows.
 Yields tend to make significant lows for two primary reasons: slowing economic growth (or outright recession) and significant equity corrections (or crashes.)
We can see that the stock market tended to make important bottoms most of the time that 10Y yields were also bottoming. Sometimes they were the tail end of a crash (2003, 2009 and 2020) and sometimes this occurred after a correction (1998, 2012 and 2016.)
If we assume that we’ll have another important bottom in Mar-May 2025 (unless it comes early – a common occurrence for bigger drops), it raises the question of whether it will correspond to a correction or a crash.
Another favorite tool for sussing out a forecast is the 2s10s – the yield on a 10Y treasury minus the yield on a 2Y treasury. Most readers are aware that the 2s10s is currently inverted (negative) and are also aware that inversions are always followed by recessions.
 Significant moves in the 2s10s are also highly correlated with stock market crashes and corrections. Corrections tend to occur when the 2s10s breaks down below obvious support and when it goes negative. Crashes occur when the 2s10s breaks out above significant resistance following an inversion.
 The 2s10s has now been inverted for the longest period ever. So, it makes sense to examine what this might mean with respect to a correction or a crash.
The last time the 2s10s made a new high was in October 2023 (point a below.) As a result, SPX dipped below the TL connecting recent lows to the Mar 2020 pandemic low. This so alarmed investors that the 2s10s immediately retreated and fell to below the trend line connecting its recent lows (point b.)
 This meant that the 2s10s became more inverted, i.e. the 10Y dropped further than the 2Y. The 2s10s made another effort in Jan 2024 to make higher highs (point c), but after the stock market stalled the 2s10s plunged back below the TL to point d before turning up again these past two weeks.
Bottom line, CPI has been able to raise or lower the 10Y based primarily on moves in oil/gas.
CPI, which had averaged 8% in 2022 and spent the first 8 months of 2023 bouncing around between 3% and 6.4%, dropped back to 3.24% in October and 3.14% in November as oil and gas were plumbing new lows.
 It has the potential to drop below 3% – except that gas prices have risen steeply since December. This has been able to and could continue to prevent the 2s10s from returning to positive territory and all that that would mean.
Again, breakouts usually result in crashes. I think the Fed is well aware of this, and will probably keep rates inverted for some time if – as I expect – they intend to prevent a significant correction or crash. Not to oversimplify things, but if they continue to work toward this goal, it probably means they would like to see Biden reelected. Allowing a crash, on the other hand, probably implies that they would favor a second Trump presidency.
Given all the drama between Trump and the Fed, I believe they’d like to see Biden continue (though there are certainly economic arguments on the other side, too.) If so, we would continue to see the 2s10s bump along above the trend line connecting b and d, which doesn’t turn positive until early 2025.
 Going with this forecast, this would mean that the 2Y remains elevated and the 10Y somewhat suppressed. This would mean a continuation of the current Fed policy and supportive statements that rates will remain elevated until they see clear evidence that inflation is no longer a problem.
This condition would continue to exist even if inflation does continue to drop and rate cut expectations remain high. In other words, the disconnect between economic data and Fed policy could grow more stark. But, ironically, it could insulate the Fed from criticism that it is acting to benefit Biden.
Again, all this would be undone by inflation that increases to any significant amount – which remains a very real threat as long as oil/gas prices are rising. And, to reiterate, I see this as a distinct possibility given the preference that OPEC (especially the Saudis) and Russia would have for another Trump presidency. The whole drama should be very interesting to watch.
Members might recall that rapid rises in the 2s10s are typically the result of a sharp drop in the 2Y instead of a rise in the 10Y. These sharp drops are typically due to bearish economic news or “black swan” events that send investor dollars flooding (from equities) into short term fixed income.
At present, I don’t see any of these potential threats on the horizon (of course, “black swan” refers to events which cannot be anticipated.) I think that Wall Street and the majority of the power structure in the US is happy with the way things have gone in the stock and bond markets and would like to see it continue for another four years. Therefore – no changes that might upset the gravy train.
Many of the loudest voices advocating for a change have no real power other than their social media followers. And, to be sure, this can make for a tight election. But, I think the majority of the “power/elite” – used here in a non-pejorative sense – have no interest in the capriciousness, self-absorption and global isolation that characterized the first Trump presidency.
Yes, some beneficial economic changes occurred. And, depending on one’s personal views on matters such as abortion, Trump delivered some important wins. But, overall, it was a turbulent four years with a very large increase in debt, a withdrawal from a leadership role on the world stage, and a potentially disastrous turn away from basic science (nothing potential about it if you were one of the 1+ million who died from Covid while Trump was downplaying it.)
Send any angry rebuttals to me HERE!
With all that as a backdrop, I think the higher Fibonacci level and IH&S target are very reachable in the the next 7 months. For SPX, this means 5337.81 in the very near future, followed by 5638.73 and 5727 (the IH&S target.)
 I don’t believe the current acceleration channel in place since last October will hold. I expect that we’ll eventually get a backtest – either of the white 1.272 at 5179 after the purple 2.618 at 5337 is reached, or the purple 261.8 after it’s topped.
One way or another, the achievement of 5638-5727 will likely be postponed until at least November. And, the way the market usually works, it would be unusual to have a selloff at that point, so close to year-end.
Note that SPX’s SMA200 has finally reached the purple IH&S neckline at 4622 (ES: 4759.) So, technically, this would be an ideal place to backtest if the market weren’t being propped up so expertly. This would be a 10% decline from current prices – kinda scary, might upset folks.
The more likely opportunity for an SMA200 backtest would be after it had reached an important Fibonacci level such as the former 4818 high (ES: 5080 high) just below current SMA50 levels (5056, ES 5131.) This would be a 4.3% drop – not as scary. It’s been so long since we had even a 2% drop (currently 106 points) that if feels silly to be talking about any backtests. But, it will come – probably without warning.
The trick will be to anticipate it. It will likely coincide with a much higher than expected CPI/PCE print, a Fed failure to cut rates, or a geopolitical event of some sort. The CPI/PCE prints over the next few months are:
CPI:

PCE:
 FOMC Meetings/Press Conferences:
 How to tell when one has started? Since October 2023, the worst drop we’ve seen was in January when SPX fell 111 points (2.3%) over 5 sessions between 12/28 and 1/5. In hindsight, it wasn’t worth avoiding. But, it occurred right after a strong quarter/year end (always a good time for a pullback) and was notable for the fact that SPX dropped through both its SMA10 and SMA20.
  SPX shot above its SMA20 on Nov 1 and hadn’t even touched it again until Jan 4. Someone who sold at that point would have needed to jump back in when it popped back above on Jan 8. They might have lost a 0.50% percent or so, but they would have protected their downside. Note that the SMA10 also turned down (a negative slope) on Jan 3.
This hadn’t happened since it turned positive on Nov 2, so it was a good warning sign. Again, it wasn’t necessary in hindsight. But, for a nervous or leveraged trader who is trying to avoid even brief/minor downturns, these are reasonable sell signals. (SPX hasn’t closed below its SMA20 again since a one-day drop below on Jan 17.)
The SMA20 is currently coming up on the white 1.272 at 5179.57 (which has yet to be backtested) so a backtest of that level (-1.6% from Thursday’s highs) wouldn’t be at all surprising – though it would put a dent in the current channel placement.
The consolidation of SPX’s RSI which I’ve noted in past weeks is being expanded.  Things were apparently coming to a head, with the apex on April 5 (this Friday) but after a breakdown on Mar 15 RSI was quickly fixed and broke out on Mar 21 and Mar 27. Bottom line, I’m not currently relying on it for much of anything, but will continue to monitor it.
There are oodles of support mechanisms at the market’s beck and call, including VIX and currency manipulation. We’ll delve into these over the remainder of the week.