

There’s a growing debate amidst the punditry as to whether inflation is transitory and, if so, whether it matters. In an interesting WSJ article yesterday, James Mackintosh notes that “markets are leaving little room for the Fed to be wrong on inflation.”
With stock and bond prices so high relative to historical values, this is undoubtedly true. Mackintosh references Michael Pond, head of global inflation-linked research at Barclays, who recently noted that the Fed was right the last time it bet on inflation being transitory, in 2011. But, it’s important to recognize “why” the Fed was right at that time.
The problem with soaring inflation, of course, is that it can lead to soaring interest rates. Between Jan 2010 and Feb 2011, the 10Y had been averaging a 1.5% spread over CPI. After the Fukushima disaster in March, inflation began to outpace the 10Y — not because inflation rose but because the 10Y plunged due to the disaster and the sharp equity correction which began in July 2011 when US credit was downgraded.
In other words, the equity correction gave interest rates a nudge in the right direction, leading CPI by 7 months at which point the influence of falling oil/gas prices finally began to be felt. Fukushima and the equity correction produced a sharp decline in interest rates to which inflation eventually “caught down.”
 By September, the relationship had flipped and CPI exceeded the 10Y by almost 2% — culminating in a central bank-induced crash in oil/gas prices in 2014-2016. Stocks were protected by the yen carry trade, which central bankers revved up in order to stimulate algorithms to go all-in on stock purchases.
By early 2015, the 10Y was back to a 2% spread over CPI as the oil/gas crash played out. The chart below shows both printed on the same scale.
 But, of course, it also illustrates the shocking 3.3% spread between the 10Y and CPI. In Spring 2020, it appeared that the situation would ultimately be rectified by another 2014 or 2018-style crack in oil/gas prices – the point being to keep interest rates from running away from inflation. But, as in 2011-2012, exogenous events did the Fed’s bidding.
The COVID crash crushed interest rates to where the Fed, facing a nearly $30 trillion deficit, would eventually need them. The pandemic also gave the Fed all the ammunition it needed to justify QE so massive that the bond market’s price discovery mechanism was seriously damaged if not destroyed.
continued for members…
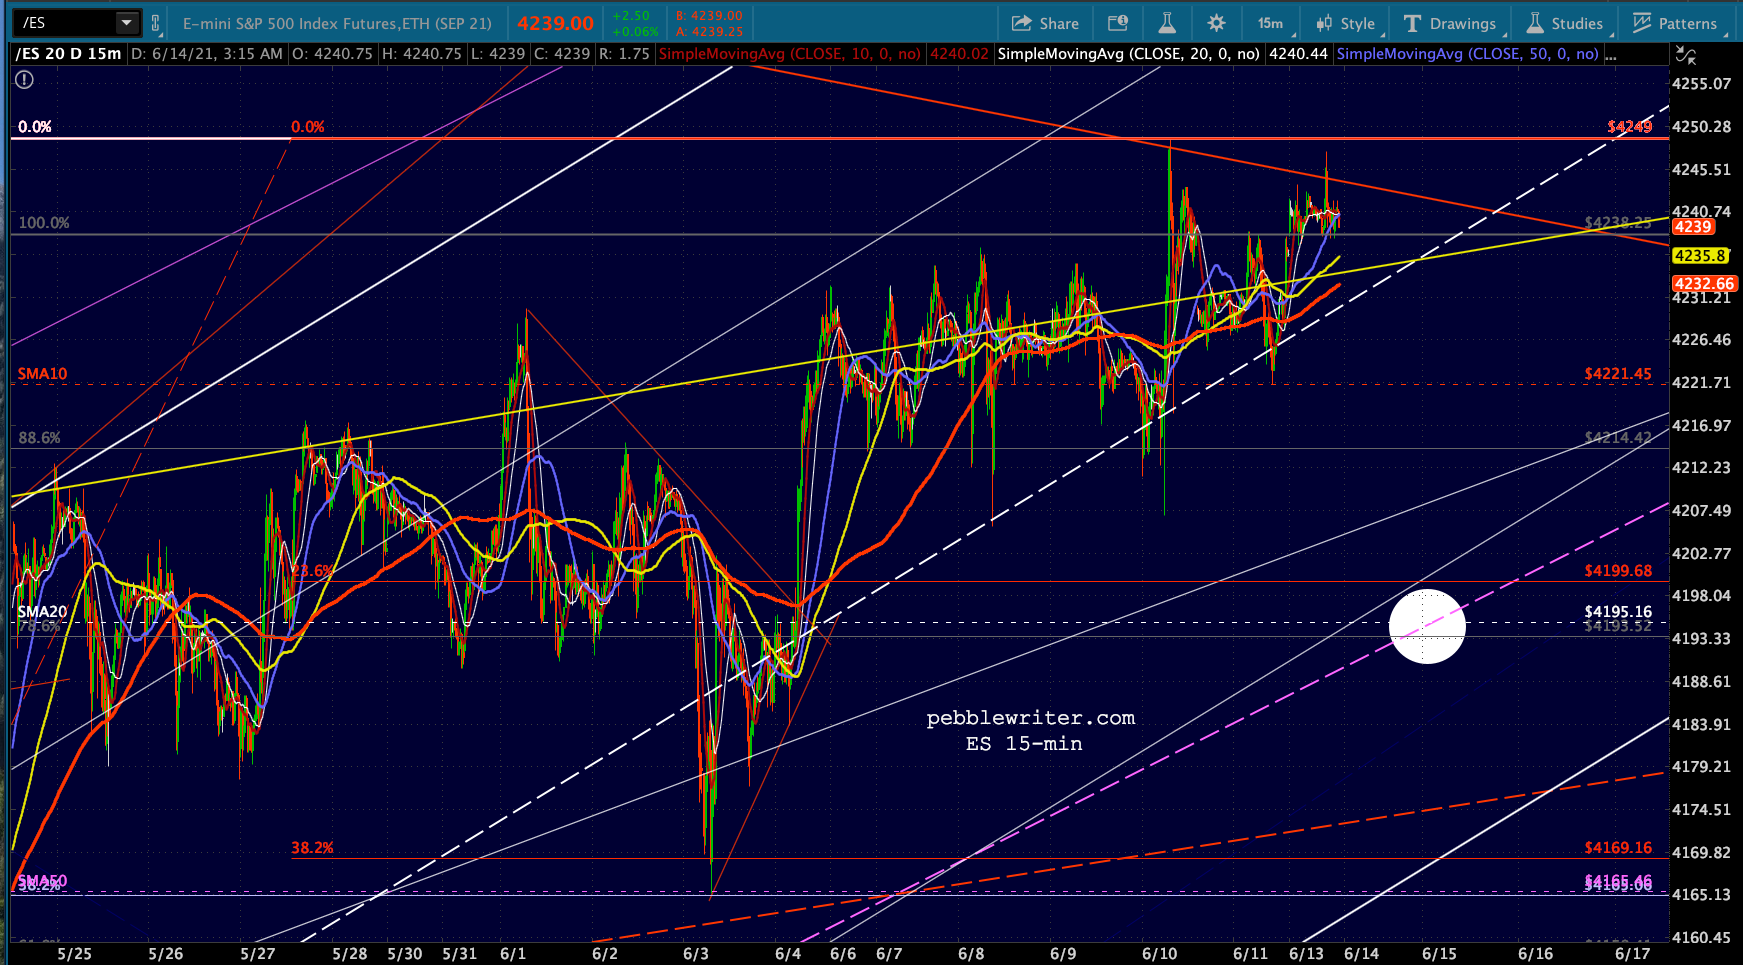
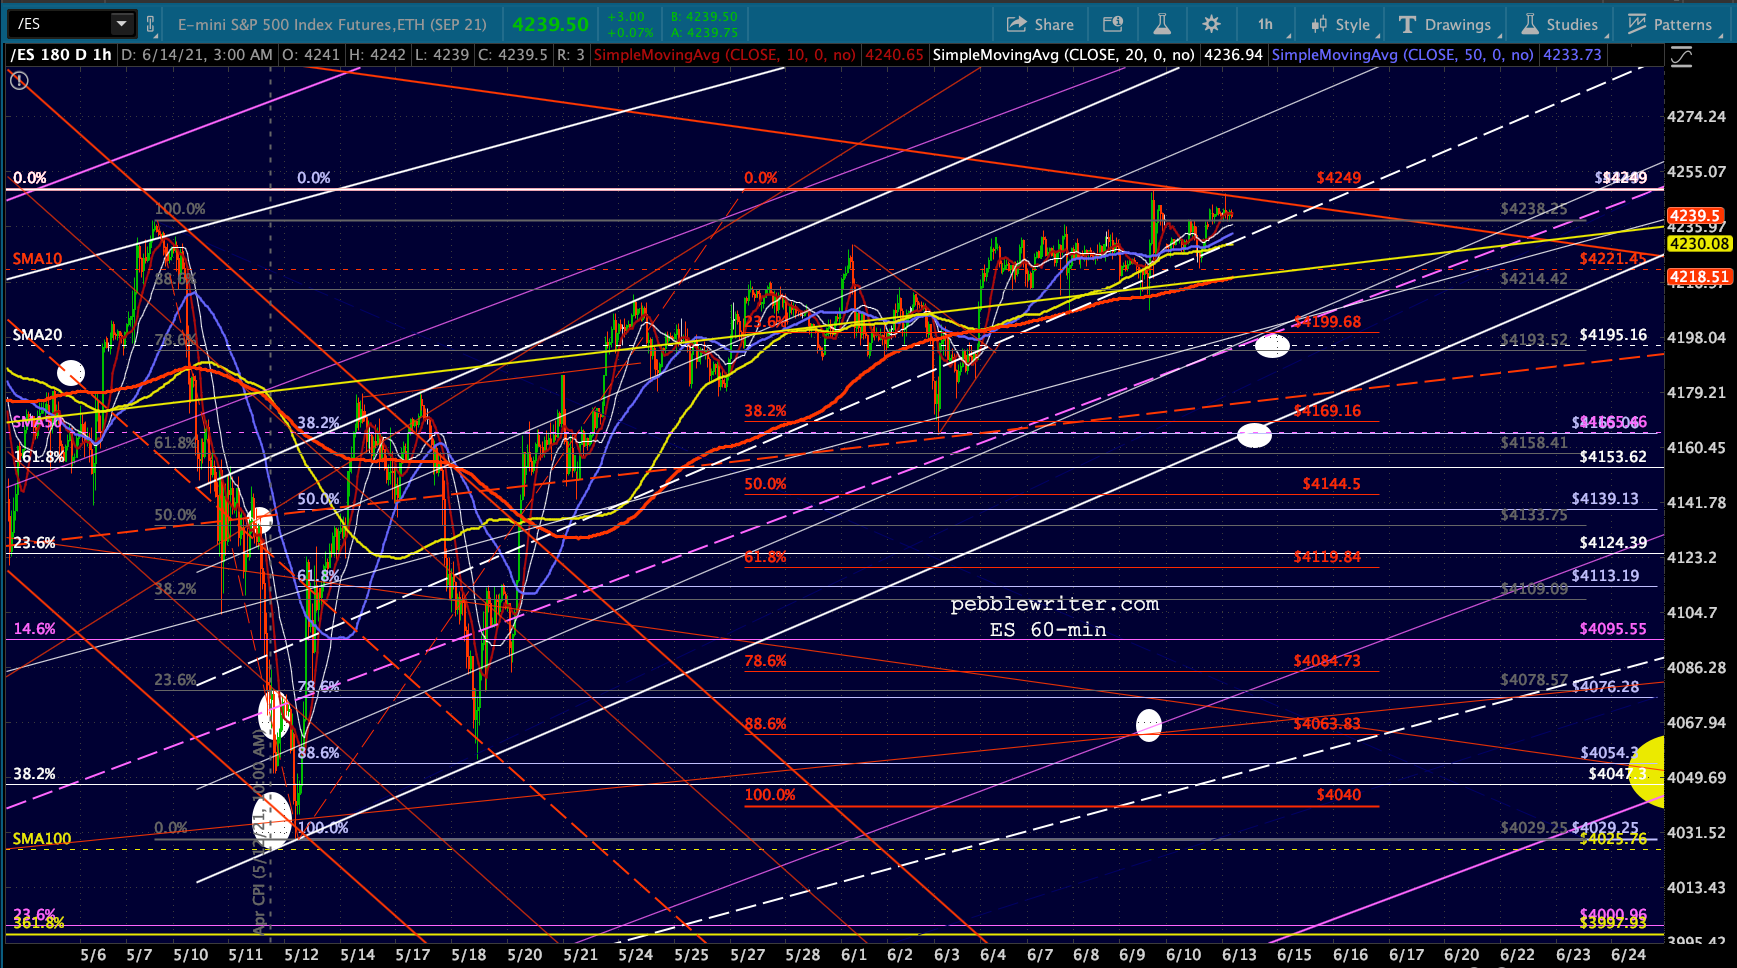
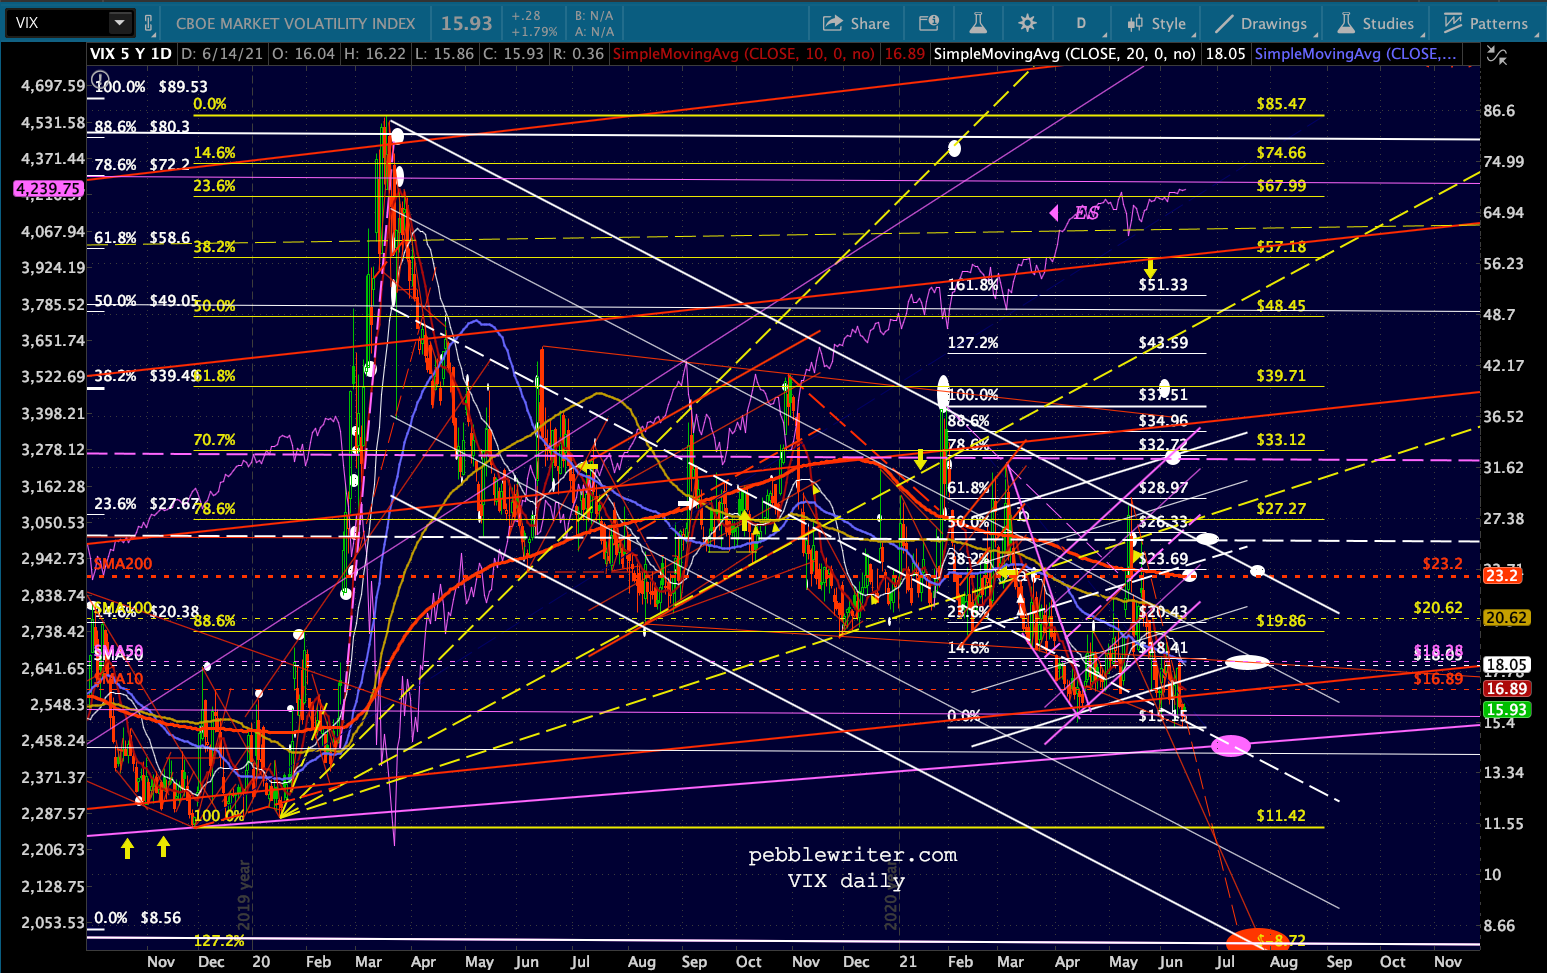
I have to run a quick errand, will be back around noon to post the rest. In the meantime, here’s today’s equity picture:


 continuing…
It’s hard to conceive of a falling market that didn’t somehow involve some tightening or at least the expectation of tightening by the Fed. With a rate decision and presser coming up on Wednesday, Powell will have another chance to change his tune. But, will he?
The Fed isn’t yet paying a price for its easy money policy. Rates are exceptionally low, stocks are at all-time highs. The bond market is seemingly as broken as the stock market. About the only hitch with the current setup is that more and more investors will begin to openly question the Fed’s ability to properly assess and forecast economic conditions.
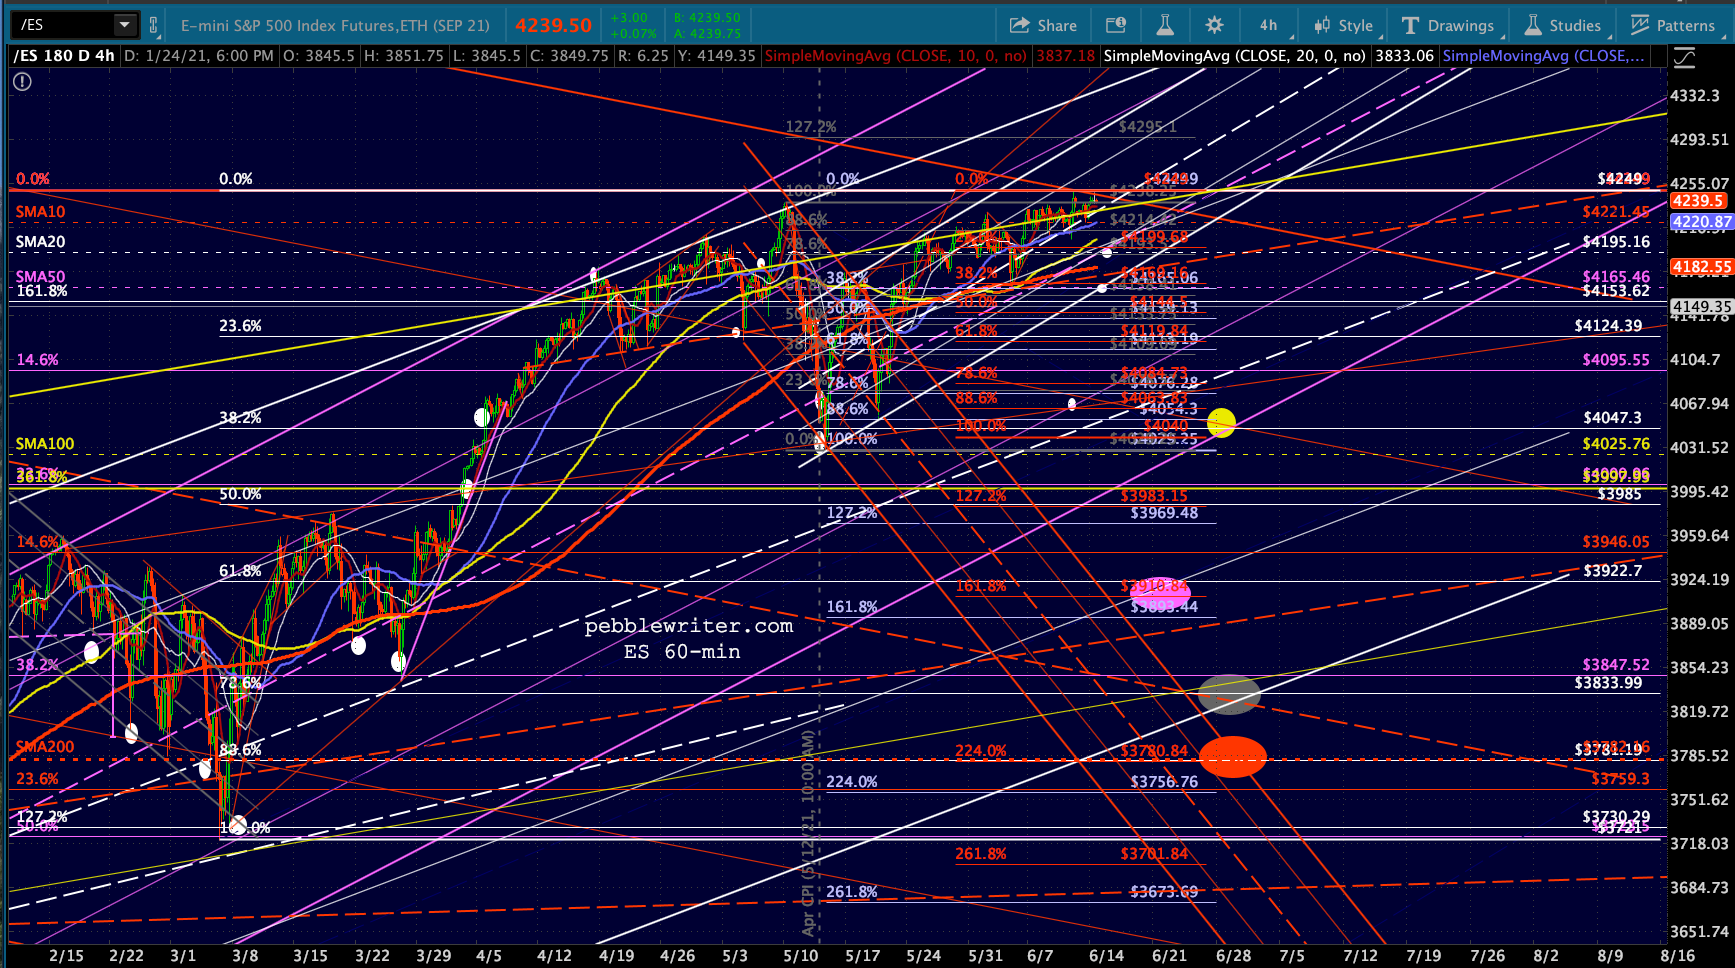
I therefore continue to expect at least a mild pullback/backtest will allow CL/RB to decline somewhat – thereby taking some of the inflationary pressure off. The most obvious target continues to be SPX’s SMA200, currently at 3785 – right where the white .886 sits. Since ES is about 10 points lower, it would translate into 3775ish – slightly below its SMA200 and the white .886 at 3781.
CL and RB could see a backtest to their SMA100s – currently 62.17 and 1.97 – with a drop to RB’s SMA200 (1.58) a reasonable expectation.
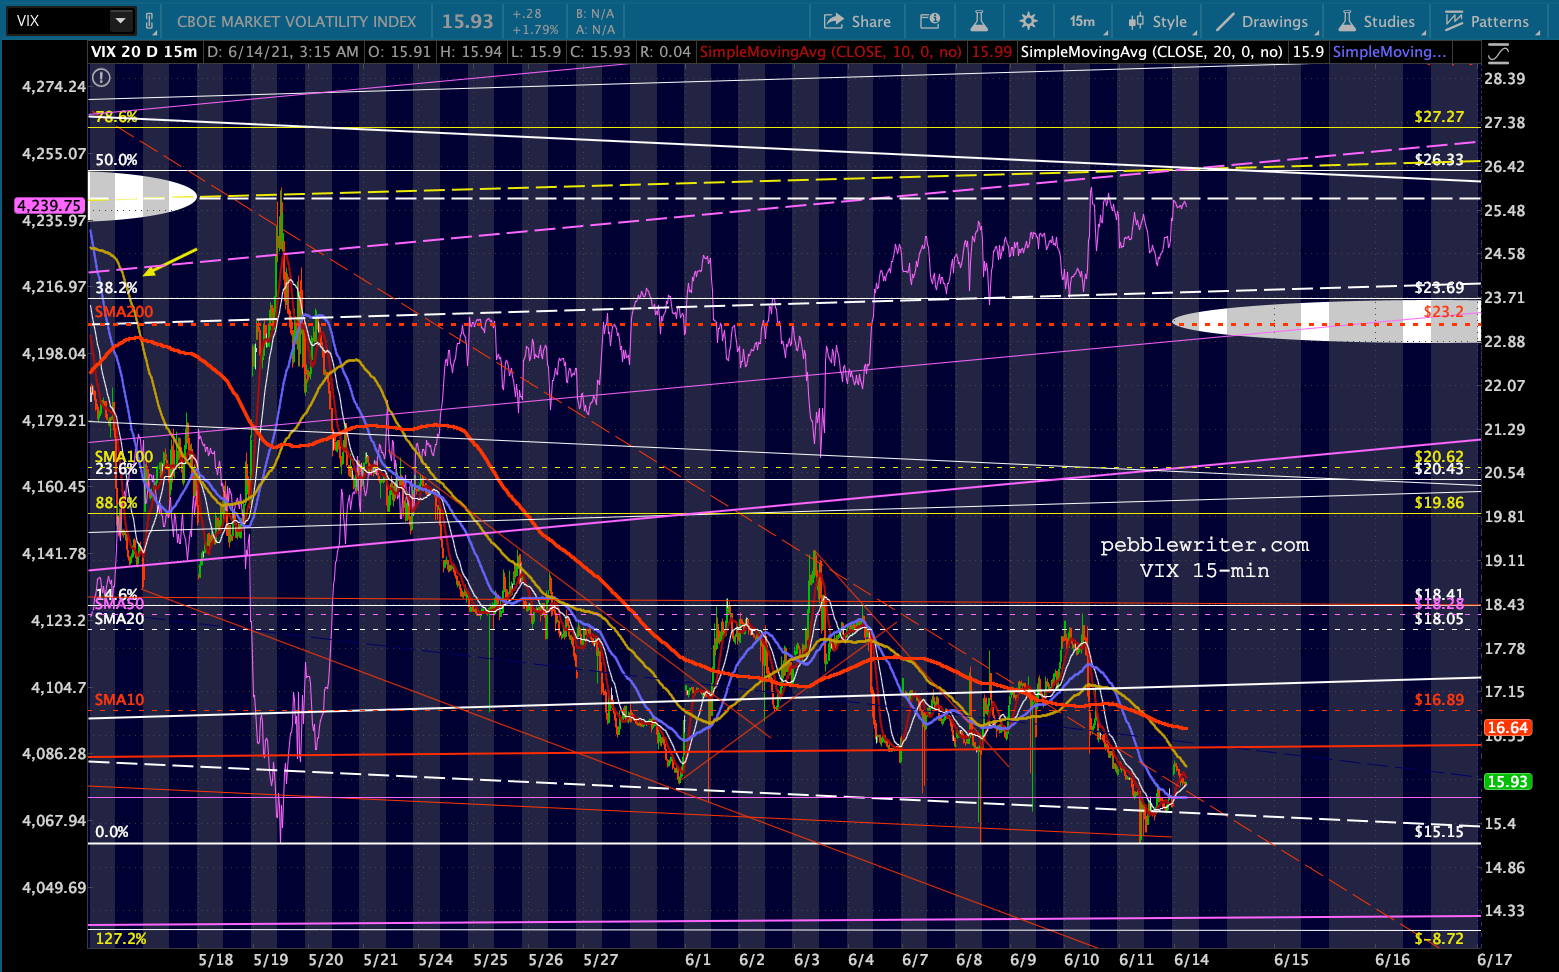
 Stocks wouldn’t necessarily be too damaged by such a drop if VIX can continue falling (not a problem so far) and USDJPY can continue “breaking out.” Additional USDJPY strength would be consistent with CL weakness.
 As stocks near the desired support, I’d pay very close attention to both USDJPY and VIX. Stocks have been very easily manipulated by both.
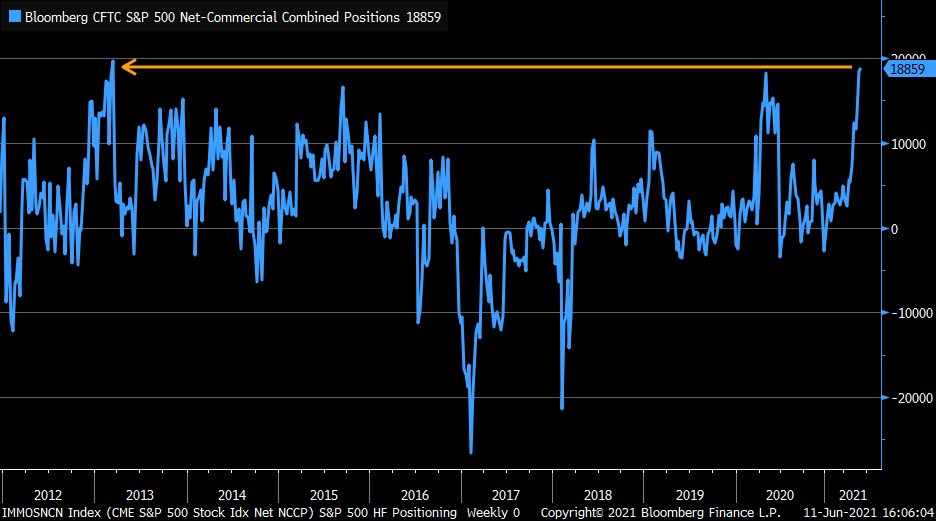
But, consider how lopsided the wagers are…higher than just prior to the Feb 2020 top and the May 2015 top.
 UPDATE: 2:30 PM
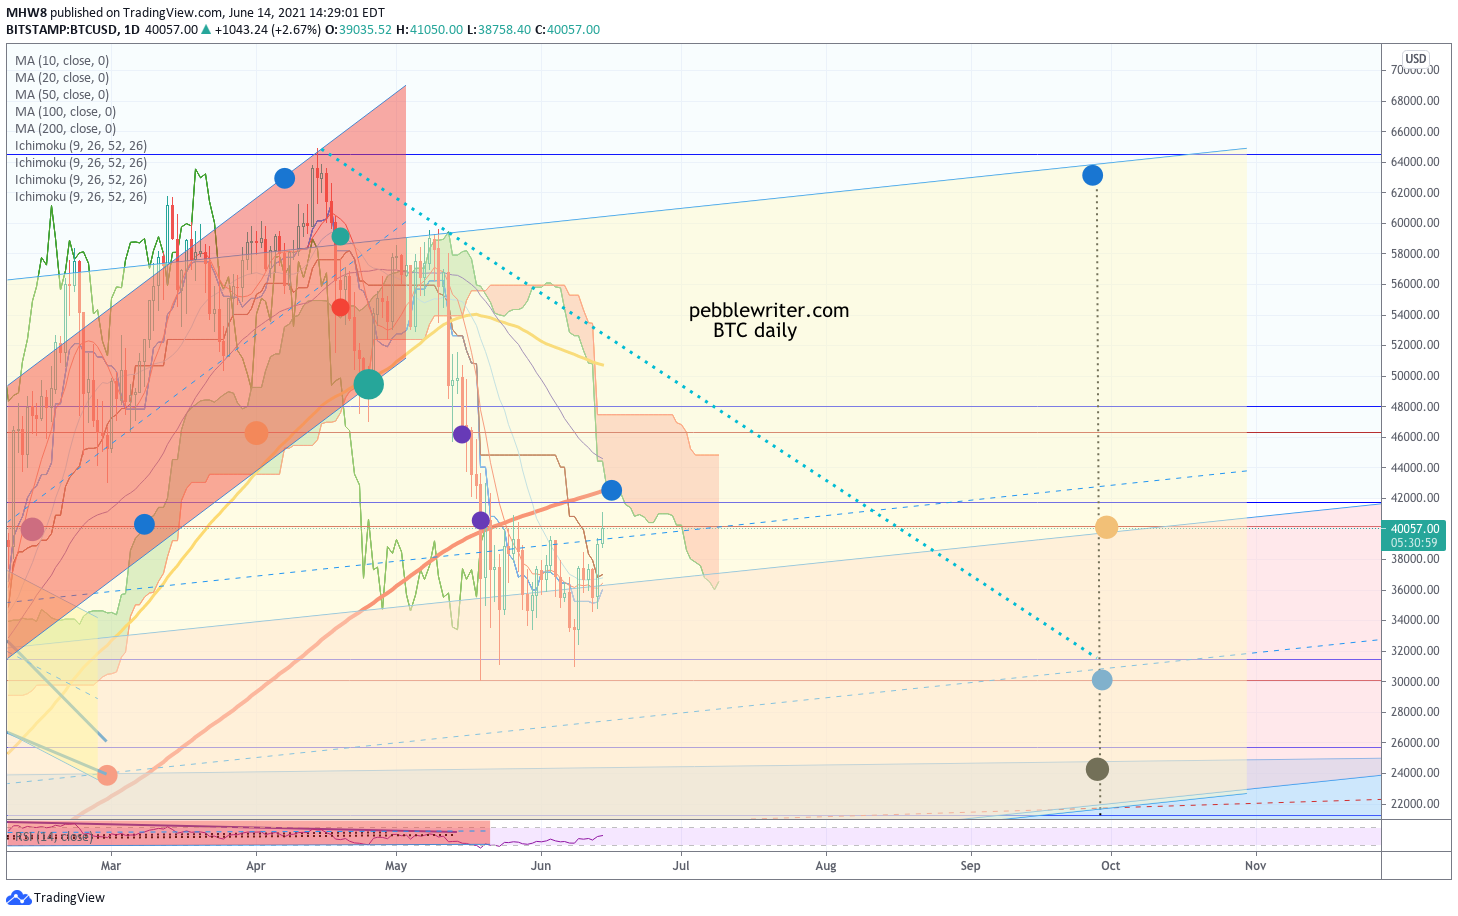
Although I respect Paul Tudor Jones’ views on inflation, the economy and bitcoin, I should point out that BTC has significant overhead resistance at these prices. Recall that it bounced after tagging its 2.618 (at which point we turned bullish), backtested its SMA200 – (at which point we turned bearish again) and has, so far, failed to put together a bullish 10/20 cross. If it manages to squeak a little higher, it will run smack into its SMA200 again – probably about the time it also reaches its bearish cloud. Note that it has again run into what has been a very reliable RSI trend line. If it pushes through the SMA200 and into the cloud, by all means chase it with tight stops. But, it’s looking pretty iffy at the moment. And, if the Fed pulls back on the inflation lever, it could be in for a drop to blue 1.272 Fib at 25,725.
 A little housekeeping…I have some travel planned in the next few weeks – meaning posts will usually be limited to early morning or late afternoon opportunities.
Dates that will likely be affected:
– June 15
– June 18
– June 28
– July 8-9
– July 26-30 or Aug 2-6
I’ll provide more precise info as the dates approach. Tomorrow I’ll be able to post only in the morning.