It’s interesting how Khashoggi’s murder top-ticked oil and gas prices…

 …and, so soon after Trump’s latest demand that OPEC lower oil prices.
 I’m certainly not insinuating that Trump had anything to do with Khashoggi’s murder.
But, OPEC ignored Trump’s Sep 20 demand. Two weeks later, oil prices had spiked 10% higher. Since Oct 3, the day of the murder, WTI has fallen 14.5% and RBOB has fallen 16.7%.
As Churchill famously said, “never let a good crisis go to waste.”
* * *
Sometimes it’s quite difficult to anticipate a major market move. You’ve got hundreds of companies, all with their own earnings, outlooks, and market-moving headlines. Then, there’s the economic news of the day, both domestic and foreign. And, of course, there are geopolitical developments such as who’s dismembering or cozying up to whom?
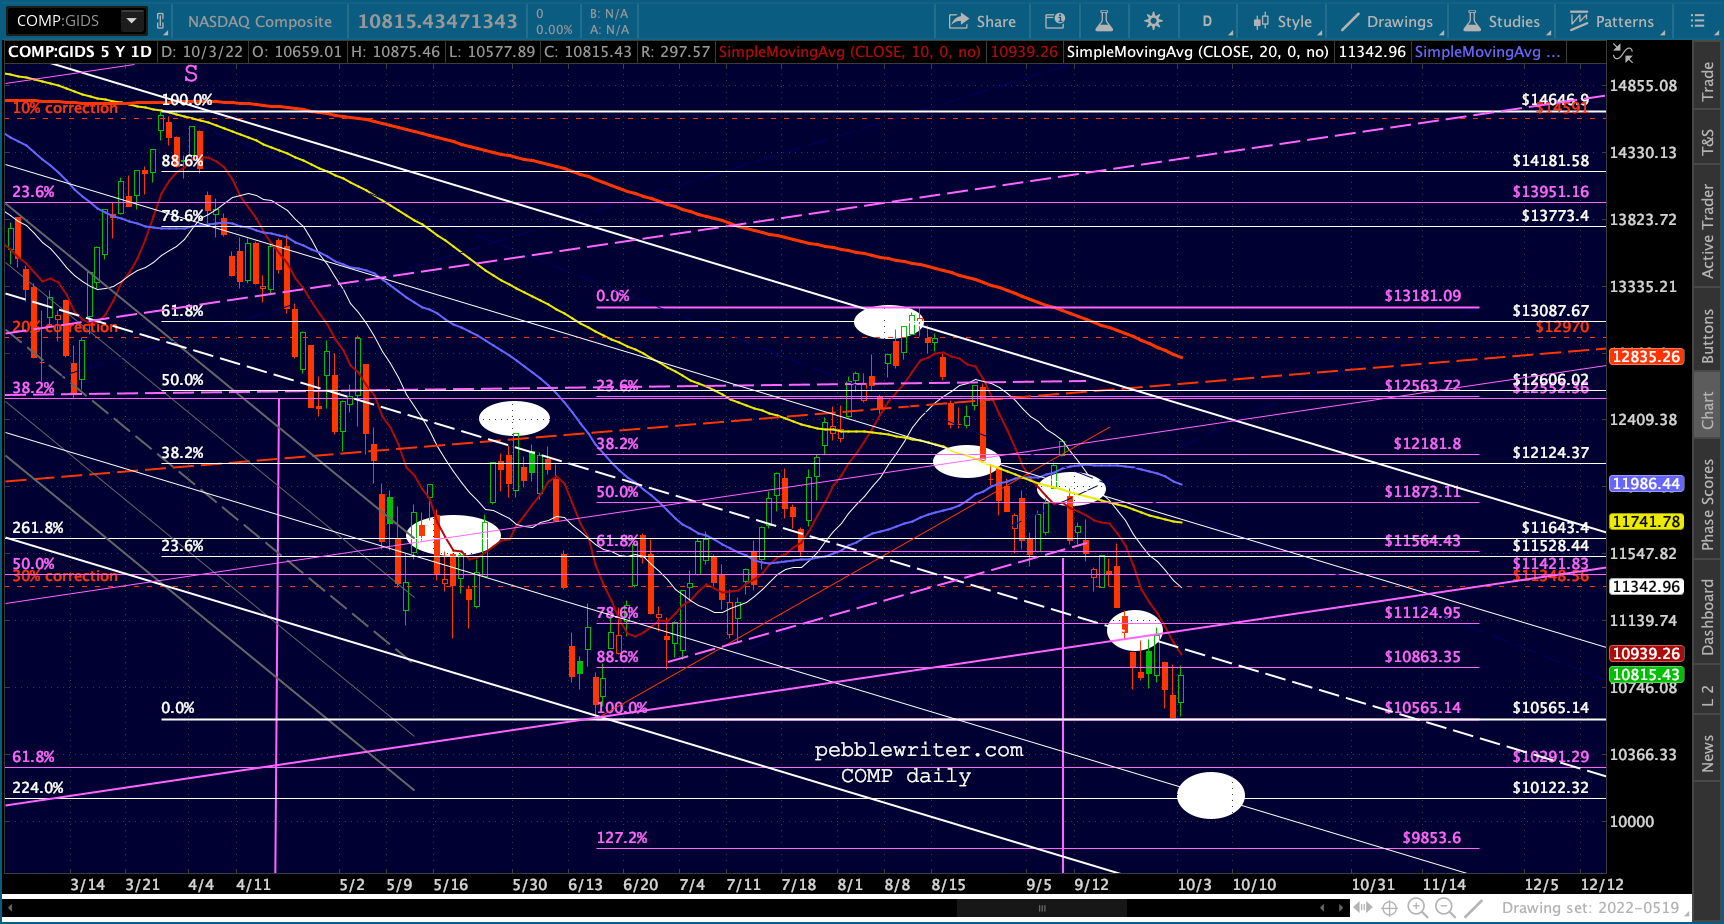
And, sometimes it’s not so difficult at all. It can be as simple as the VIX chart we’ve discussed all week. From Time to Panic on Tuesday:
Note that VIX need only break the purple TL [for SPX to bounce.] If VIX doesn’t break down, this should be the end of the line for this bounce.
It didn’t bounce. SPX plunged. Next?
 Or it can be slightly more complex, but still fairly straightforward — such as is the case with oil and gas.
As we all know, central bank support (low interest rates, among other accommodations) has been critical to stock prices since 2009. Low interest rates, of course, rely on low inflation. And, low inflation relies to a great extent on low oil and gas prices (more accurately, low MoM and YoY increases in those prices.
From last April in Oil & Gas, Inflation and Interest Rates: A Delicate Balance or Goal Seeking?
 The complicating factor, of course, is that oil and gas prices took over the job of stimulating algos (chief among the 90% of all trading activity which is conducted by machines) to drive stocks higher.
Most recently, oil, gas and SPX all bottomed on Feb 11, 2016 and oil and gas prices played an integral role in stimulating the subsequent rally. The most important nudge was in December 2017, when oil and gas prices broke out of an already rising channel.
To chartists, and to algos, this is a very bullish maneuver. It also has the effect of driving inflation and interest rates higher. CPI rose from 2.11% in December 2017 to 2.95 in July 2018. The 10Y rose from 2.31% in December to 3.24% just a few weeks ago.
The Fed told us they were okay with this, that they were going to let the economy and inflation “run hot.” I was among the many doubters, citing the damage that higher rates would inflict on our already alarming budget deficit, but darned if they didn’t do it anyway.  I suppose that, at the end of the day, a temporary increase in the rate at which the debt and interest expense are expanding was less important than having a higher perch from which to crash rates during the next GFC.
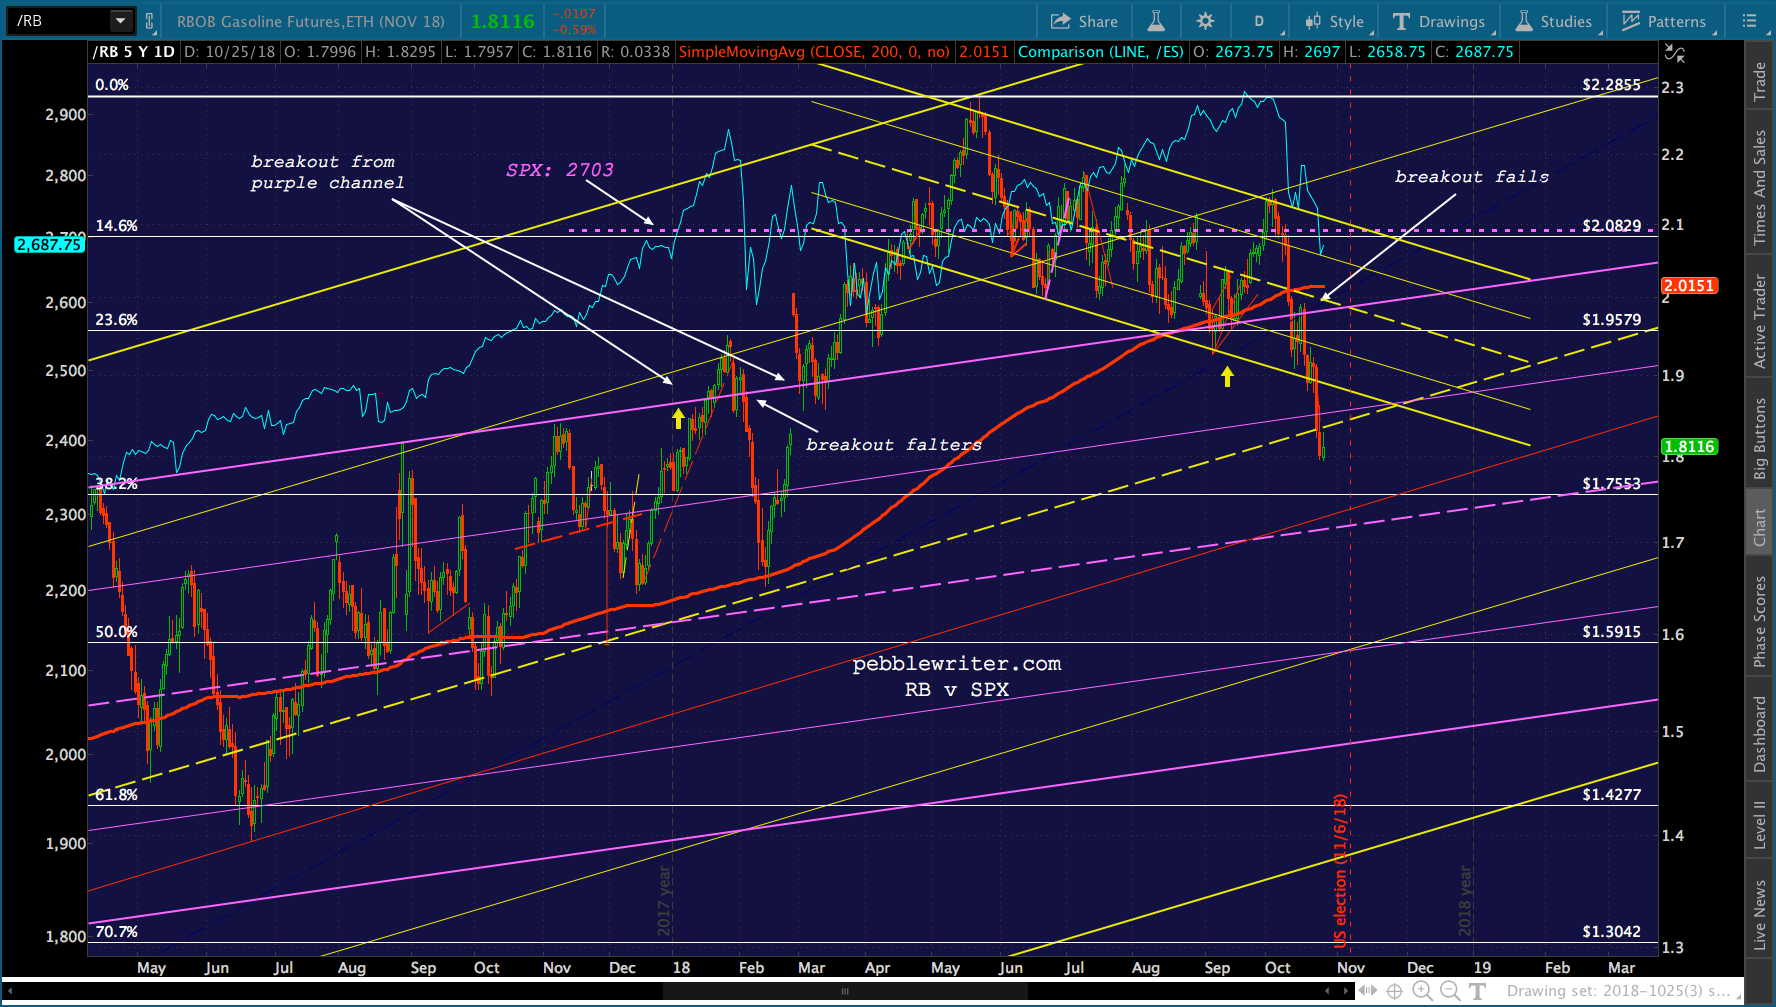
Stocks ignored the implications for a while, happy to play follow the leader with oil and gas prices. The day that RBOB popped out of the rising purple channel was the day that SPX popped above its 2.24 Fibonacci extension at 2703 – a level which might otherwise have provided serious overhead resistance. It can be seen as the horizontal, purple trend line on the chart below.  In early February, though, RBOB’s breakout faltered. No surprise, but SPX followed along, suffering its biggest and sharpest decline in years. Like magic, RB quickly popped back above the purple channel top – rescuing SPX and helping it back above 2703.
Note that SPX went on to new all-time highs in September, only after RB backtested the purple channel and bounced higher.
 And this lovely little correction we’re enjoying? SPX topped the day that RB failed to break out of the falling yellow channel (also the day of Khashoggi’s murder.) SPX fell through its 200-day moving average on the day that RB plunged back below the purple channel top. And, SPX plunged below 2703 on the day that RB fell out of the falling yellow channel.
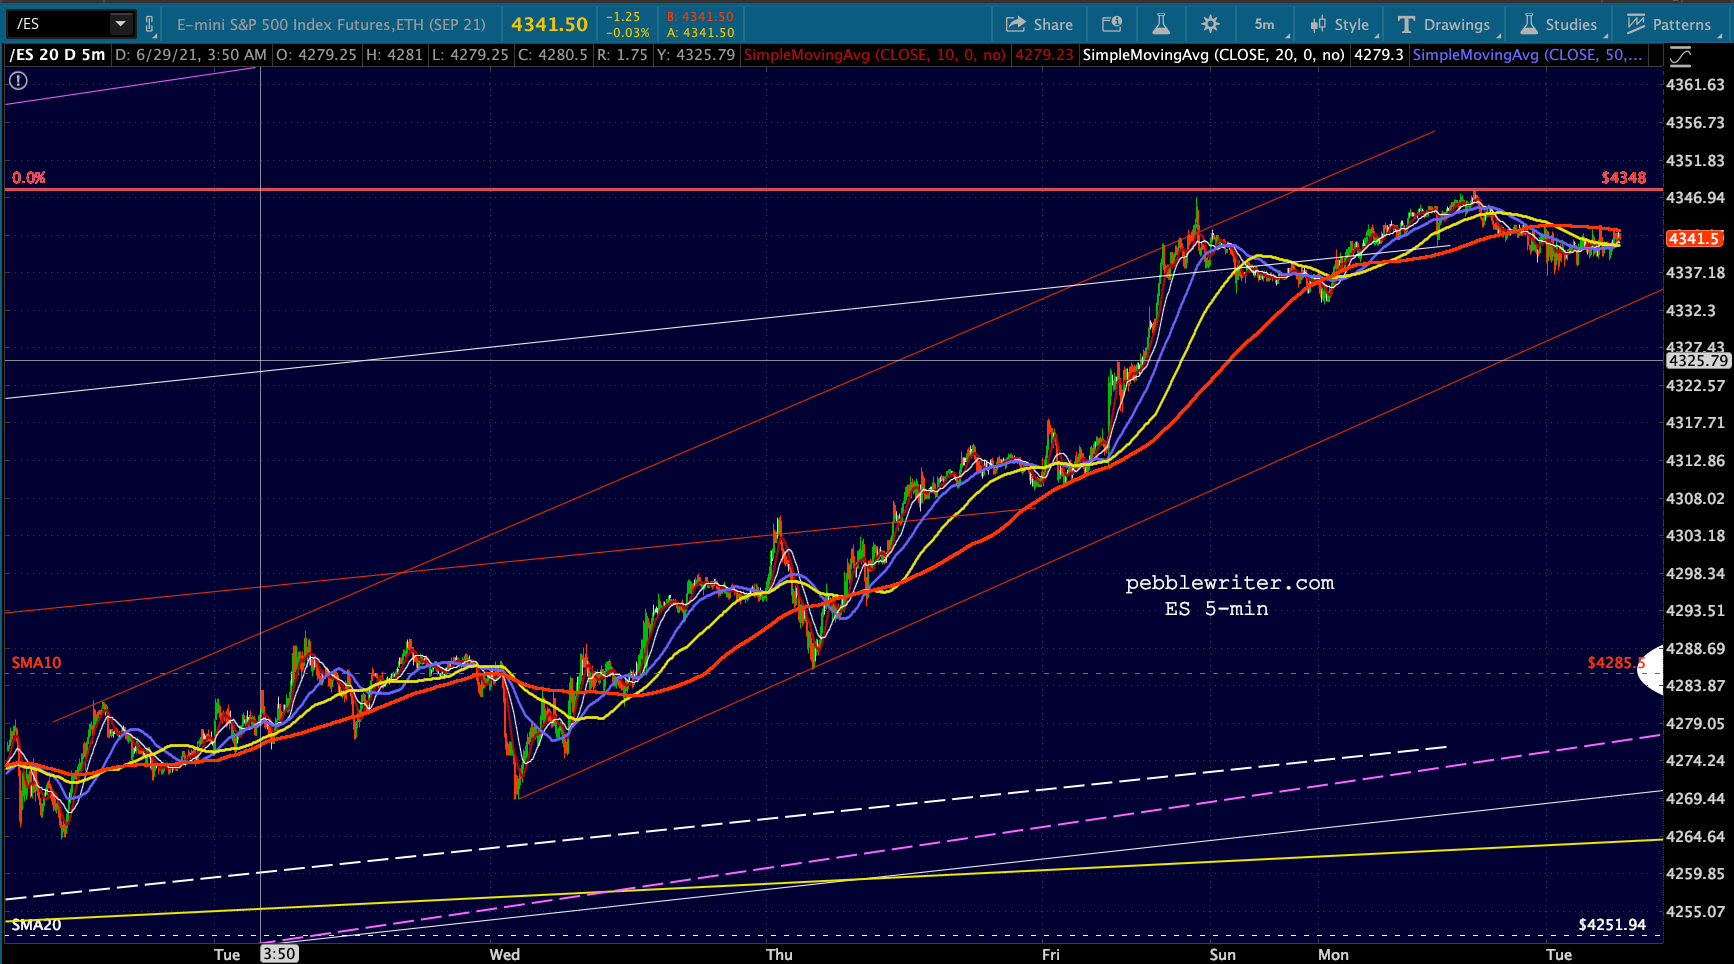
With the elections less than two weeks away, I’m not expecting a sharp rebound in oil and gas prices any time soon. So, the algos will have to rely on other tools — such as VIX, which has now shed 12.5% since tagged our 26 target yesterday.
So far, VIX’s decline has produced a pretty nifty bounce. Is it enough to offset weakness in oil and gas and a hawkish Fed which has been browbeaten by a “low-interest rate president?”
continued for members... (more…)


 As always, this allowed equities to leapfrog an area of stubborn overhead resistance.
  continued for members… (more…)