

The great thing about studying how algos dominate the equity markets is that, if you look very carefully, you can see the gears and levers working in the background. In this morning’s pre-market, we can see a number of factors sliding into place which are designed to stop the market’s bleeding.
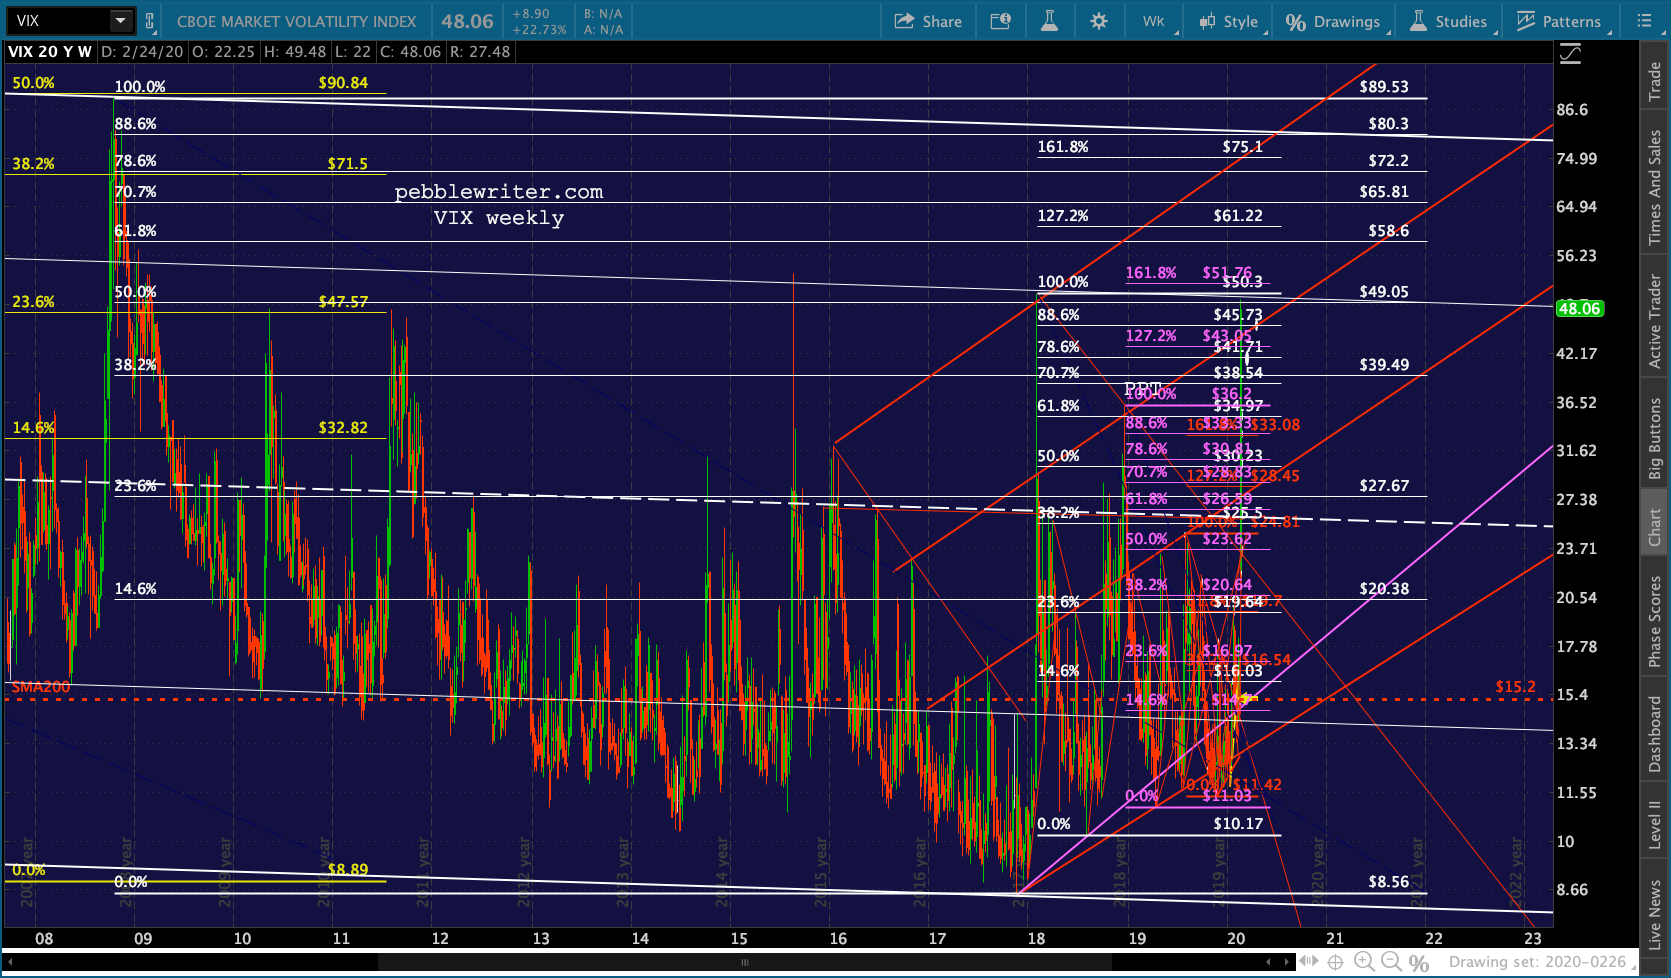
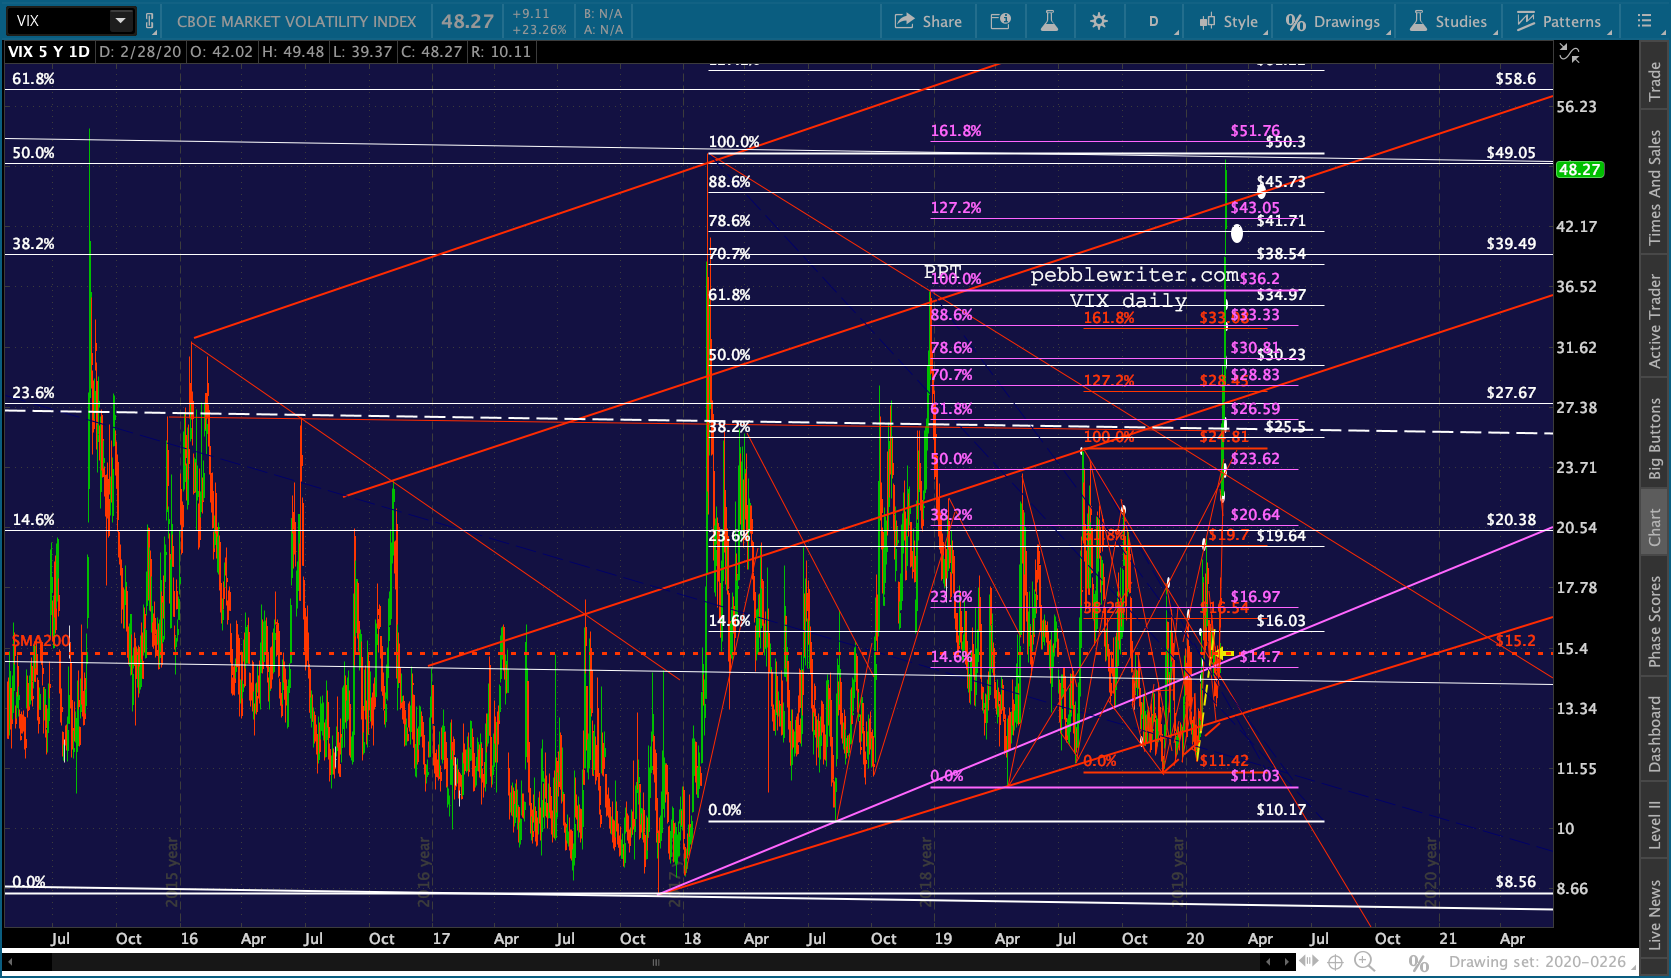
First, VIX reached our topmost price target of 45.73 overnight. This represents very significant overhead resistance and should be met with heavy selling pressure. It’s a very logical place for central bankers to take a stand if they hope to support stocks.
 Next, USDJPY has almost reached our SMA200 target. After its failed breakout, this would be a logical place for the BoJ to attempt to take a stand…
 …which, combined with EURUSD reaching our next upside target…
 …should allow DXY to get a nice bounce here at our downside target.
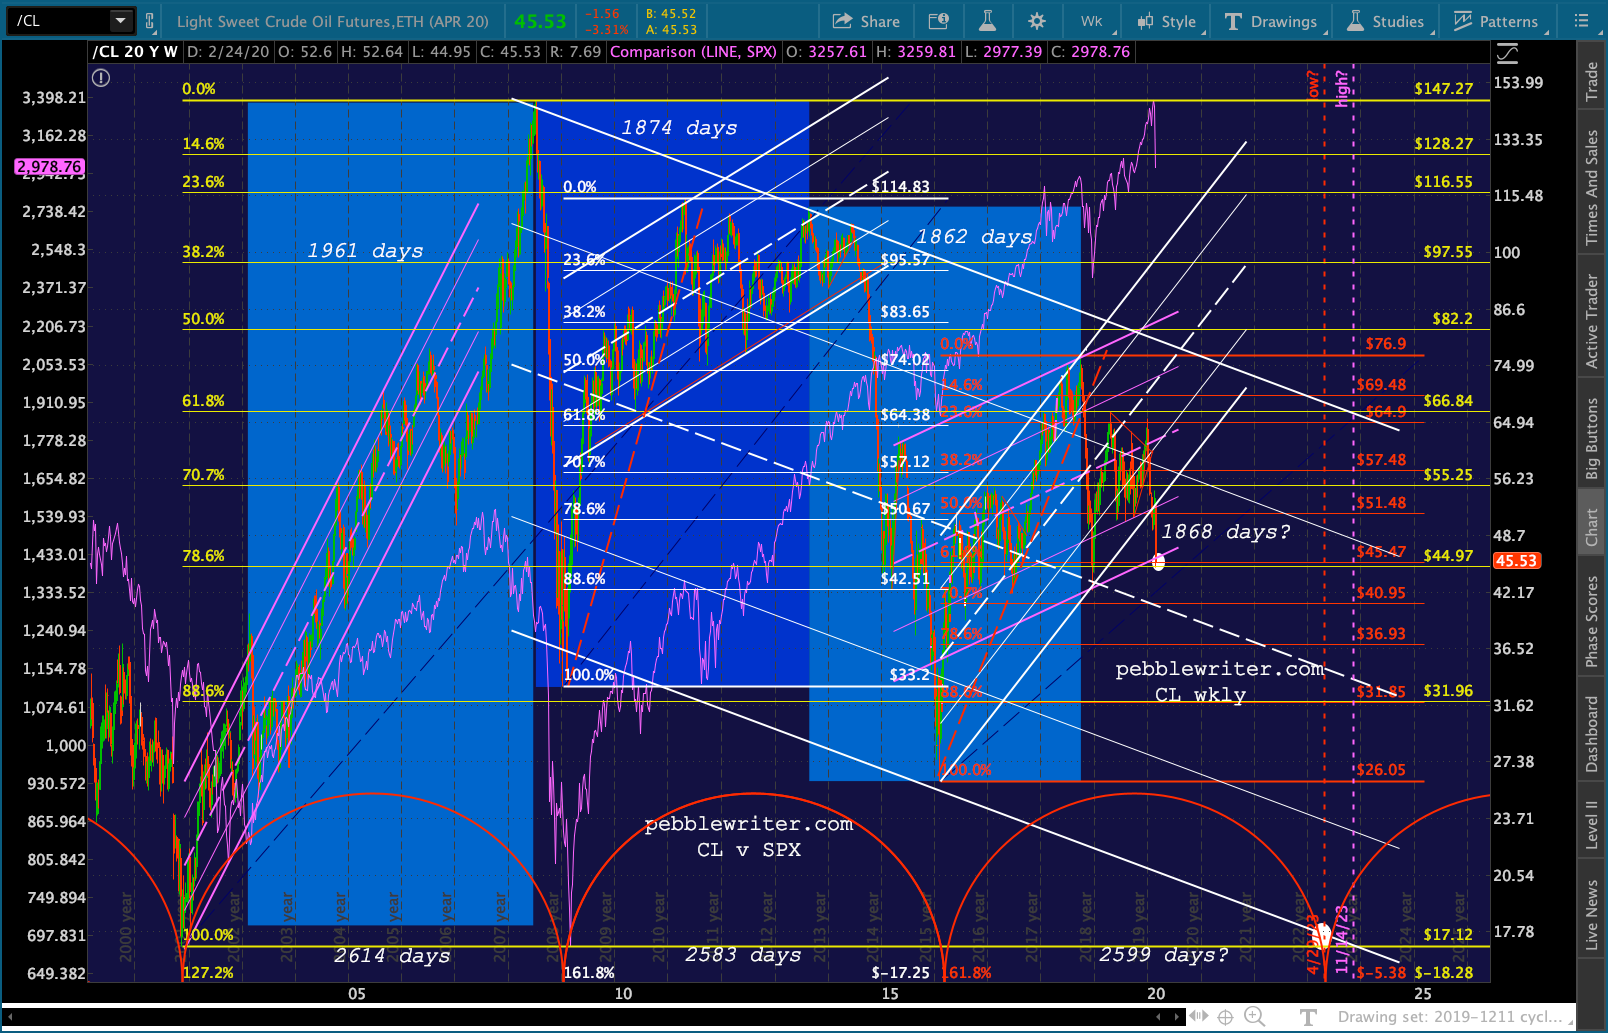
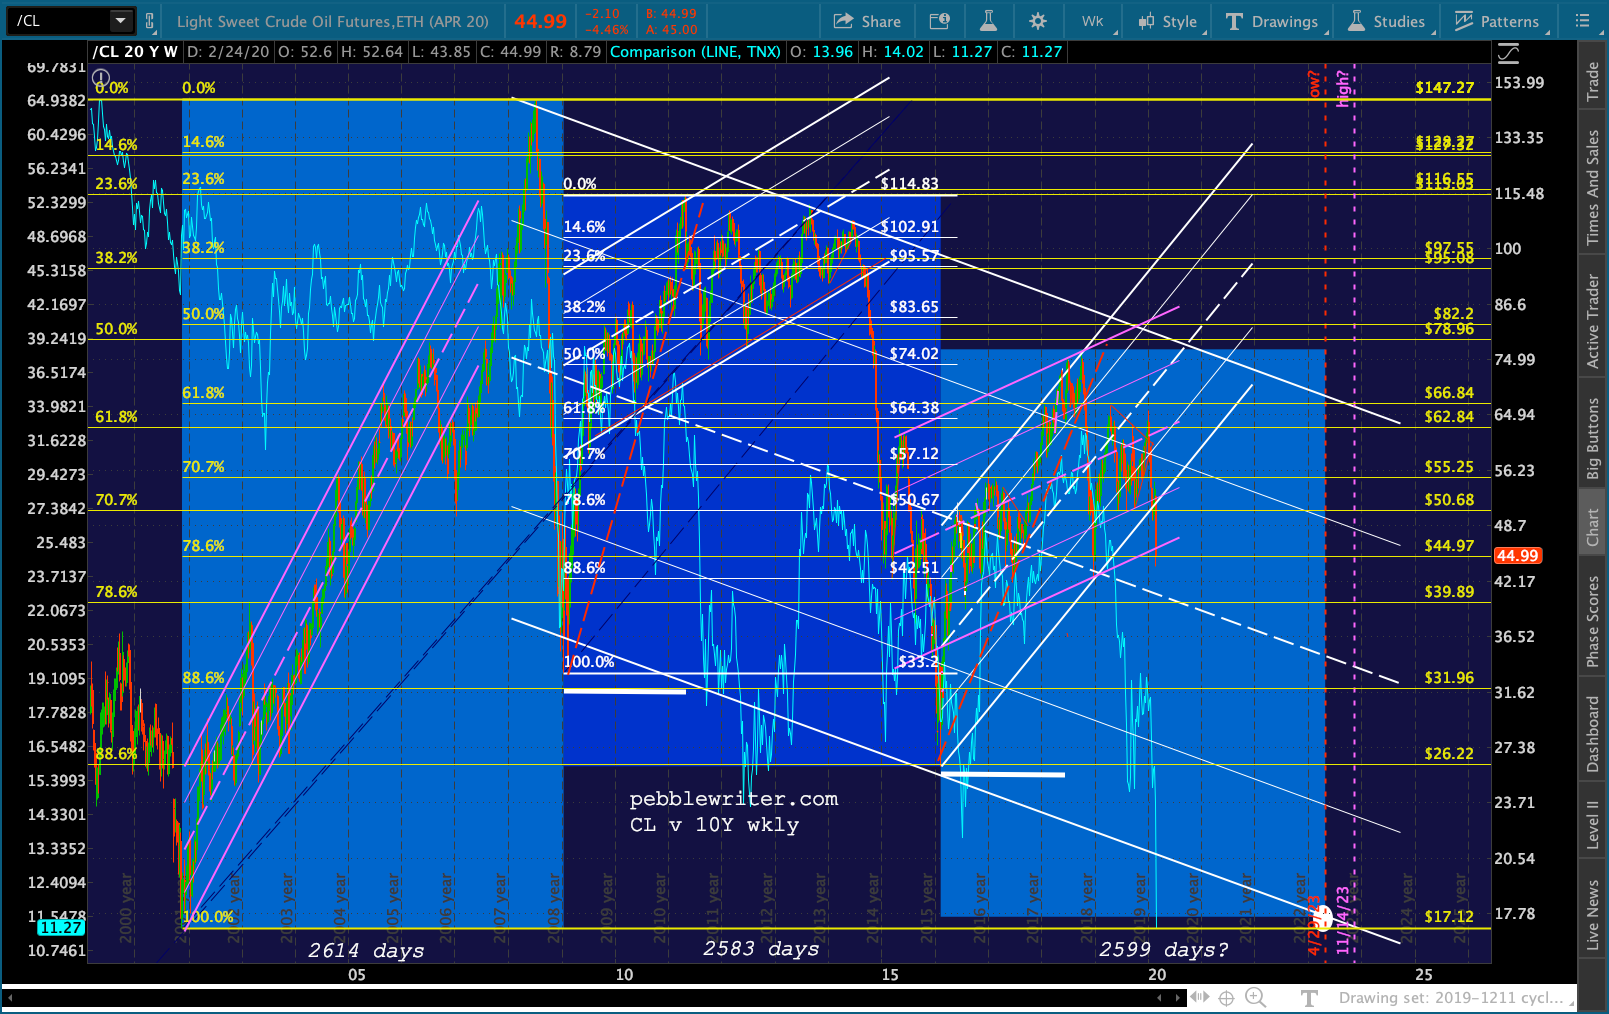
 CL has also reached our downside target, transitioning from one channel to another less steep channel and beginning an extended bounce which will ultimately result in a tremendous downturn. But, for now, it’s an important place for OPEC et al to take a strong stand.
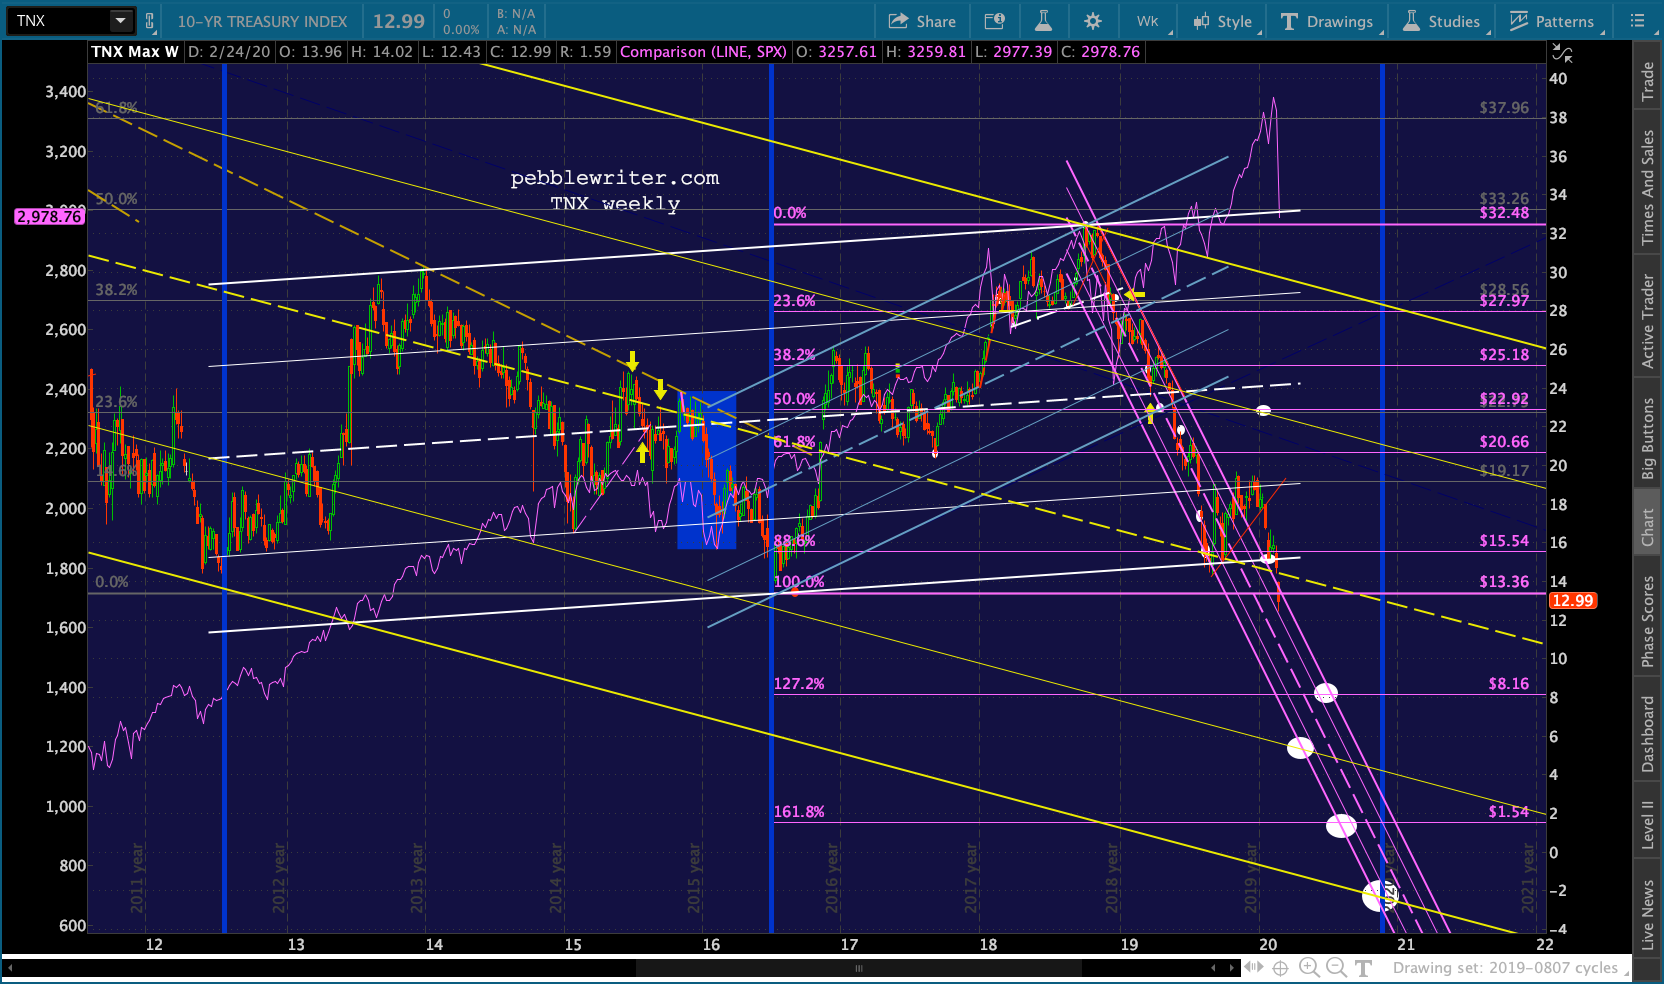
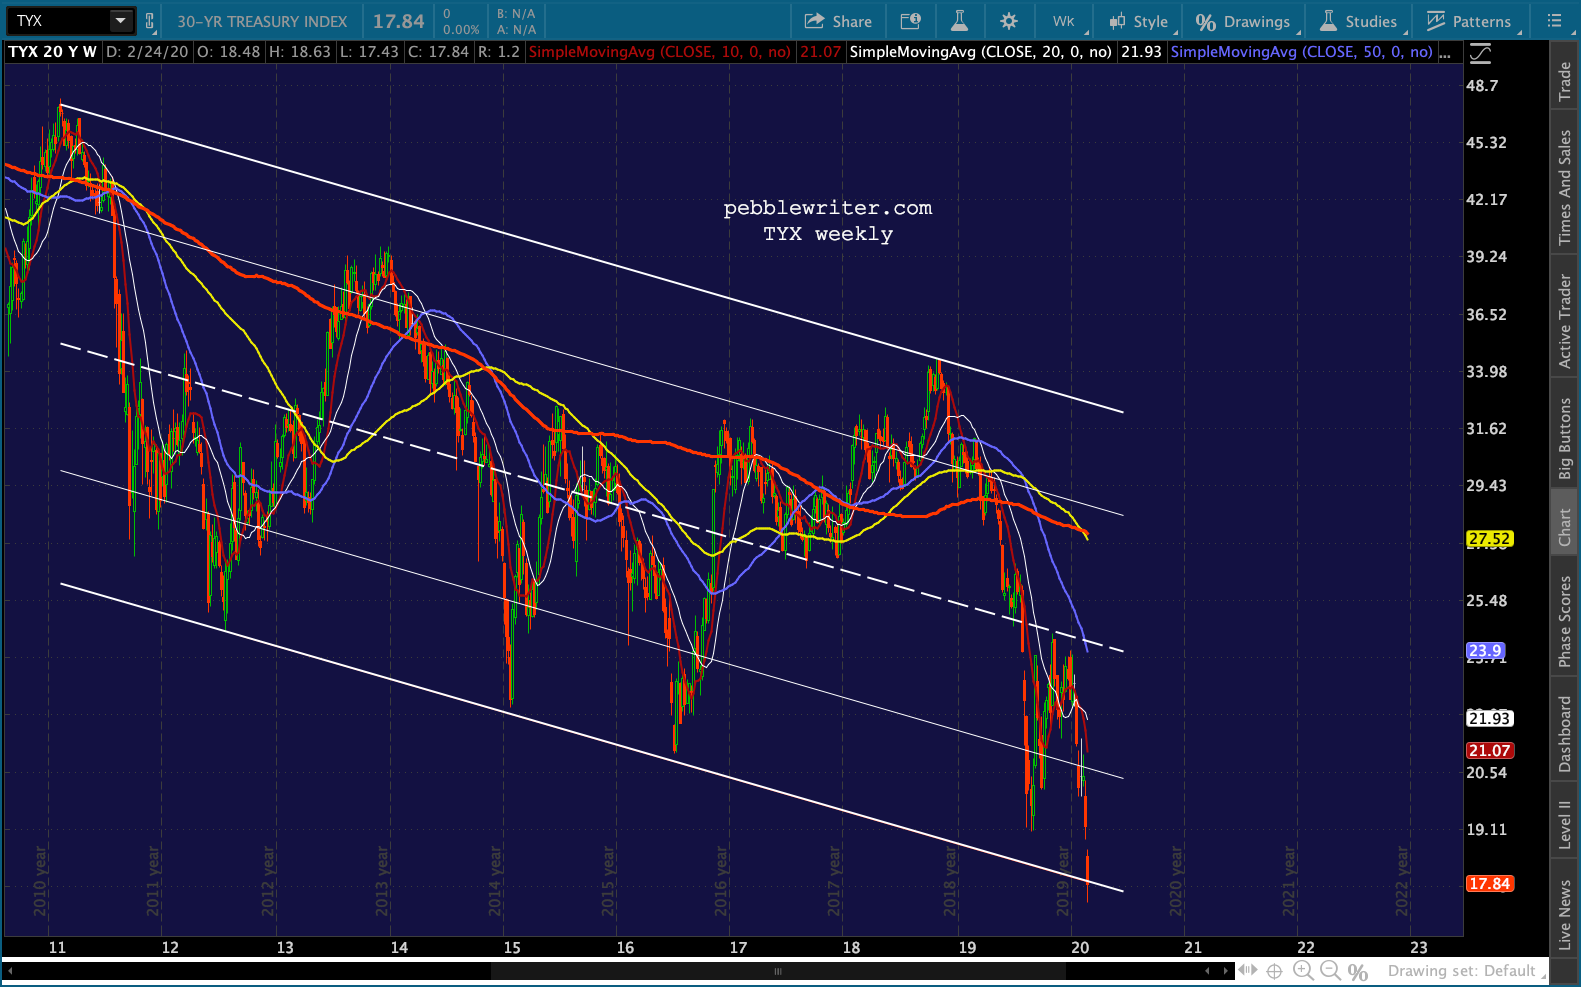
 And, last, the 10Y is bumping up against our highest targets (for this cycle.) A move above 135’155 would unleash another torrent of selling. It’s a very good place to take a stand…
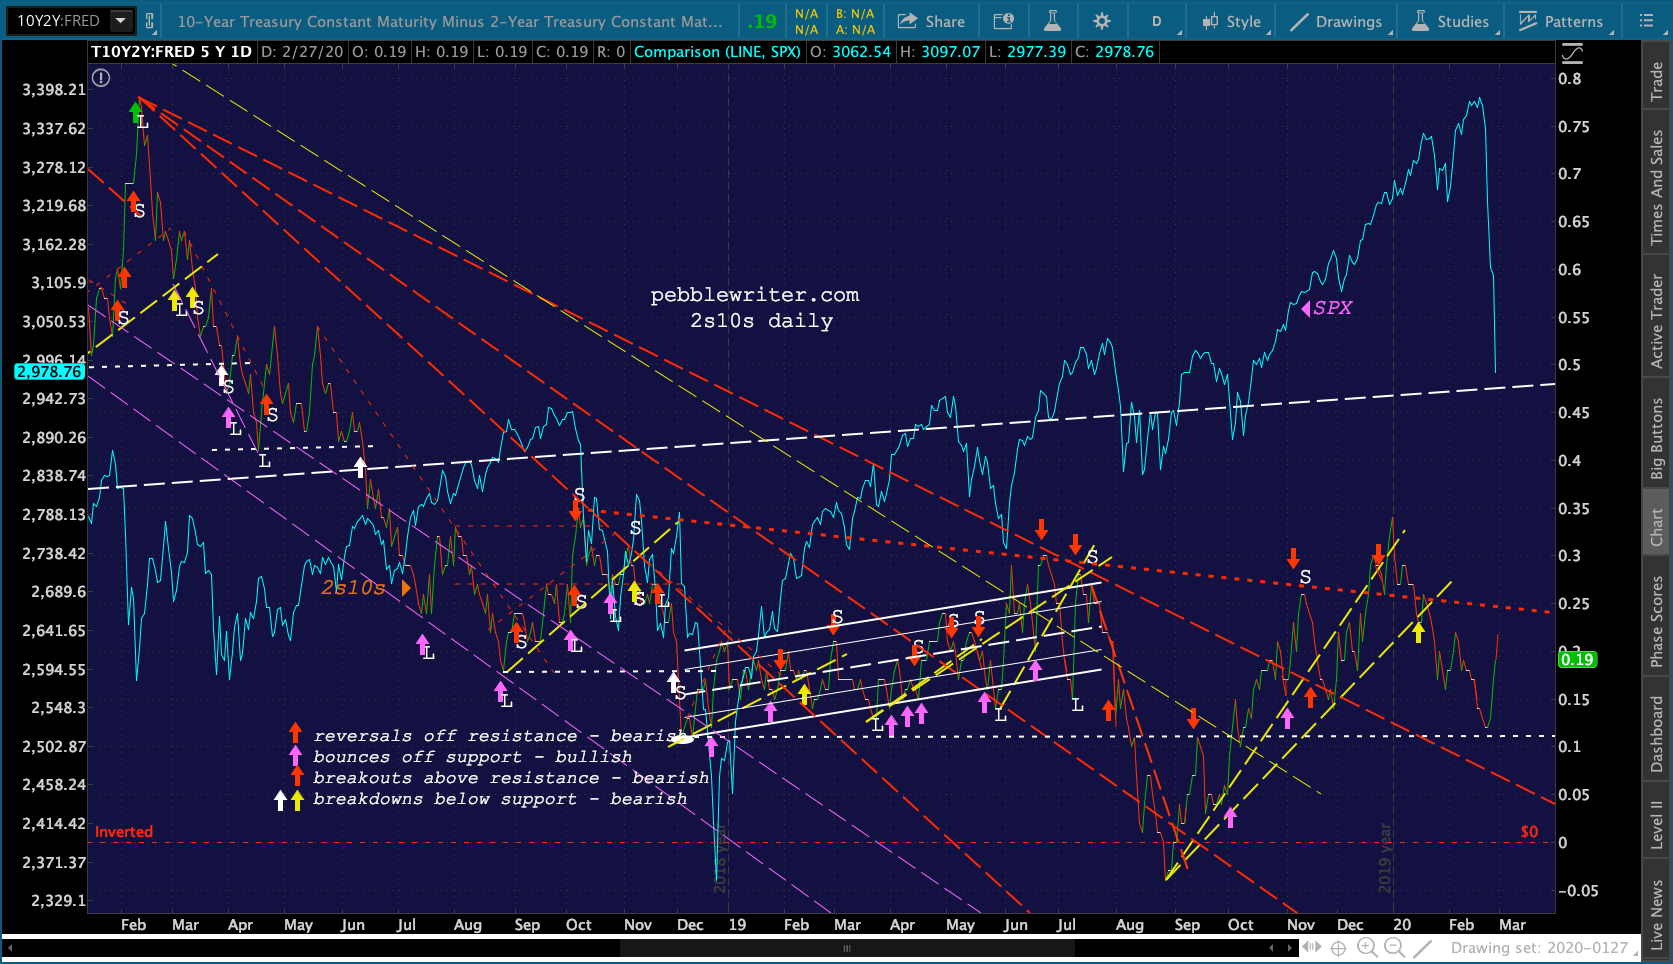
 …especially as 2Y yields have reached our 0.95% target.
 There are countless other “tells” I could detail – none of which guarantee that the current decline is over – only that a concerted effort is being made to prevent SPX from falling below important support levels to our favorite target at 2703.62.
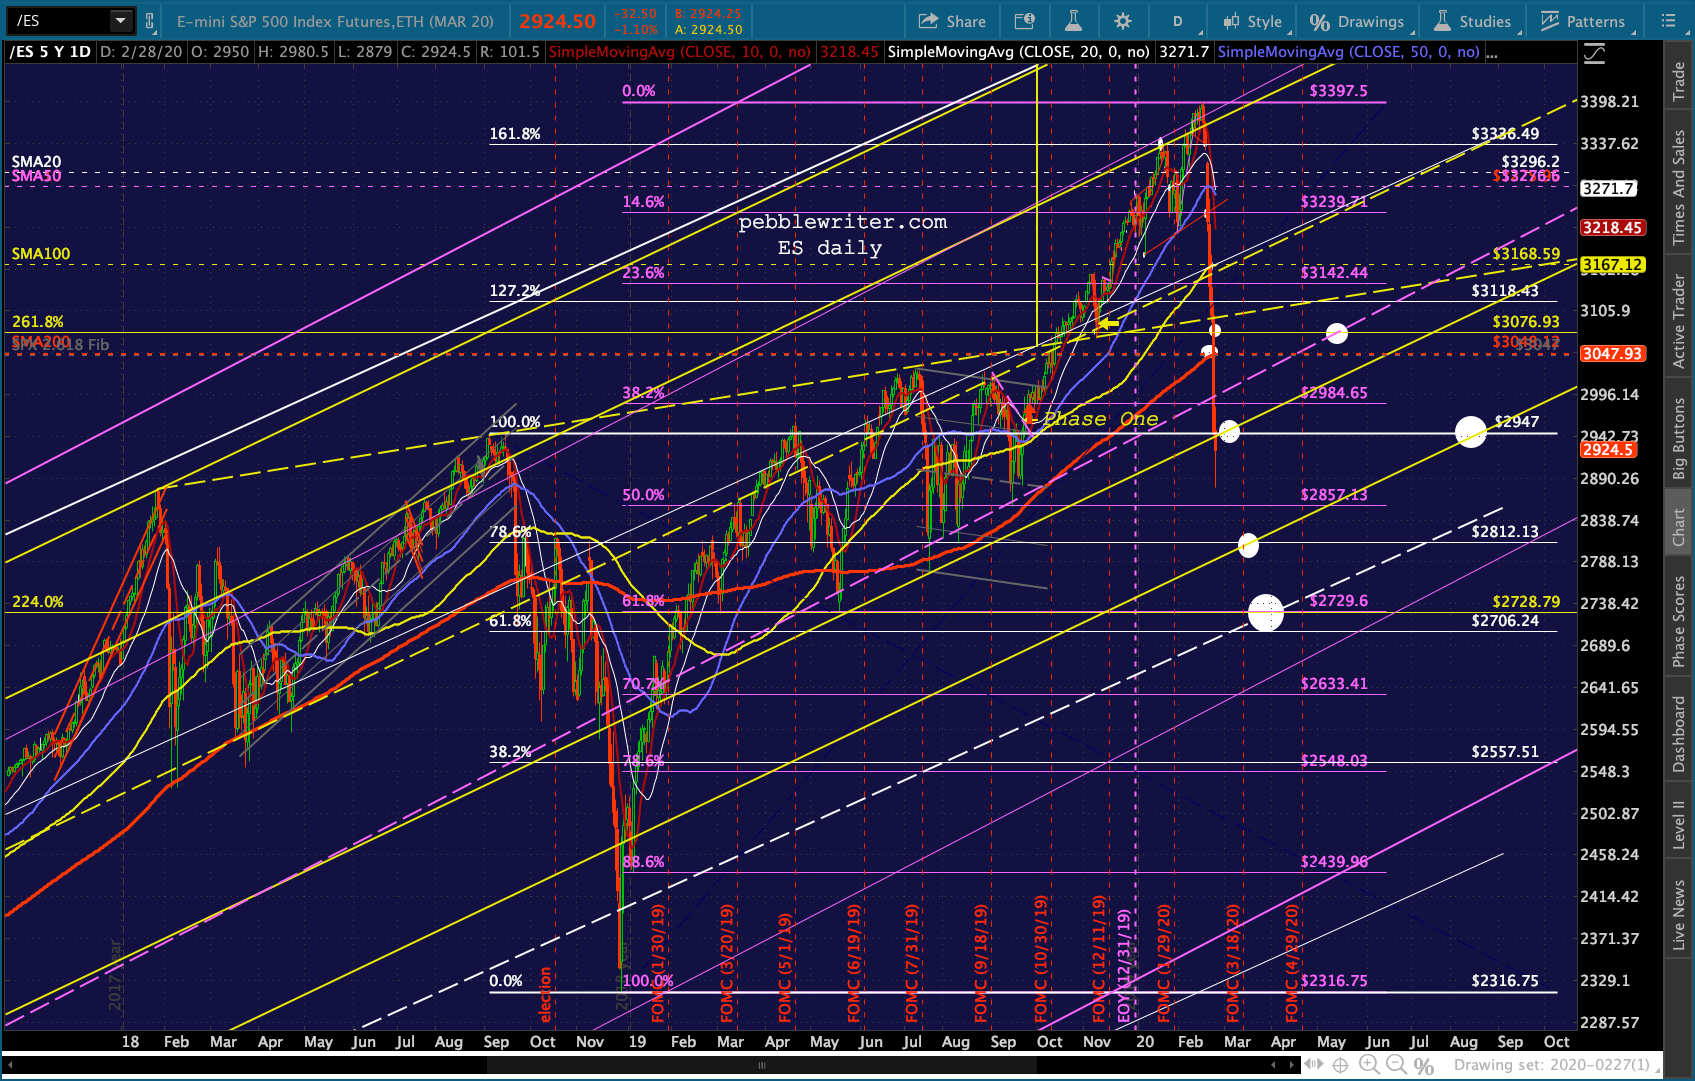
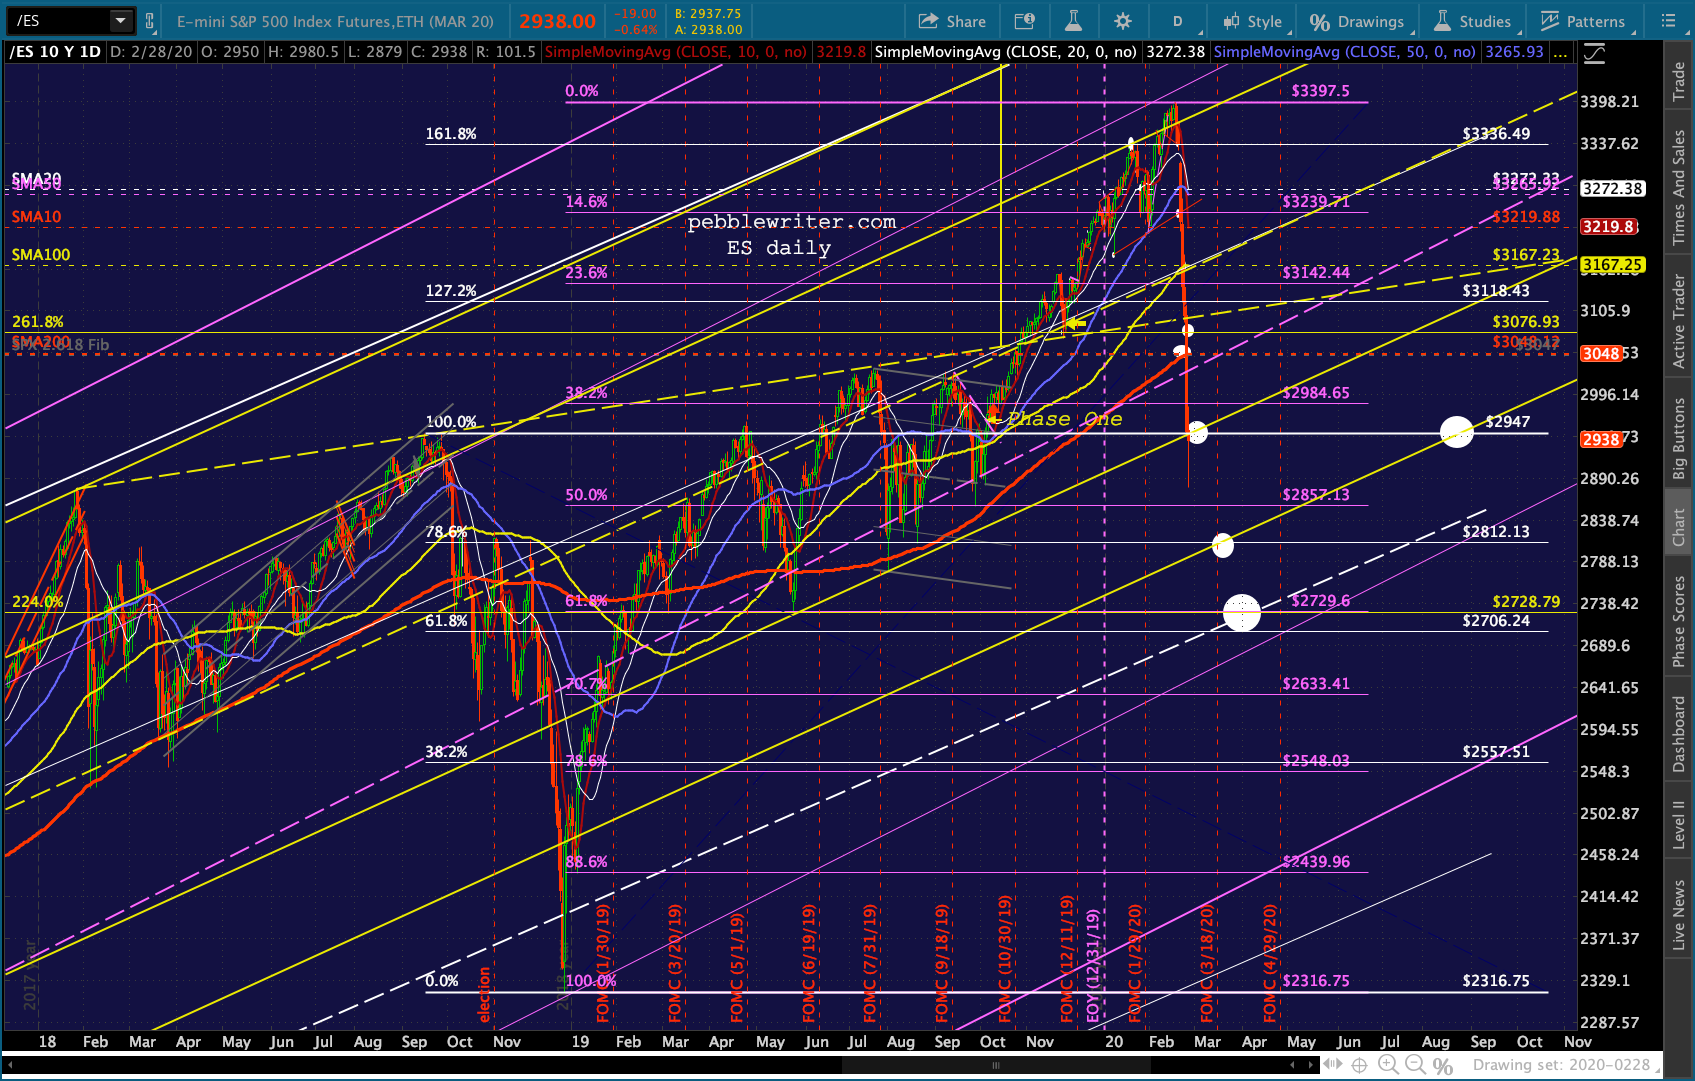
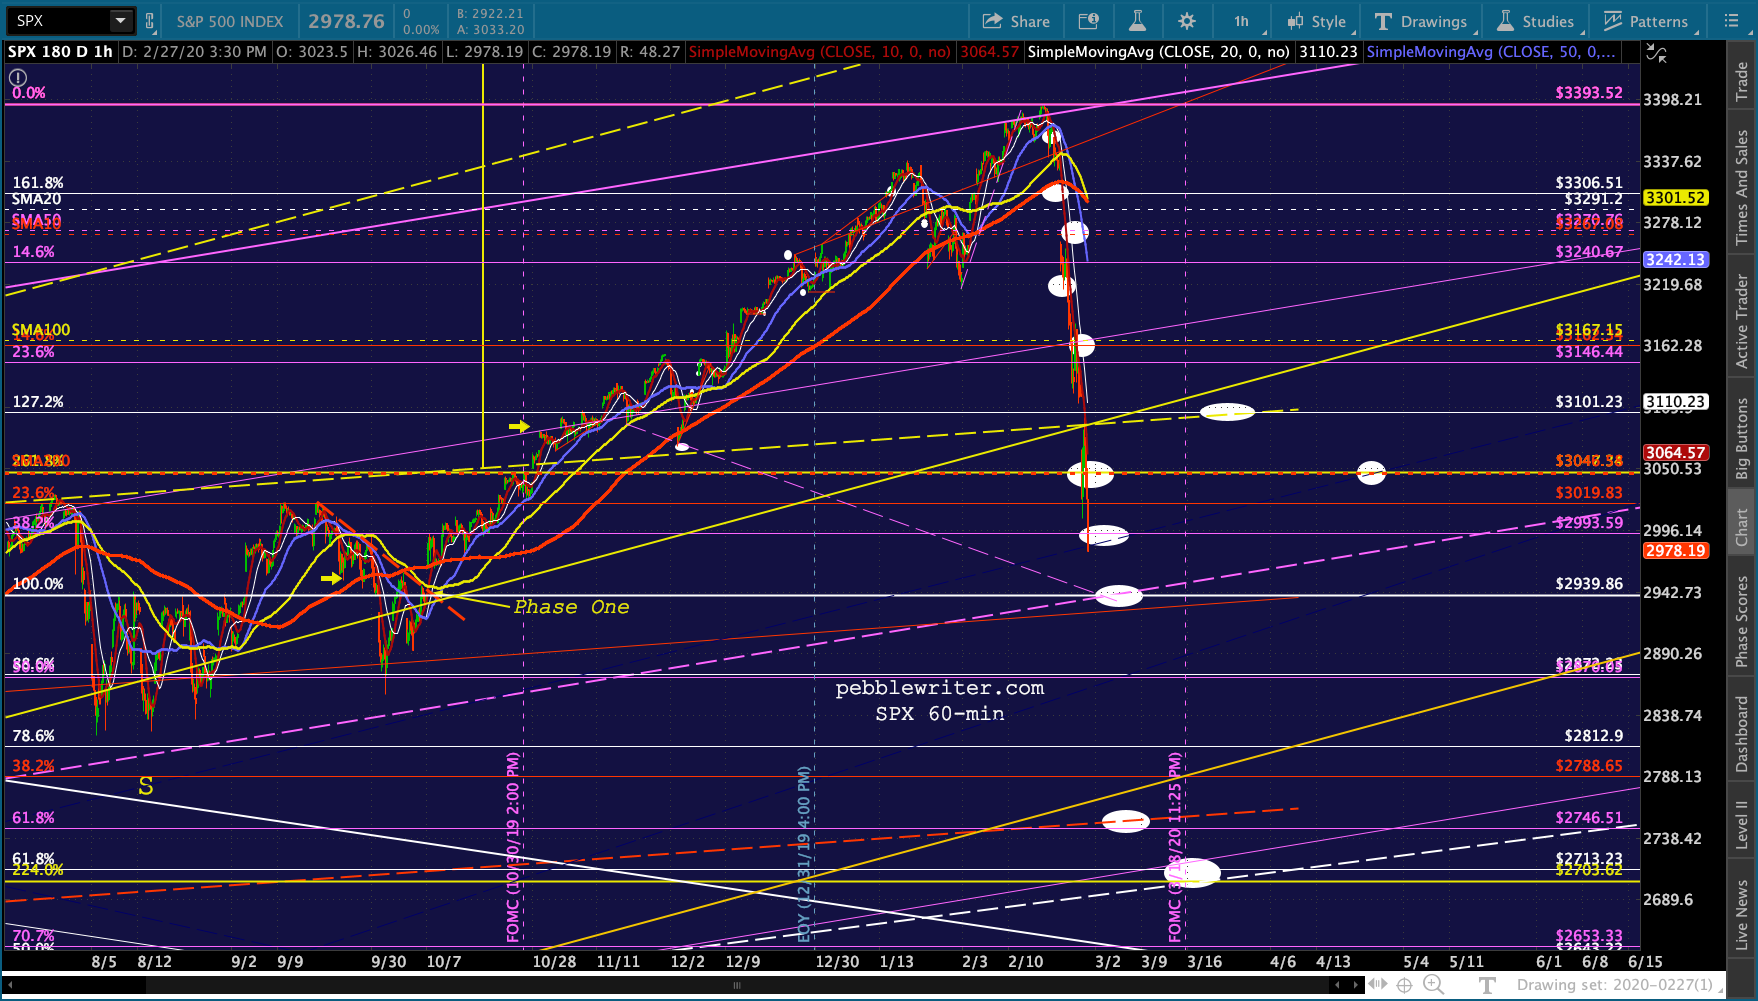
ES fell below its September 2018 highs (2947) overnight, but is bouncing. The logical implication is that SPX’s Sep 2018 high of 2939.86 will be defended. If it fails, then the 13.3% correction will almost certainly turn into a 20% correction.
This correction seems to have many investors flummoxed. It shouldn’t. By simply paying attention to the charts, these moves can be anticipated. As we noted on the 18th, two sessions before the top:
…be very careful in chasing this breakout. It is built on a very weak algo-driven foundation which, given the coming moves in CL, DXY, USDJPY and TNX, cannot stand. When it cracks, it could be quite violent.
And, on Buckle Up posted on the 20th:
The coronavirus is the wild card, of course. It has the potential to blow all of the above provisions out of the water – starting with the currency and bond picture. A flight to safety which sends ES back below 3336.49 is a clear sell signal.
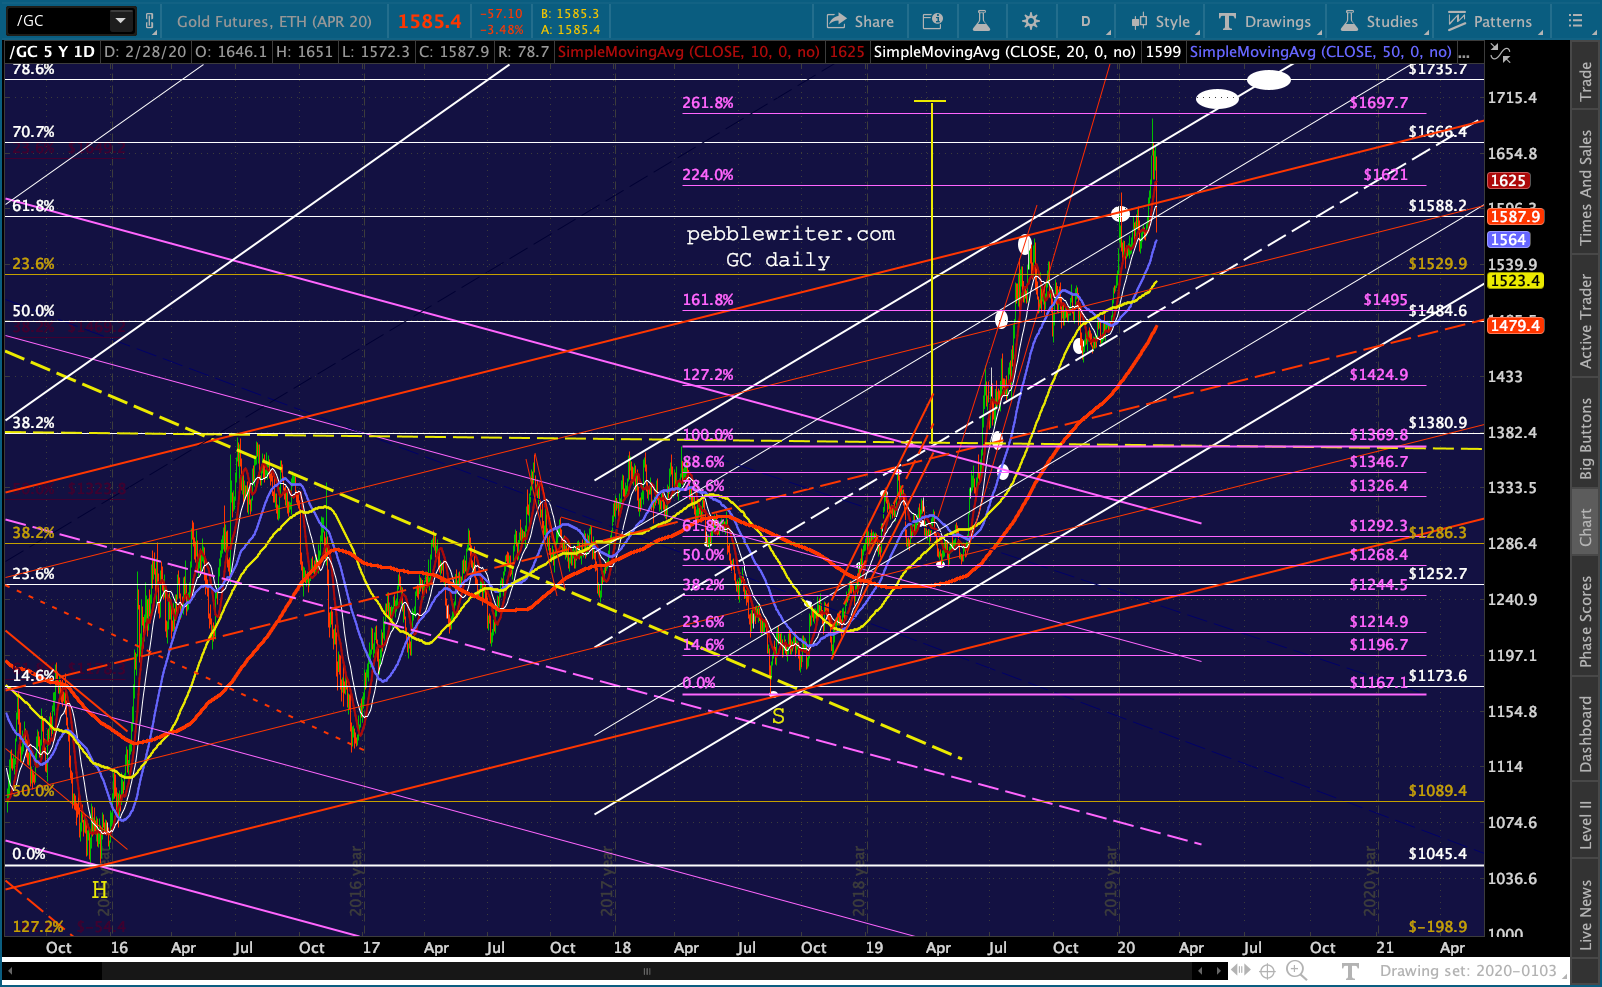
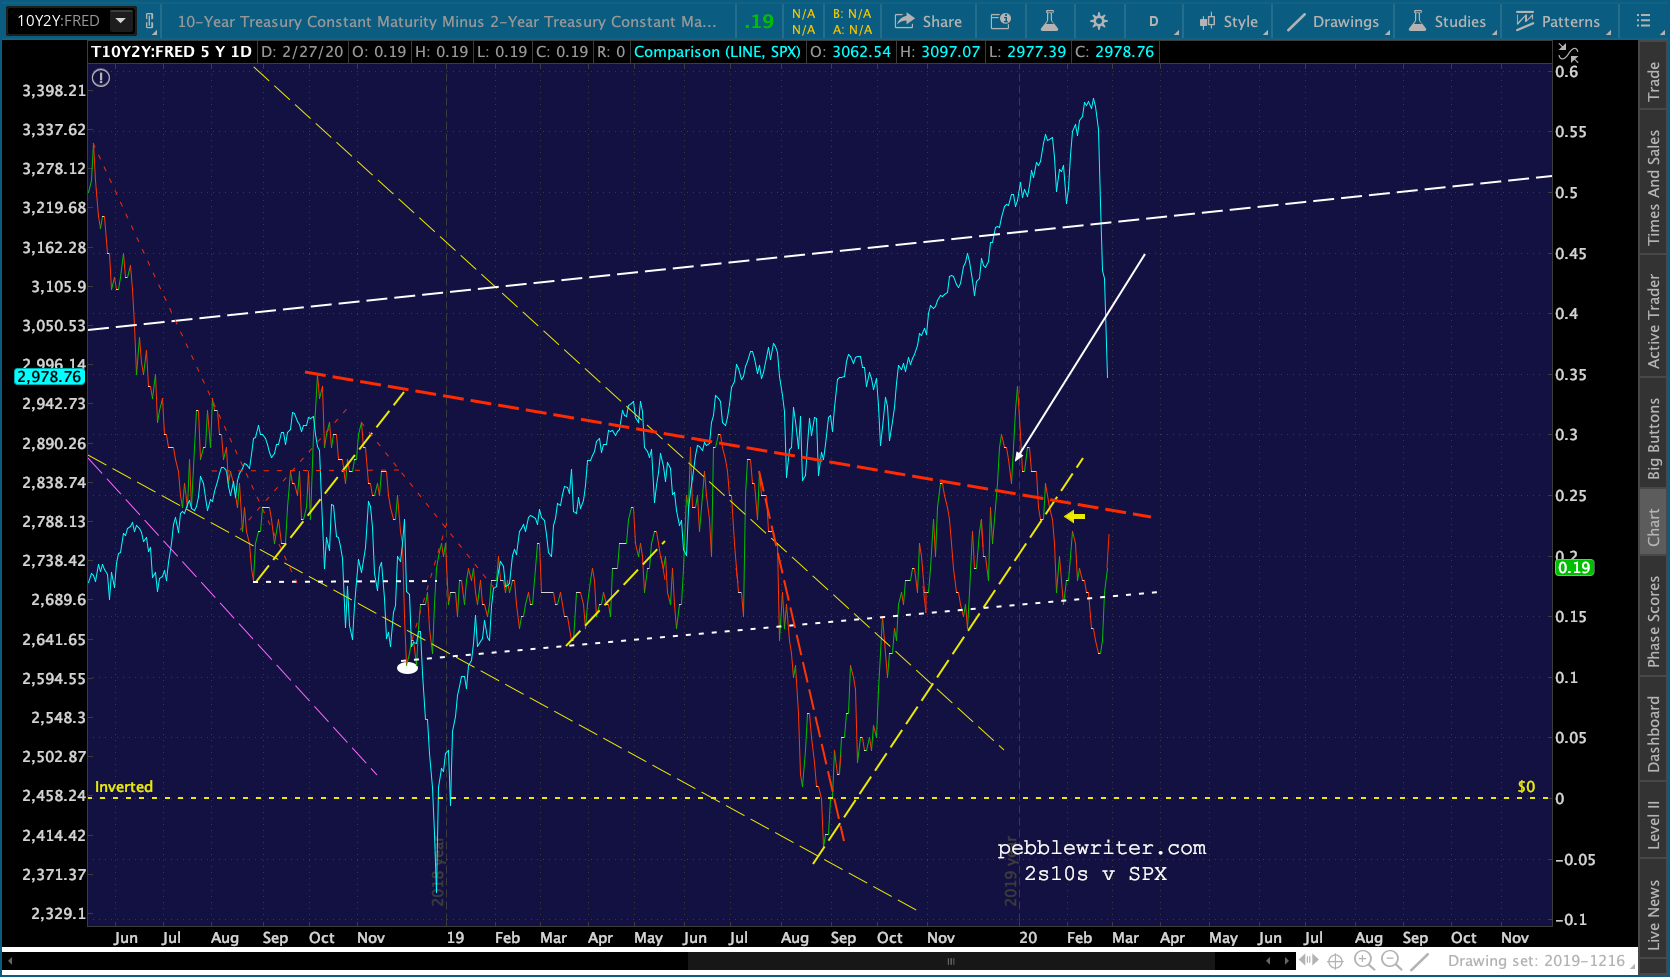
And, from Just When You Thought it Was Safe on the 21st when we got sell signals from DXY, CL, the 10Y, the 2Y, 2s10s, EURUSD and gold:
ES just tagged 3336.25 – time to bounce if it’s going to. Remember, if it doesn’t bounce, SPX’s 1.618 is way down at 3306.51. And, if these 1.618 extensions don’t hold, it could be game over for stocks.
This is the daily chart posted that day…
 …and where we are as of yesterday’s close.
 The problem with taking a stand, of course, is that markets are now dominated by algos and an assortment of trend-following robo-investors. These are the very dynamics which made the never-ending rally possible. They now make it very difficult for stocks to find support.
Sunday is the last day of our membership promotion – an opportunity to get a a handle on what to expect before it happens and save a few bucks at the same time. For details and to sign up now, CLICK HERE.
continued for members…
If this support doesn’t hold, we’ll no doubt see ES dropping to 2728 (or slightly lower to accommodate SPX tagging our favored target of 2703.62.)

 The rest of today’s charts…
Probably the most important is VIX. If it exceeds Feb 2016 highs, things could get very, very messy – with my favorite targets of ES 2728/SPX 2703 an easy get.

 UPDATE: 2:45 PM
ES has bounced back and forth from its lows on the day (2853.25) to 2947, never breaking back above 2947. This is technically a breakdown and backtest, but anything could happen in the last hour of trading and it wouldn’t necessarily change whatever is heading our way after a weekend of potentially important news.
The insinuation is that we will get that next downside leg to ES 2728/SPX 2703 either in the closing minutes or on Monday. If it’s in the closing minutes, no one would be surprised to see massive CB intervention on Monday. Otherwise, a 100-200 pt leg down on Monday might prompt some reaction – though it remains to be seen whether the reaction would be effective.
Presumably it would involve the PPT hammering VIX, the BoJ crushing the yen, a dramatic OPEC deal, the Fed resuming QEnot, and a declaration that the coronavirus was all a big misunderstanding.
The alternative: the reason I suggested stocks might take a stand here at SPX 2939. It was an important interim high on the way up and holding above it would maintain a large, rising channel that maintains the rally from 2009. In other words, holding short over the weekend entails a fair amount of risk…as would holding long.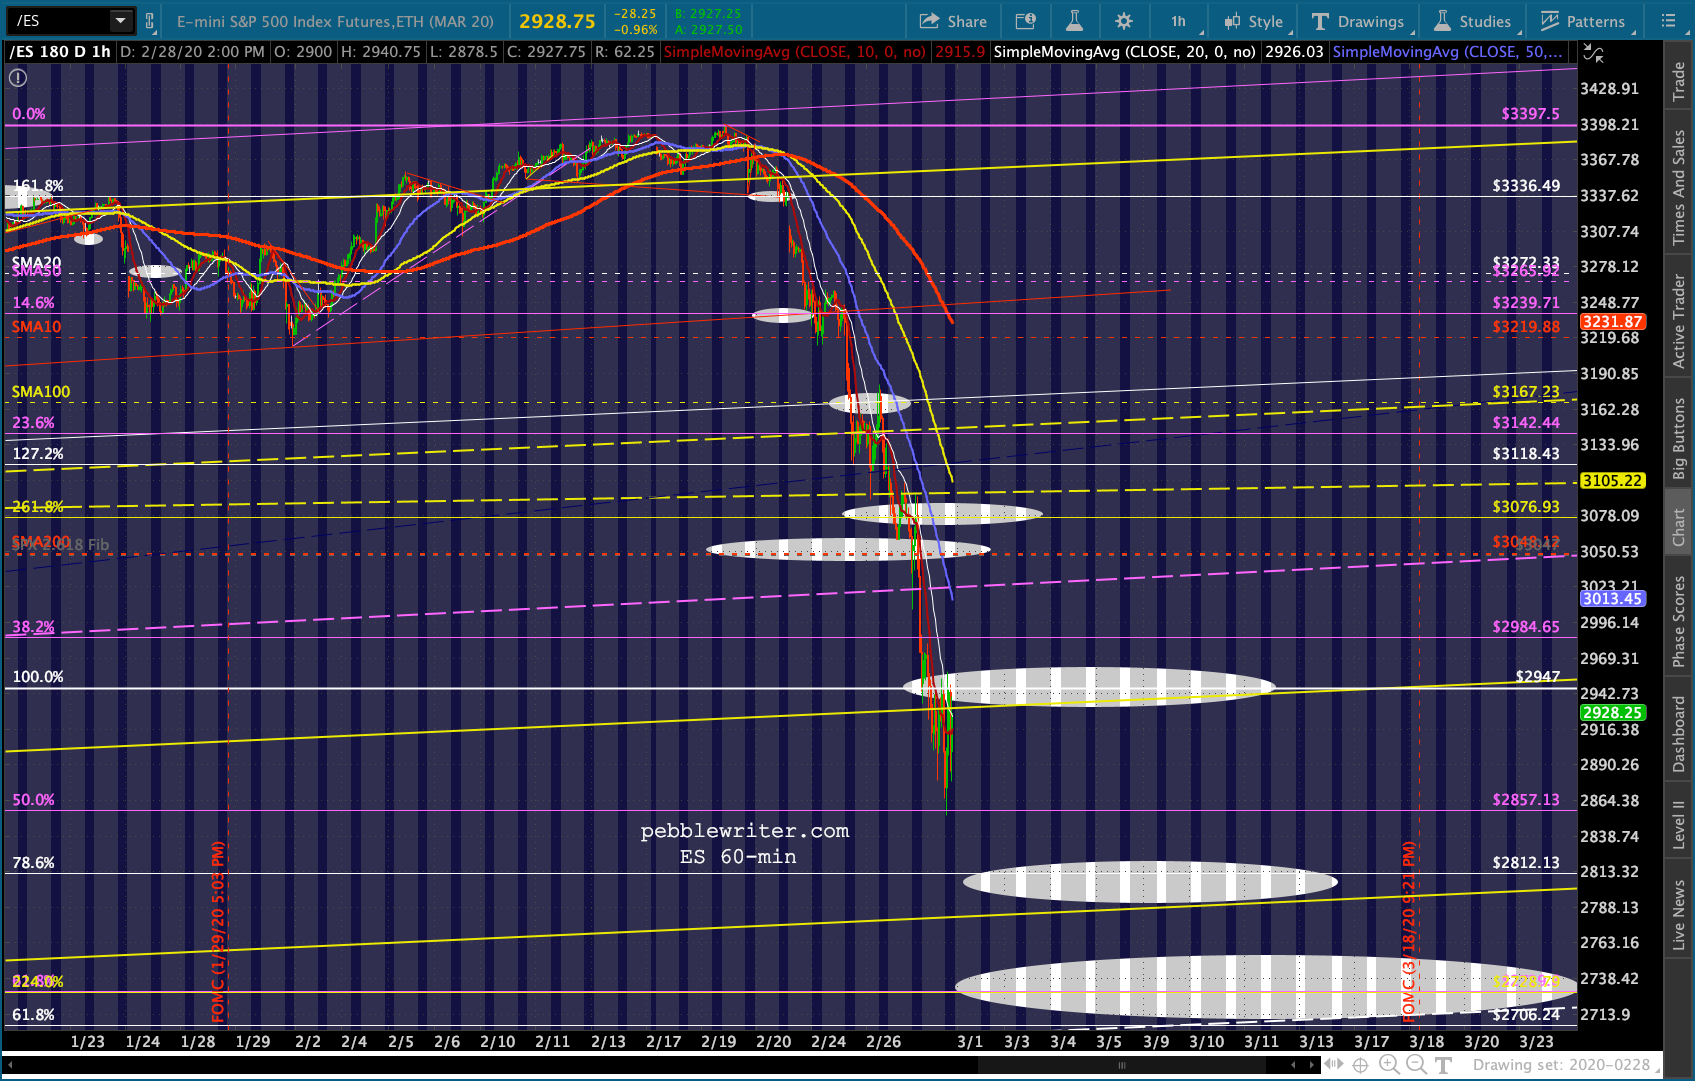
 Very troubling for the bulls…
  Indicative of a lack of interest in saving the market…at least yet.
  If the purple channel breaks down to, watch for TS2HTF.
  More after the close…
UPDATE: 18:30
I have much to post this weekend, but wanted to get this out there before I forget (started at 4AM this morning – yay, post-op knee pain!)
ES and SPX both closed back above those previous highs, but the lower targets still make sense. Consider that many past corrections were almost exactly 20% peak to trough.
I’ve posted this chart many times showing the effect on stocks of the 2Y dropping through significant trend line or horizontal support. We just had another incident where the 2Y dropped through significant support at 1.4%. I’ve been carping about it for a week or more. Here’s the closeup of the above chart.
  Since very little happens (is allowed to happen) in the markets without some sort of plan, isn’t it interesting that a 20% drop from their recent all-time highs would produce ES 2718 and SPX 2714.82.
Remember, the 2.24 extensions I’m obsessed with are at ES 2728.79 and SPX 2703.62 – exactly 19.68% and 20.33%. Pretty darn close for a coincidence, right?
Also, remember that ES’ 2.24 of 2728.79 is less than 1 point away from its .618 retracement of the rise from 2316.75 (Dec 2018 lows) to the 3397.50 highs. I’ve been doing this long enough to recognize that there’s no chart in the world, no matter how brilliant or beautiful, that a presidential tweet or Fed interview couldn’t turn it into a steaming pile of shit. But, this one makes an awful lot of sense.
GLTA.
Comments
One response to “Stocks: Taking a Stand”
I realize your plate if full, but if you can squeeze in a comment of your current view on gold, it would be much appreciated.