

By crushing volatility in the wake of yesterday’s record-setting CPI print, the Fed might have convinced some investors that spiking inflation isn’t a problem – even if it’s not transitory. The charts — and the math — suggest they might become skeptical again very soon.
The departure of CPI from the gasoline delta curve illustrates how inflation is no longer just an oil/gas problem – and thus wouldn’t be “fixed” by a modest decline or leveling off of oil/gas prices.
 Can the algos be convinced to ignore both the math and the charts?
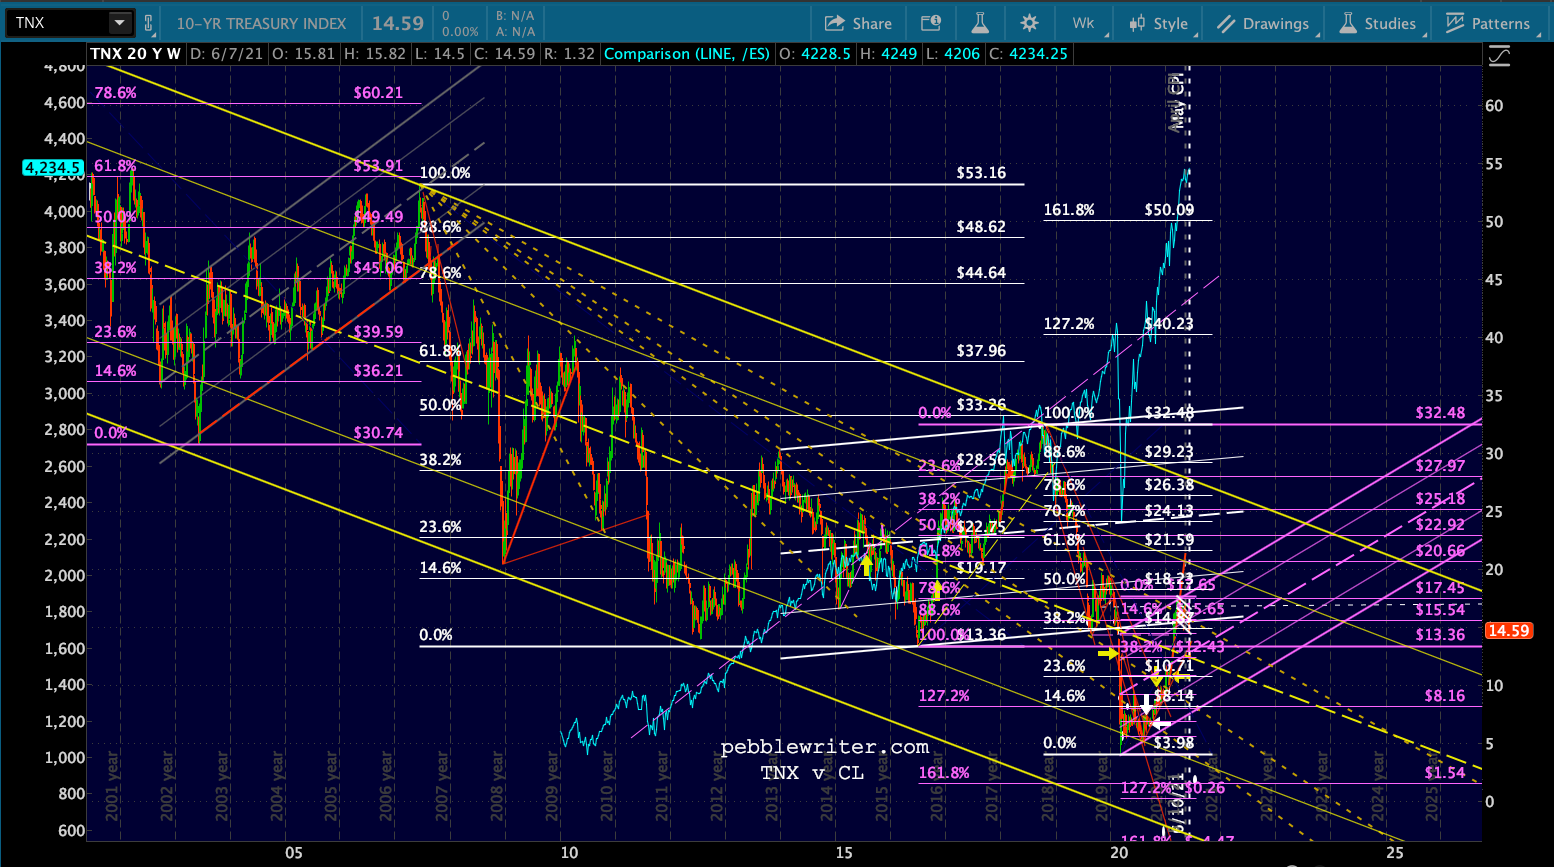
 The 10Y has nearly reached the downside target we’ve maintained for the past couple of months, but would the algos ignore a breakdown? It seems unlikely.
 Of course, there’s a fundamental argument as well. The biggest risk to rising inflation as far as the markets are concerned is higher interest rates. By crushing rates (and shorts) at a time when they would normally be spiking higher, the Fed has seemingly eliminated that threat.
Higher inflation will be hard on working stiffs across the country, of course. Higher car prices, gas, rent, food…the people the Fed swears it cares the most about are the least capable of absorbing these expenses – transitory or not. Unfortunately, the market could care less
continued for members…
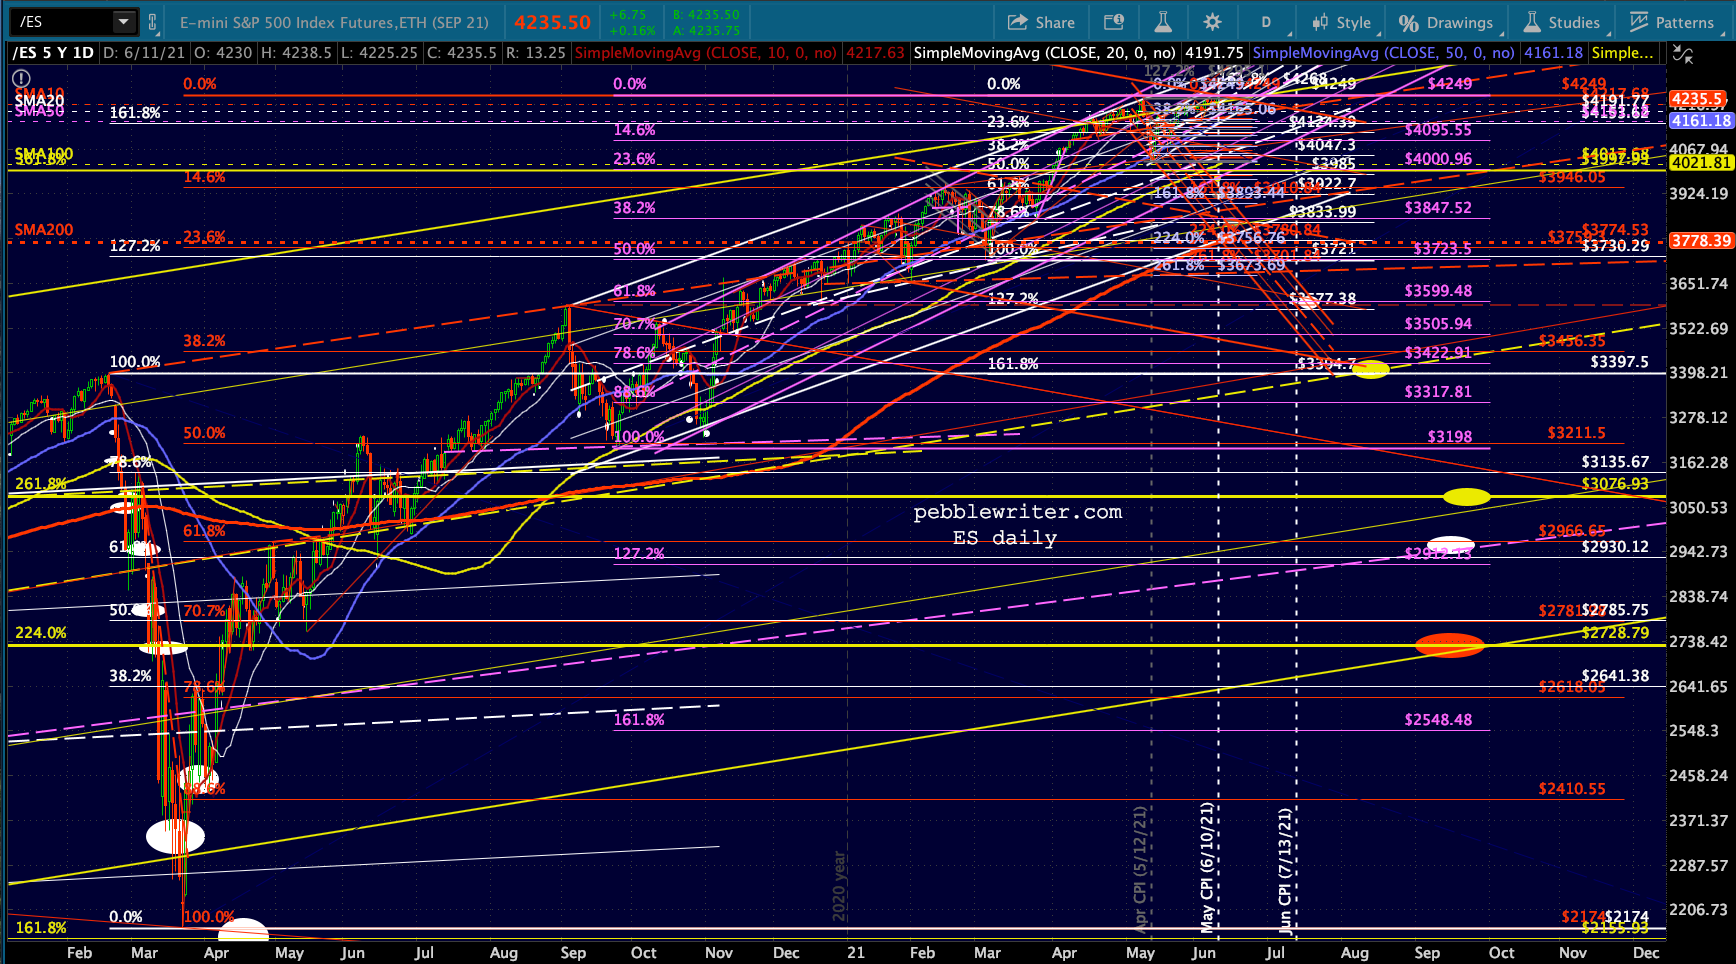
The big picture remains unchanged, but still hinges largely on VIX and USDJPY. A higher high could change the outlook.
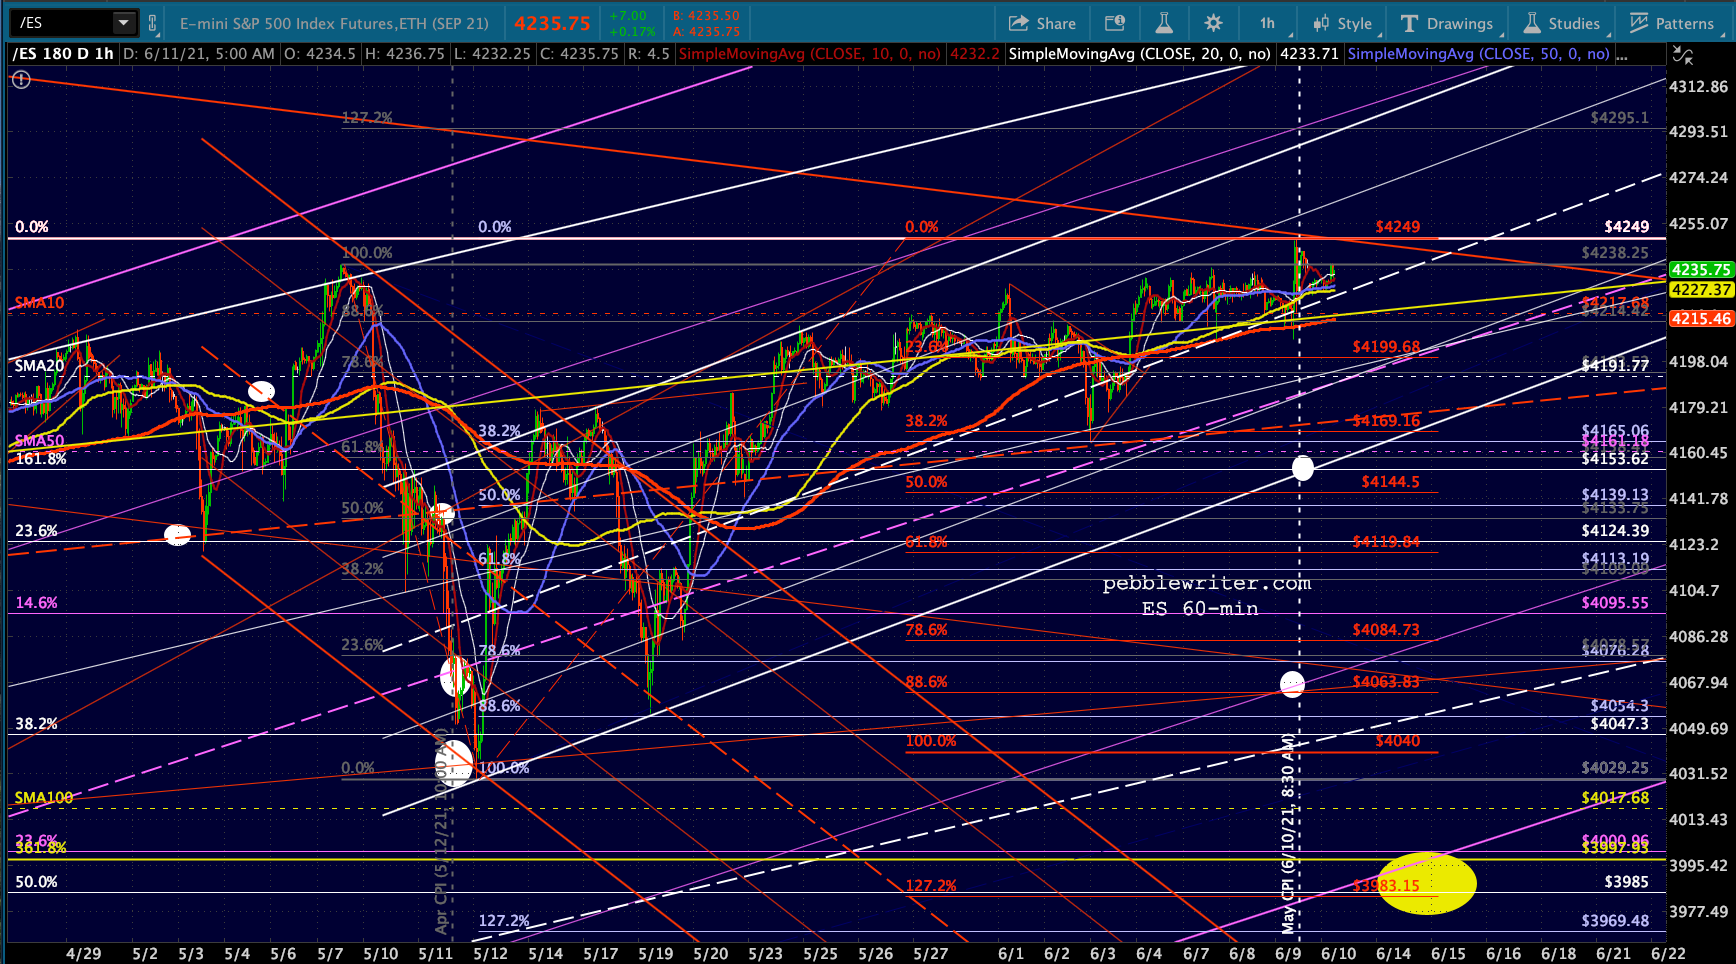

 Note that weekly ES RSI is back to the top of its falling white channel with massive negative divergence.
 It has reached TL resistance on the daily RSI as well, again with significant negative divergence.
  Although we’ve said this before – quite prematurely – oil/gas ramp job has seemingly run out of room. CL has pushed above the .886 retracement…
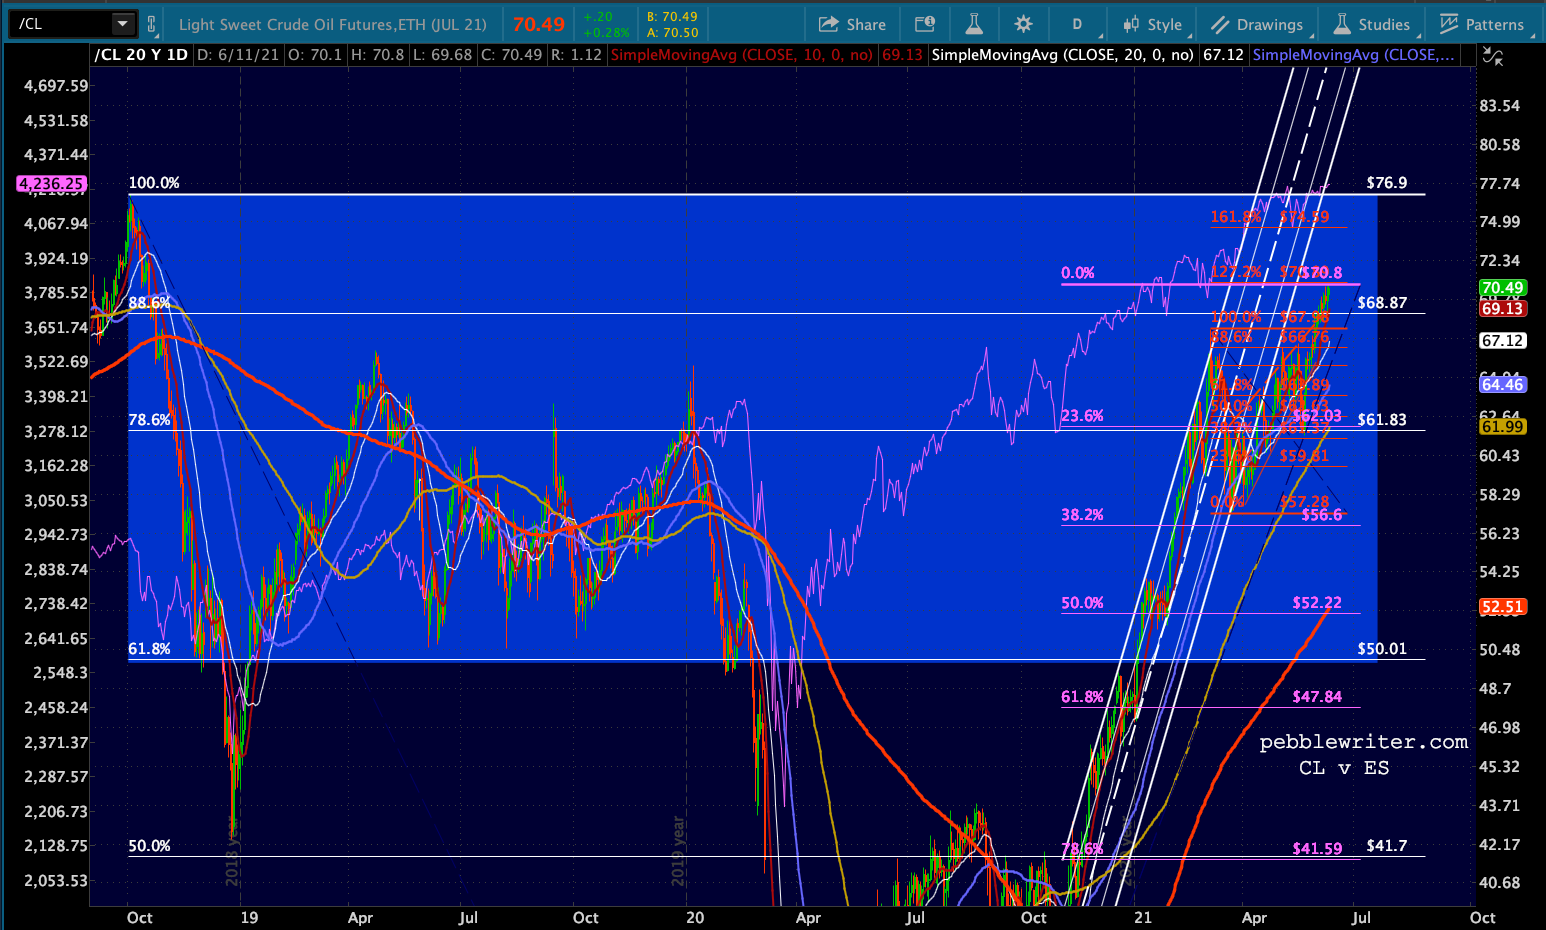
 …but it is now overbought on negative divergence. Every single time it has tagged the overbought 70 mark it has corrected at least a few percent.
 RB is in a similar position. Though not as overbought, even as it tests its 2018 highs…
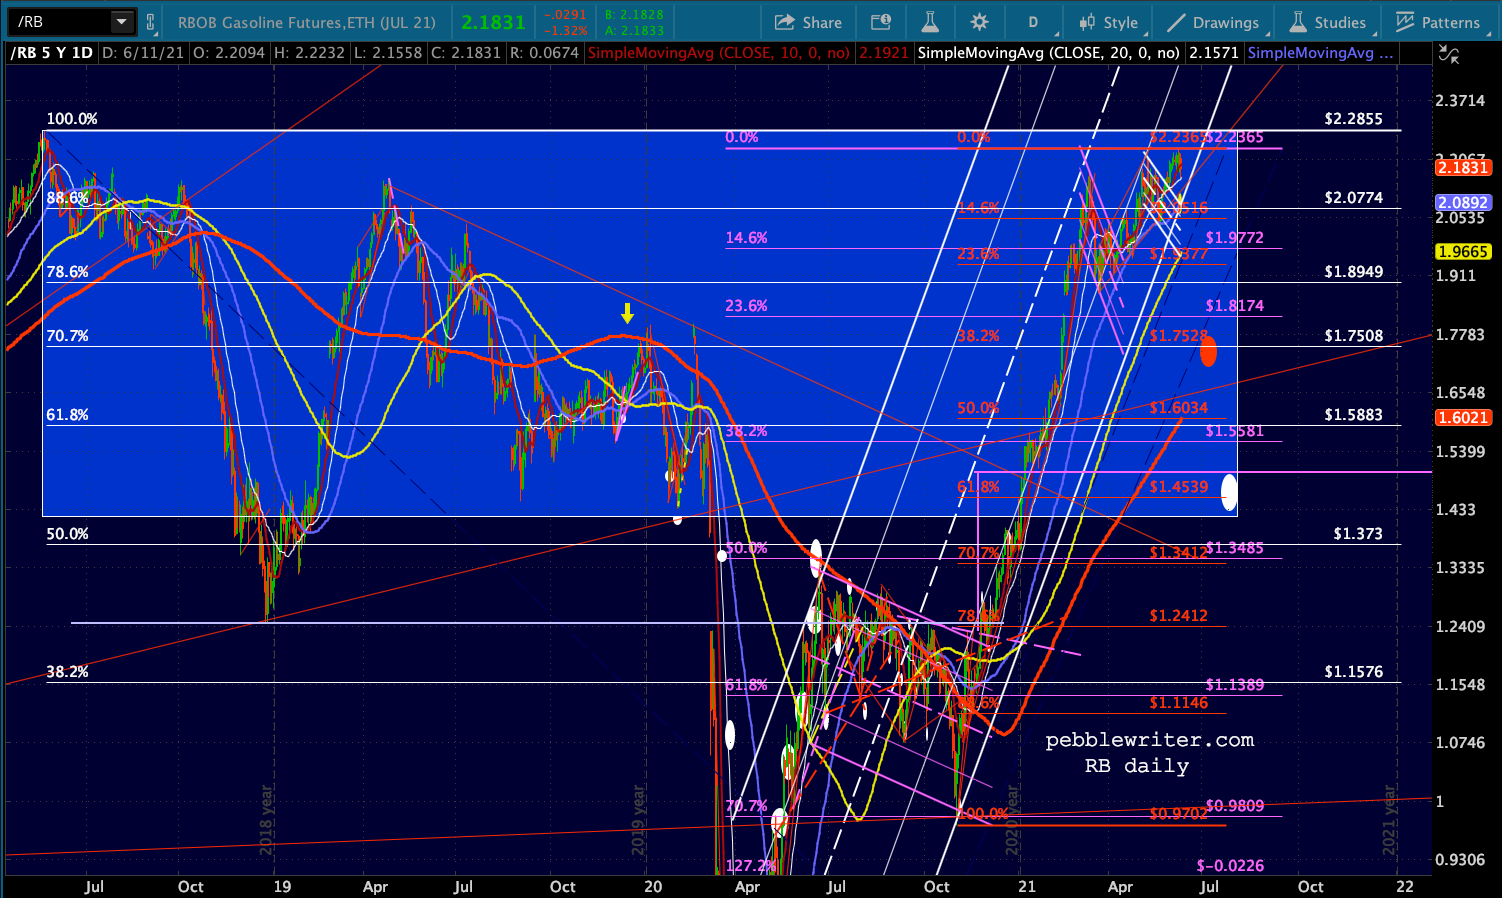 …it has even more striking negative divergence and RSI faces a TL test right here.
 So, we have to ask ourselves whether TPTB would push prices higher after a 5% CPI print. I think not.
Data available from the Fed indicates that a stealth tapering has already begun. Once that cat is out of the bag – in the next few days – 10Y rates could well bounce off the rising red TL and/or yellow channel midline.
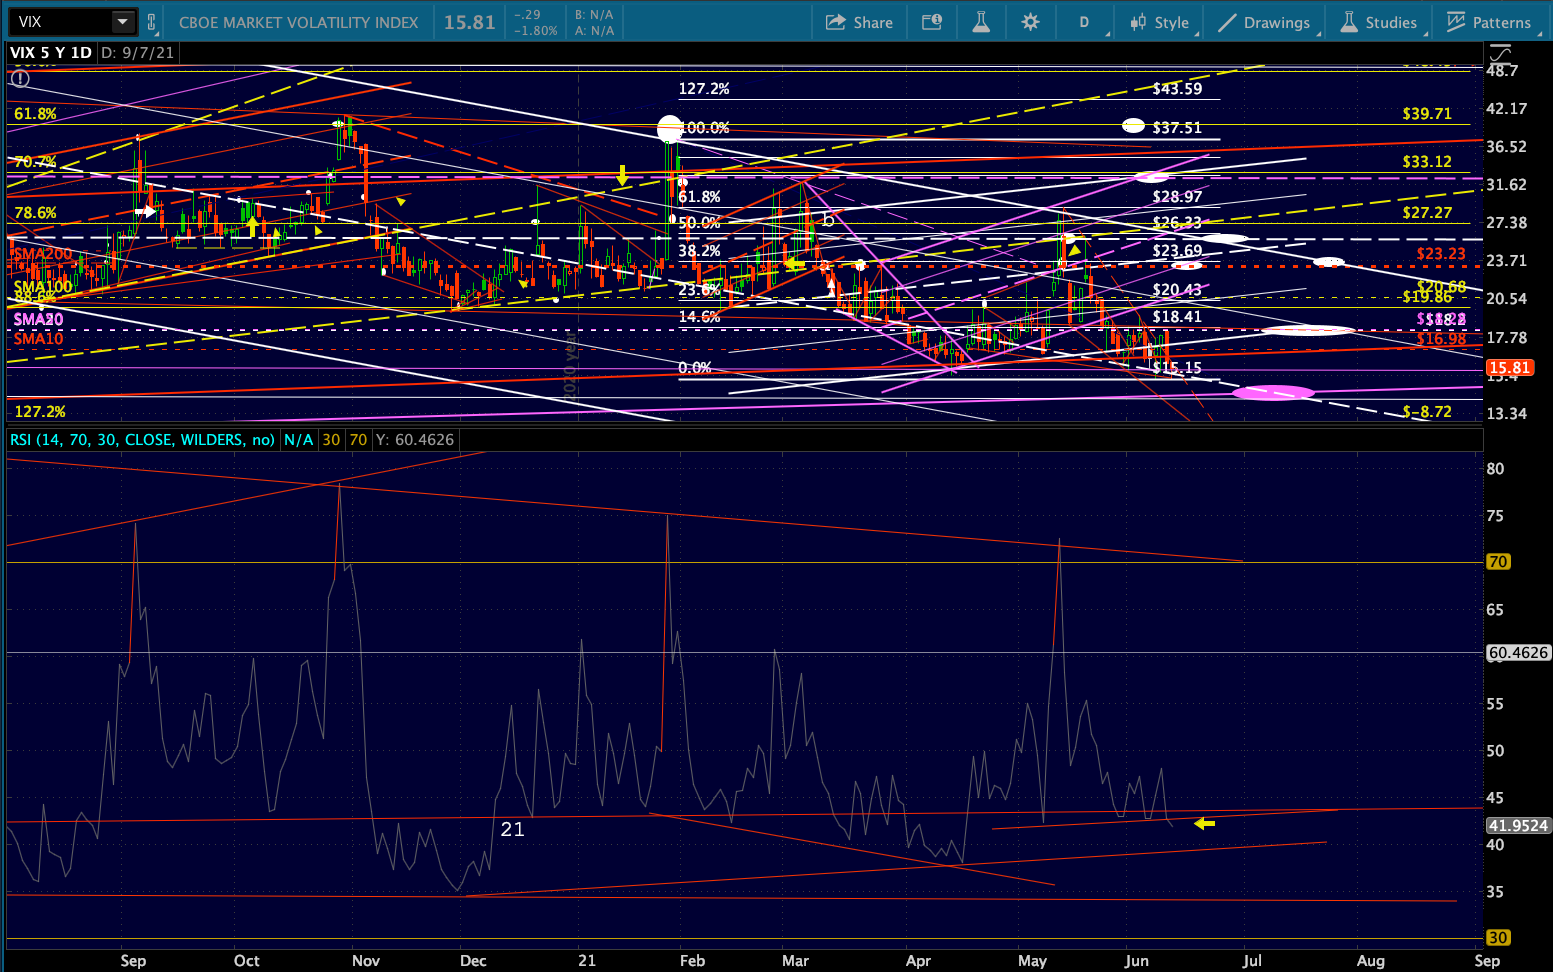
 If CL and RB finally back off, what could keep stocks from following suit? VIX has been doing a great job, with the purple TL currently around 14.3 as a potential breakdown target.
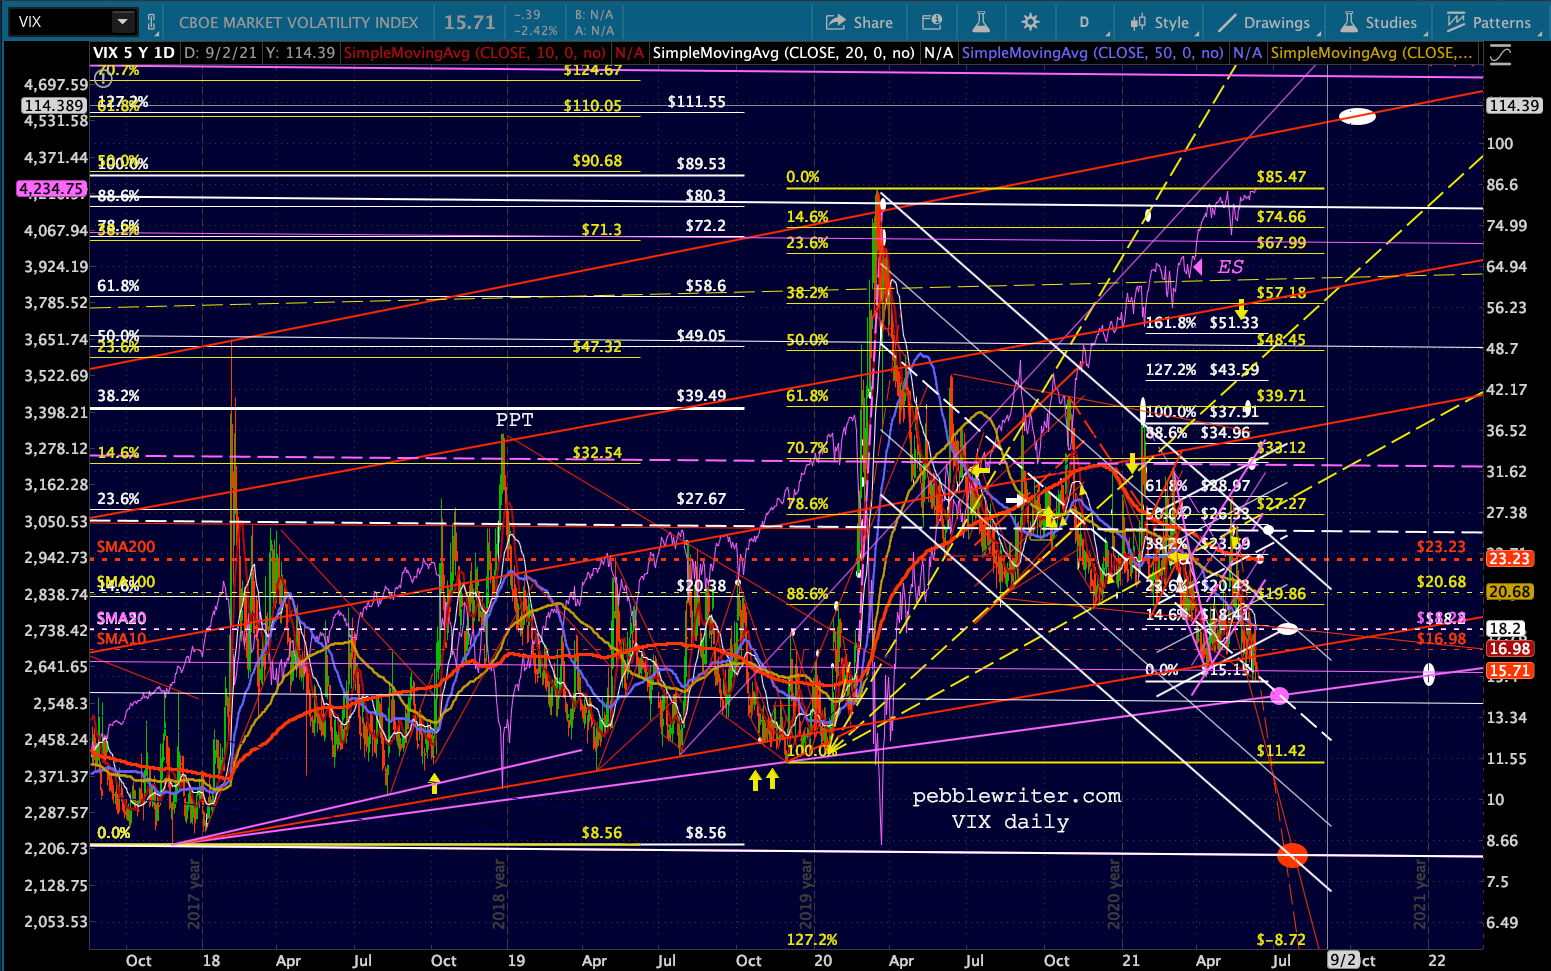
 At this morning’s low of 15.15, it was threatening an RSI breakdown as well.
 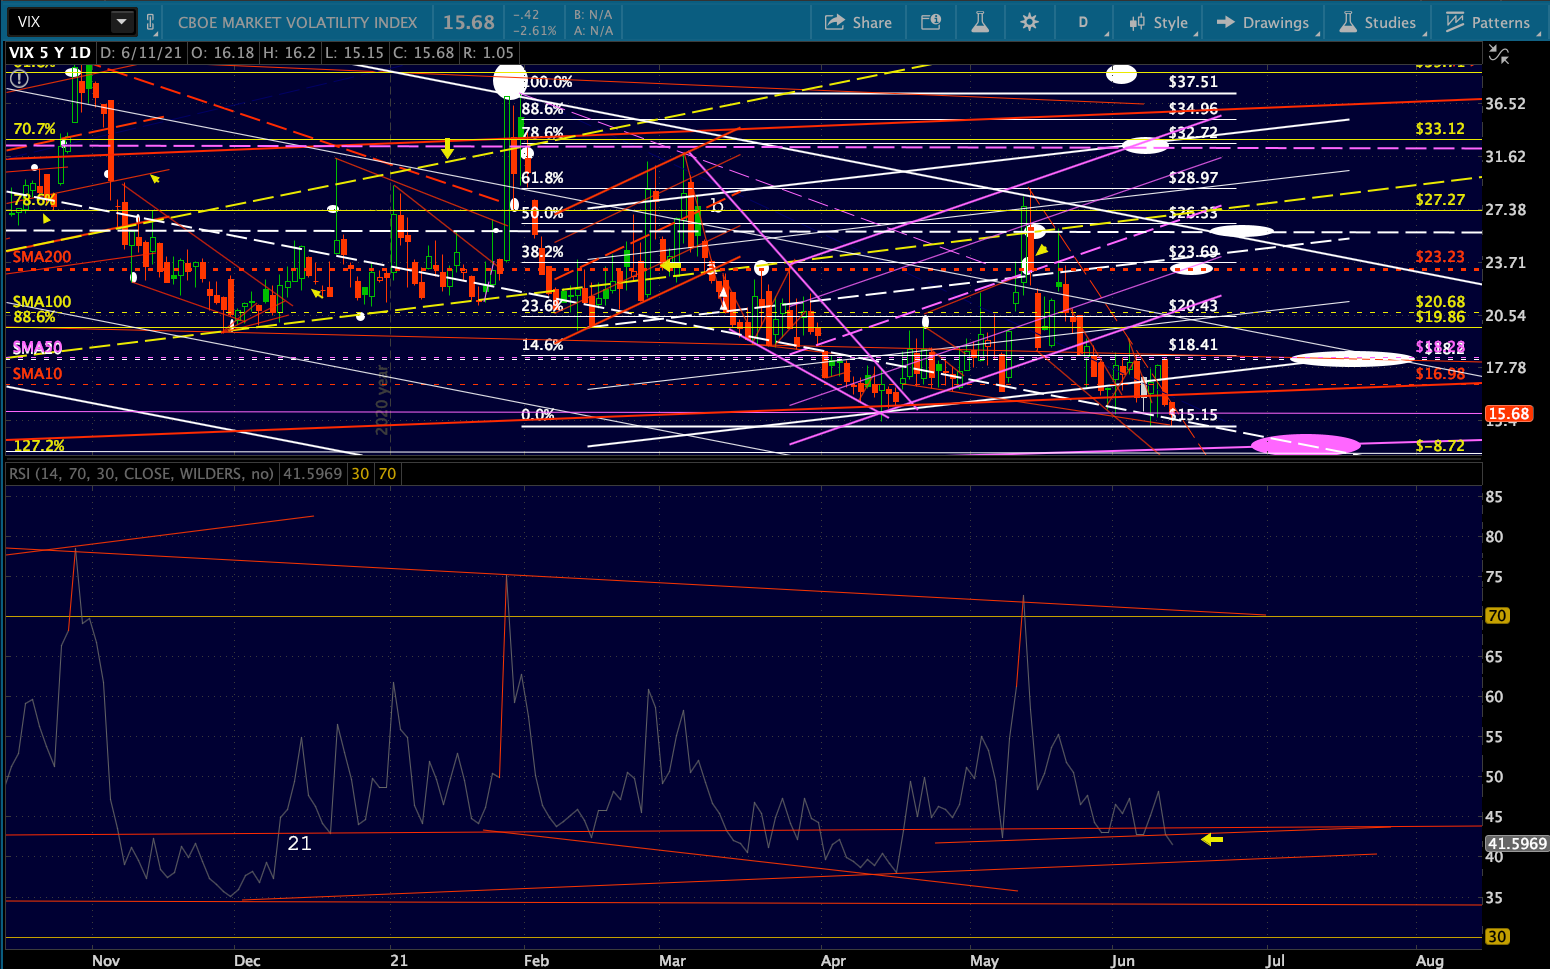 In addition to VIX, USDJPY remains a legitimate threat to bears. The ongoing refusal (at least so far) to reverse at the top of the falling purple channel and below the red TL means it could be breaking out. This has been the case since mid-March, and the algos are eating it up.
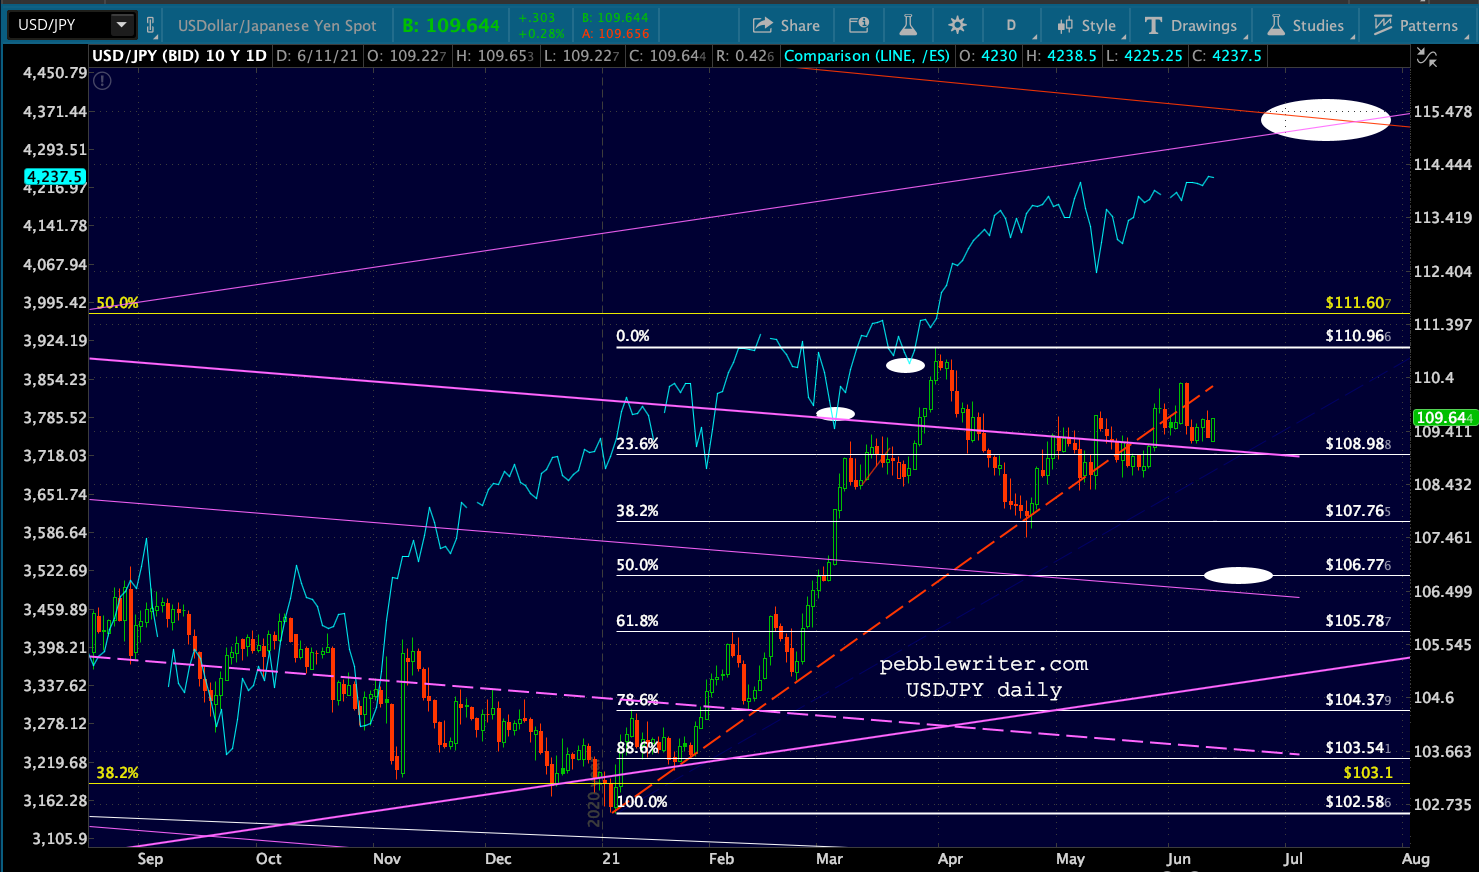 It it breaks out of the purple channel, there are a number of other breakouts that await it not much higher.
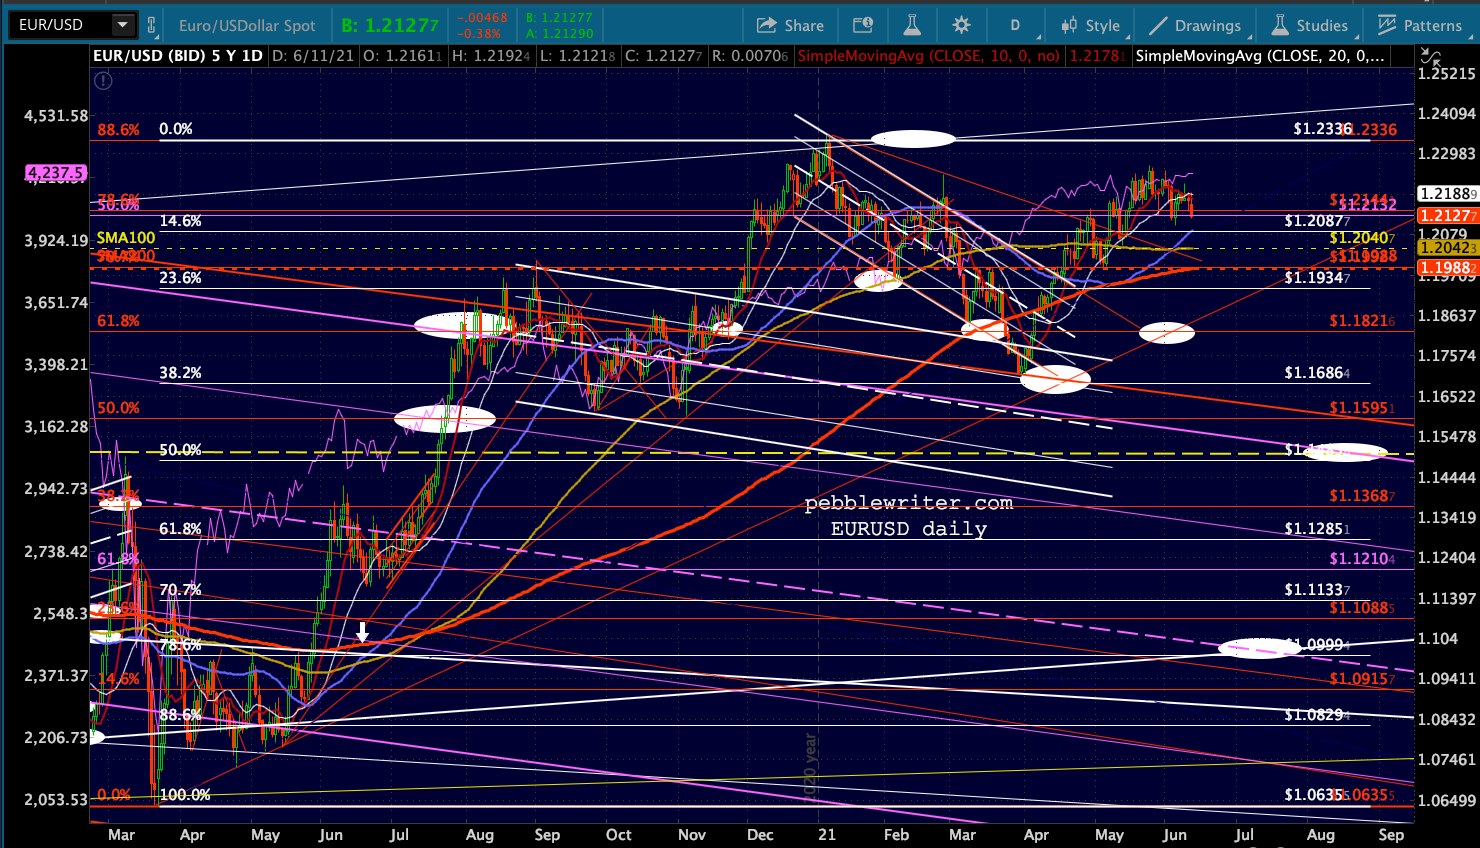
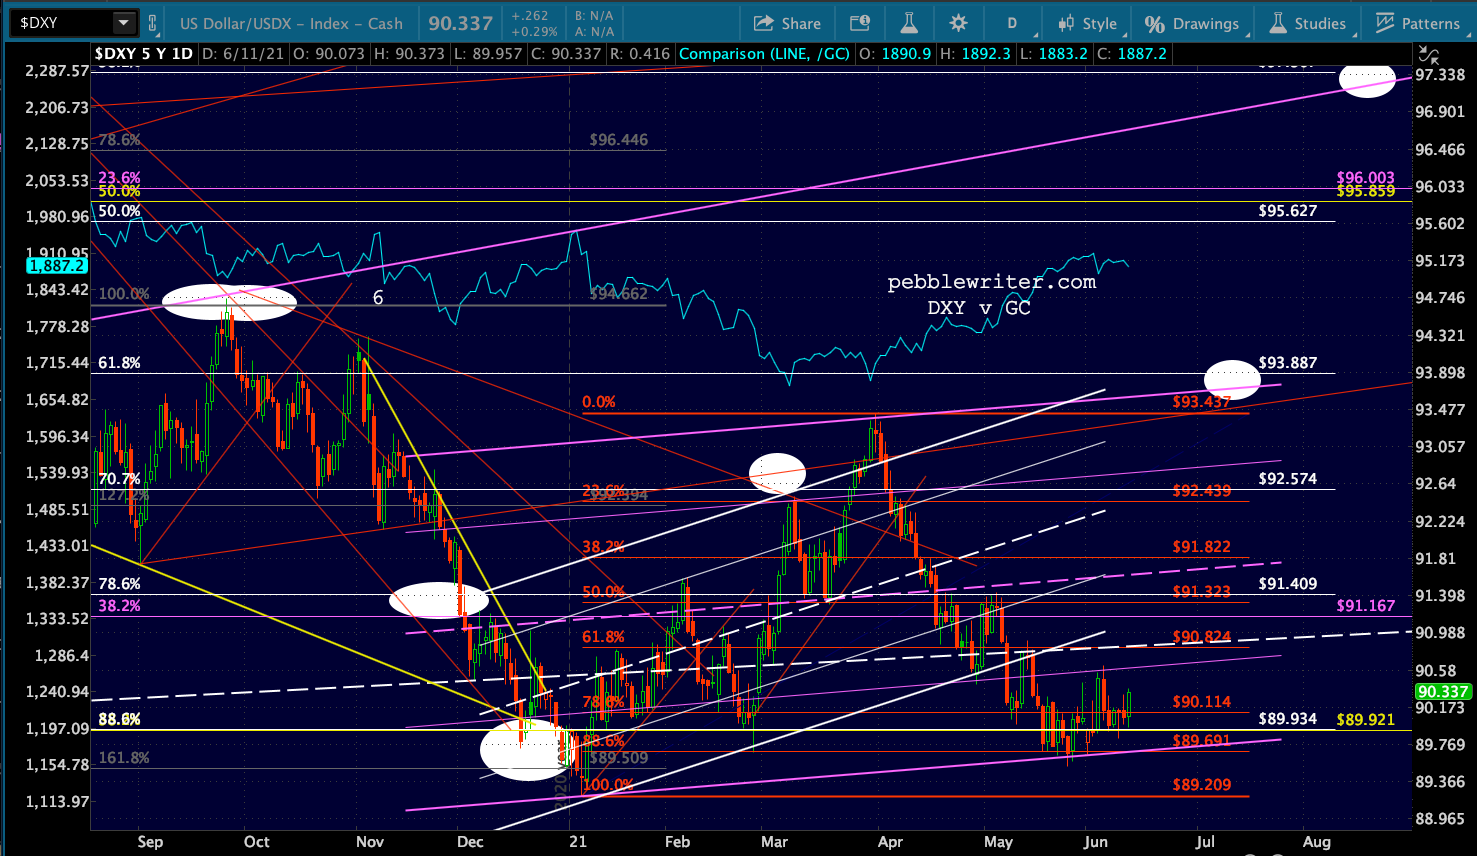
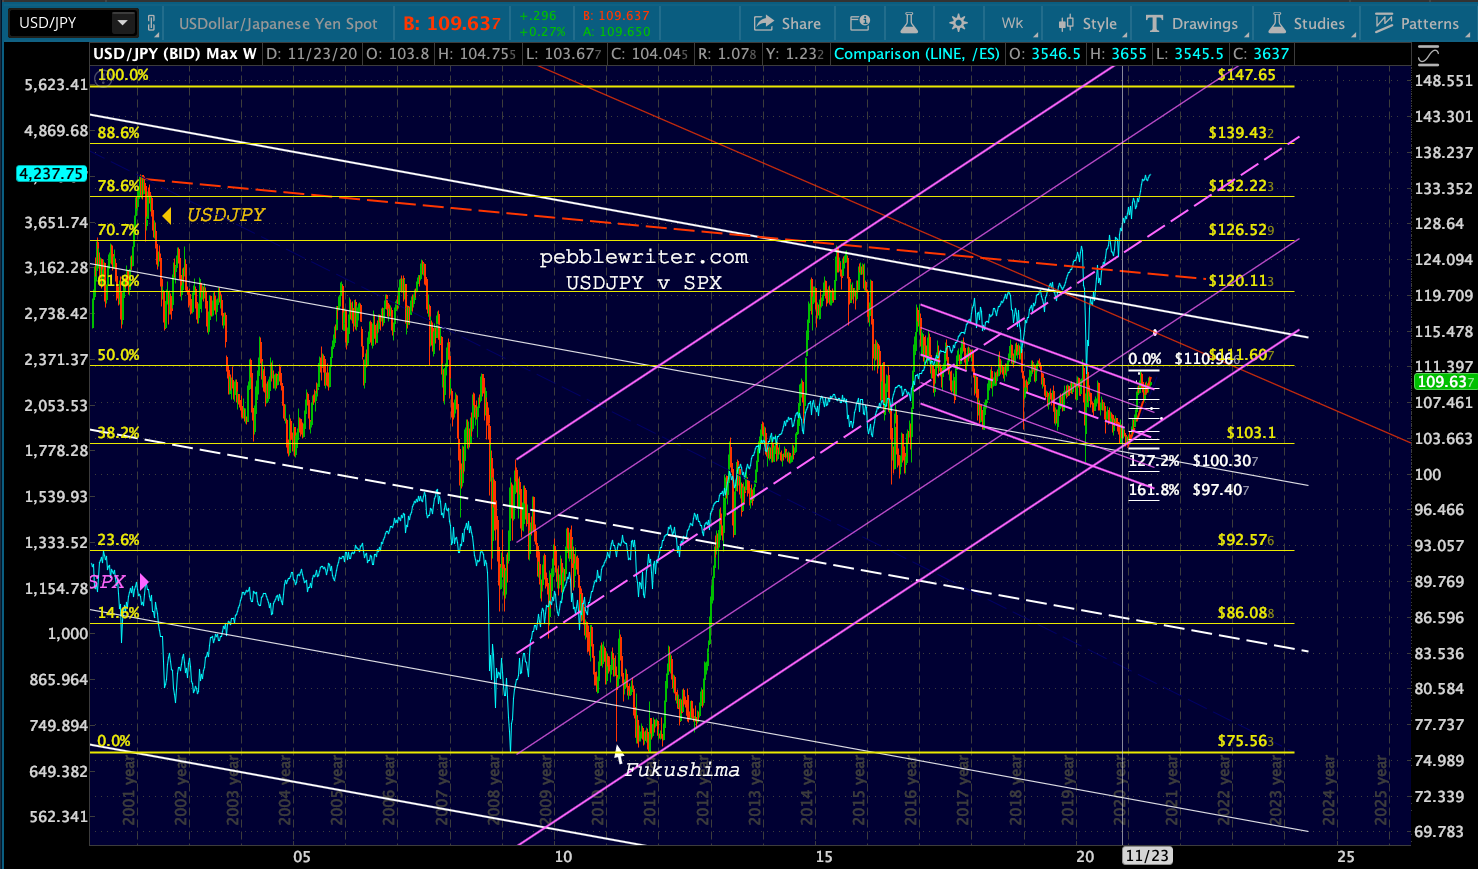 DXY is revving up again, mostly due to EURUSD’s decision to finally backtest something – the SMA200 or the rising red TL?
 This is a very complex setup, with lots of moving pieces and conflicting agendas. But, if the bond market remains broken, keeping stocks on the rise in the future will be much easier. If bond investors come to their senses or simply overpower the Fed’s efforts, then it will be much more difficult.
The leveling off of stock prices continues to suggest a backtest is right around the corner. Whether it’s the 6% or 12% variety remains very difficult to say.
More later.
UPDATE: 3:40 PM
Coming up on the close, and it’s been another go-nowhere day. Of the charts we looked at earlier, the more promising from a bearish standpoing are shown below.
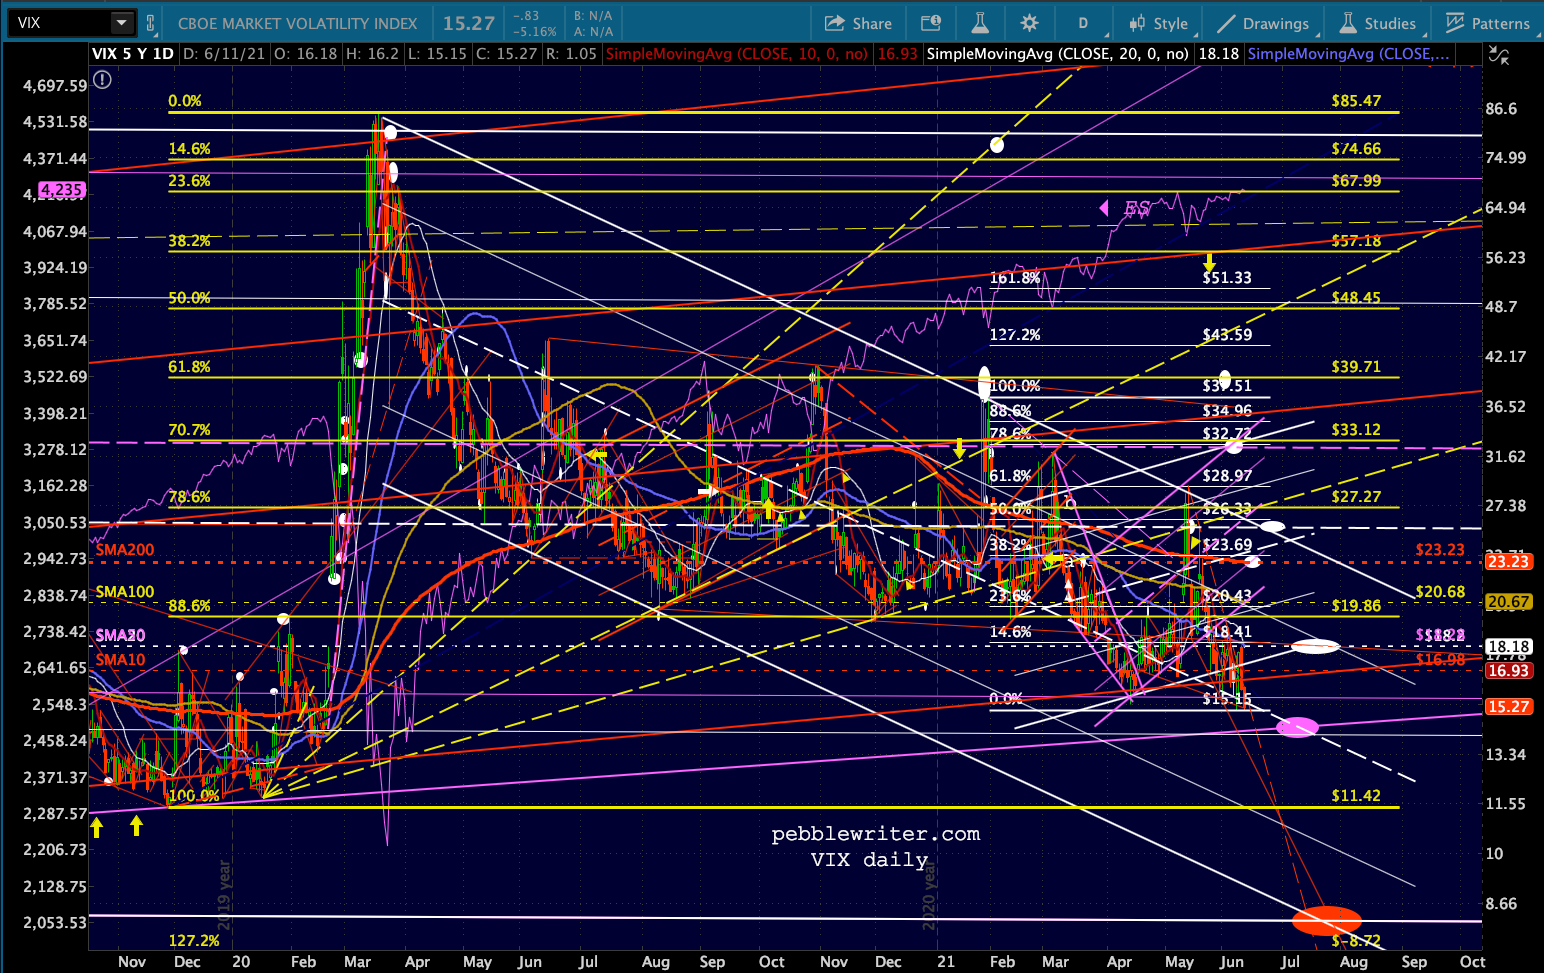
VIX’s RSI hasn’t give up on a breakdown just yet…
 …but SPX has put together a nice little rising wedge…
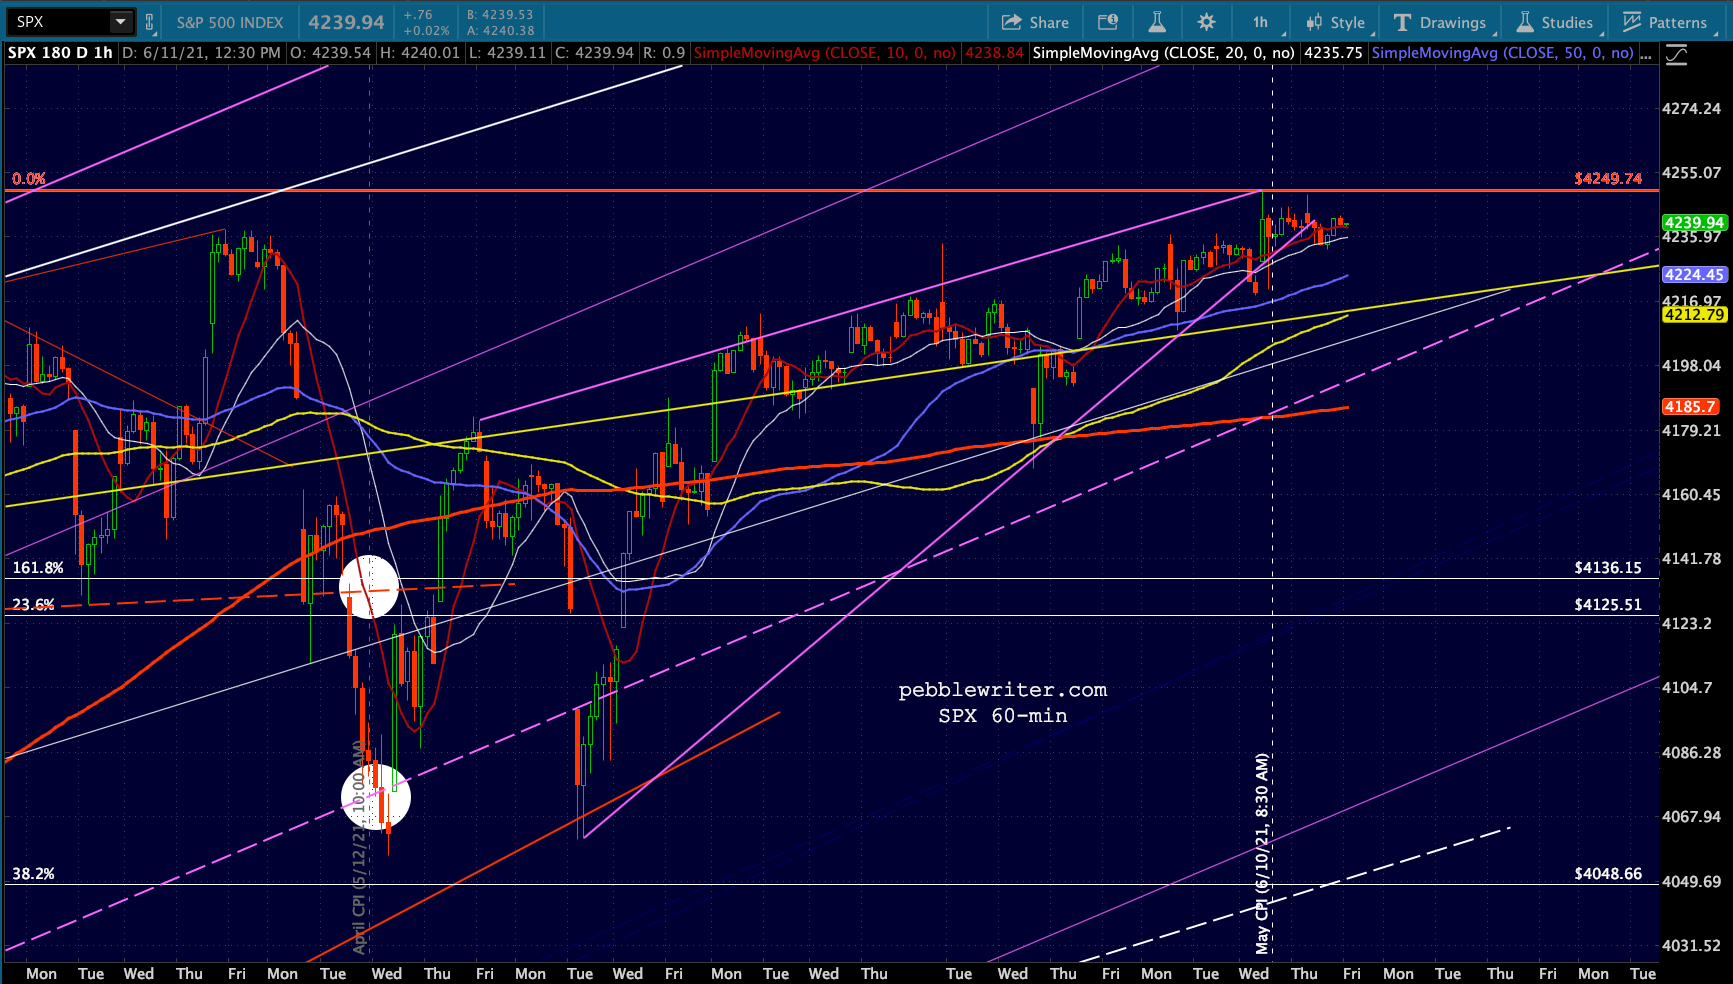 …and its SMA200 is almost to the white .886.
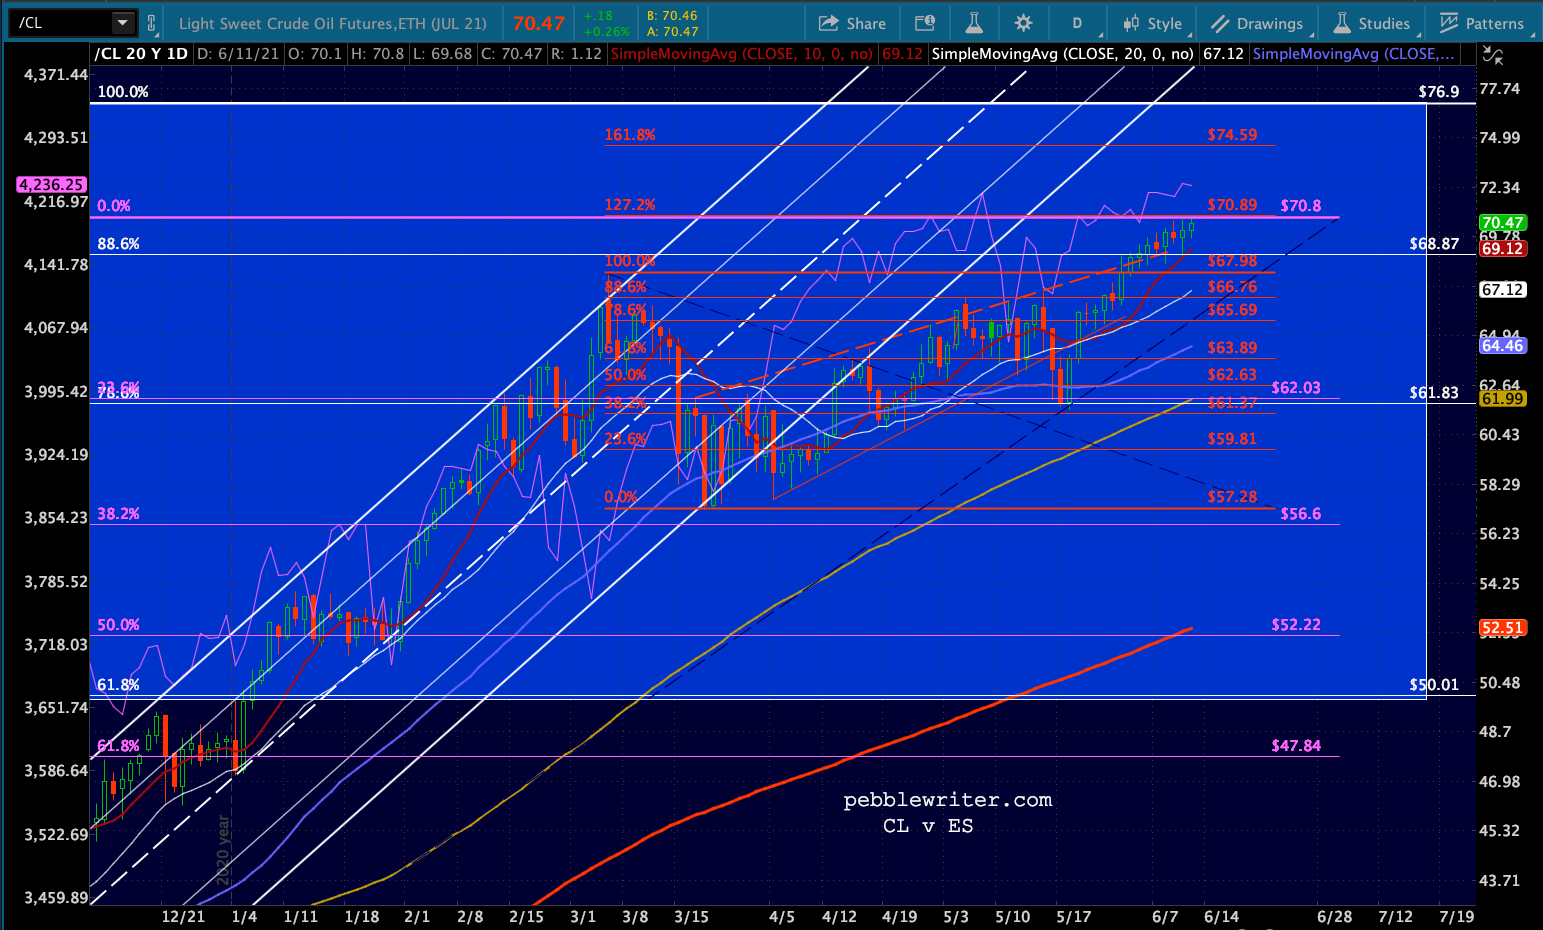
  CL has a nice little rising wedge going too.
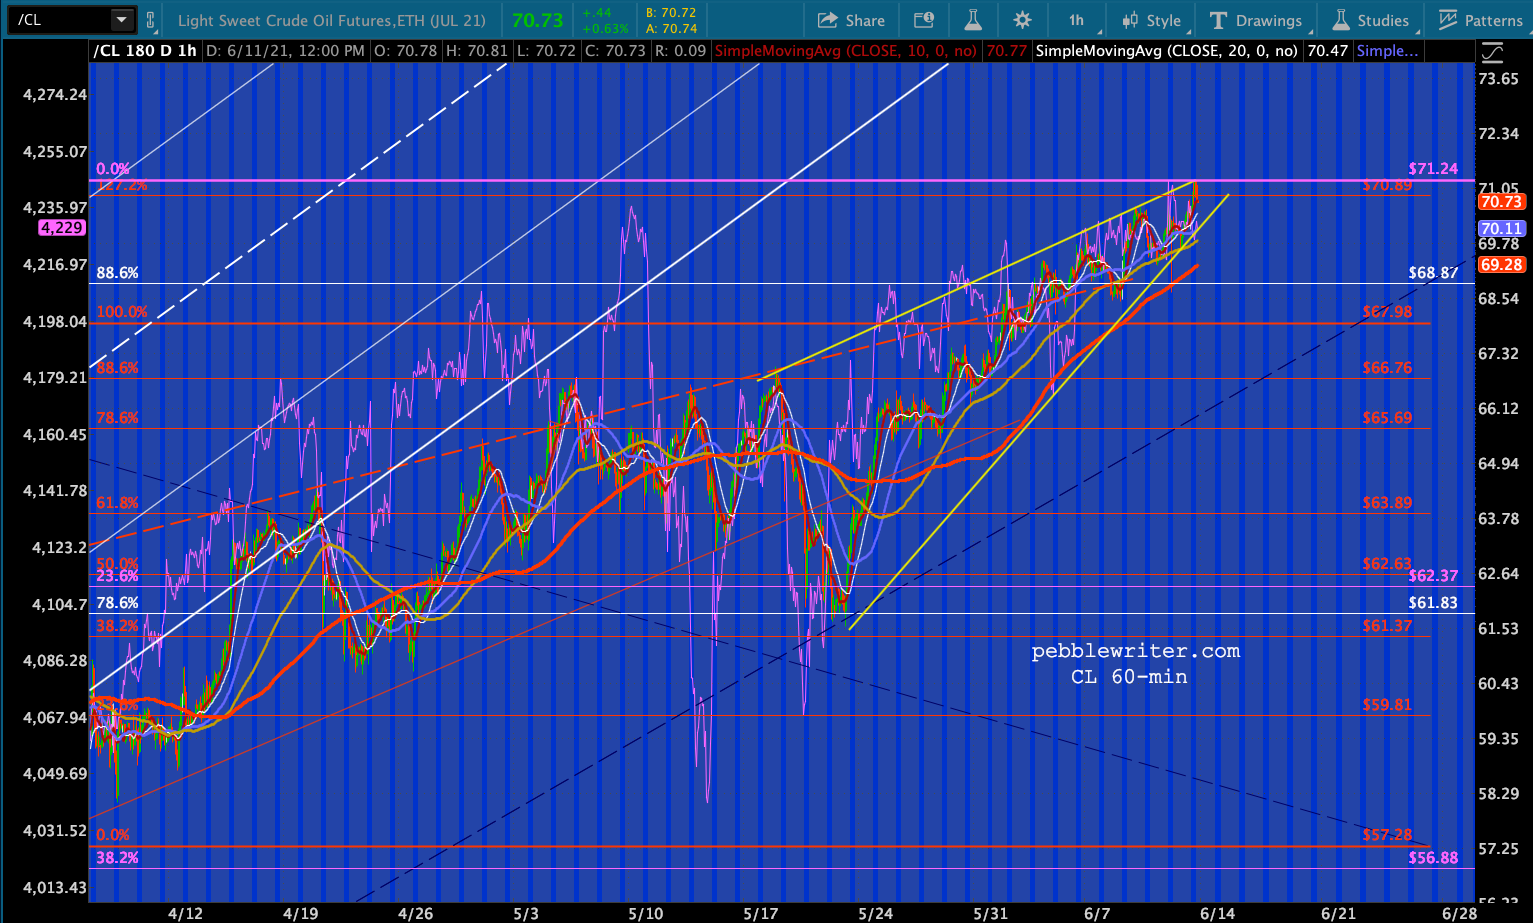 And, FWIW, DJIA is back below its 3.618.