

At least that’s what RSP, the equal weighted S&P 500 ETF, is saying. It has finally reached the top of the same channel that marked the Oct 2007 top and the Jan 2018 top.  It should also reach, on the open, the 1.272 Fib extension of its drop from Feb 2020.
  And, it’s doing this on negative divergence with RSI having also run into overhead resistance.
  Granted, it’s not the S&P 500, which has pulled away from it on a number of occasions on the strength of the nifty 5-6 mega-caps. But, value has caught up with growth and things are downright frothy at the moment. I’m not sure this is what the Fed had in mind…
RSP’s channel is a stern warning that should not be ignored – especially on a day when we are reminded once again that the virus is not being dealt with effectively and unemployment is going in the wrong direction. BTW, the nearest exit…
continued for members…
The rest of the charts…
Here’s the one that continues to matter the most. If VIX breaks down from it’s falling channel, all bearish bets are off – at least for now.

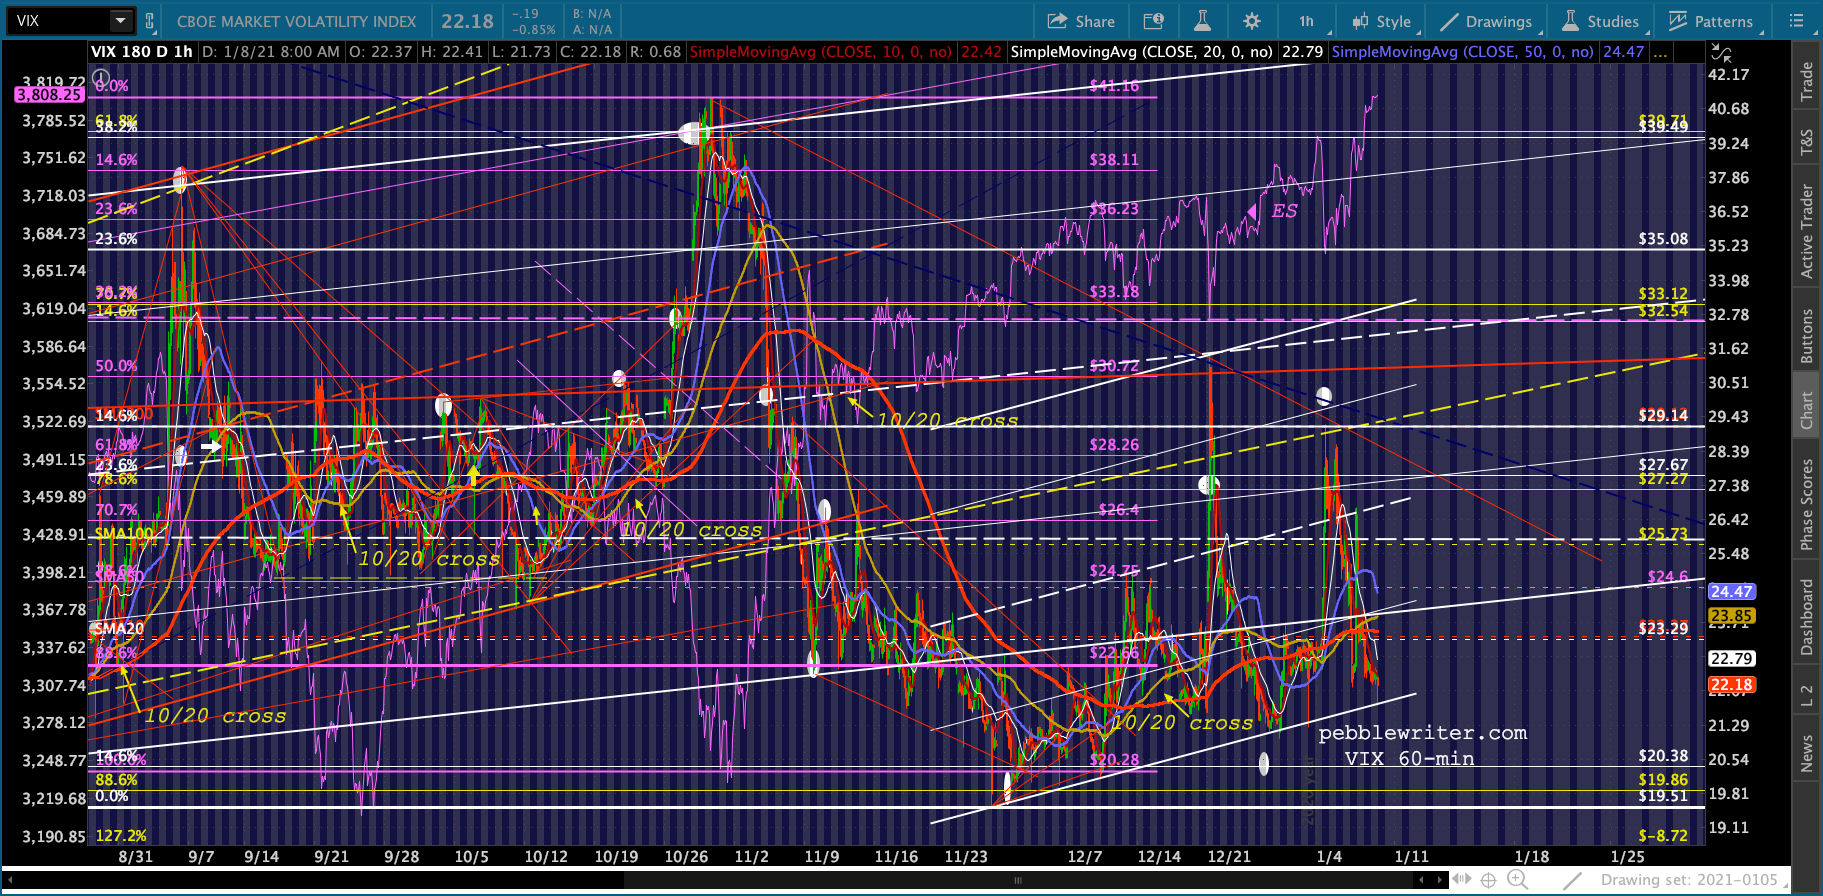 The view from ES’s standpoint:
The SMA200 has reached the yellow channel midline – a frequent point to which stocks have dropped since the March lows. 
 DXY’s situation hasn’t changed – still being held under 89.934 even as EURUSD stalls and USDJPY reversed at its SMA50. It feels to me more like coiling for a reversal than further breakdown.
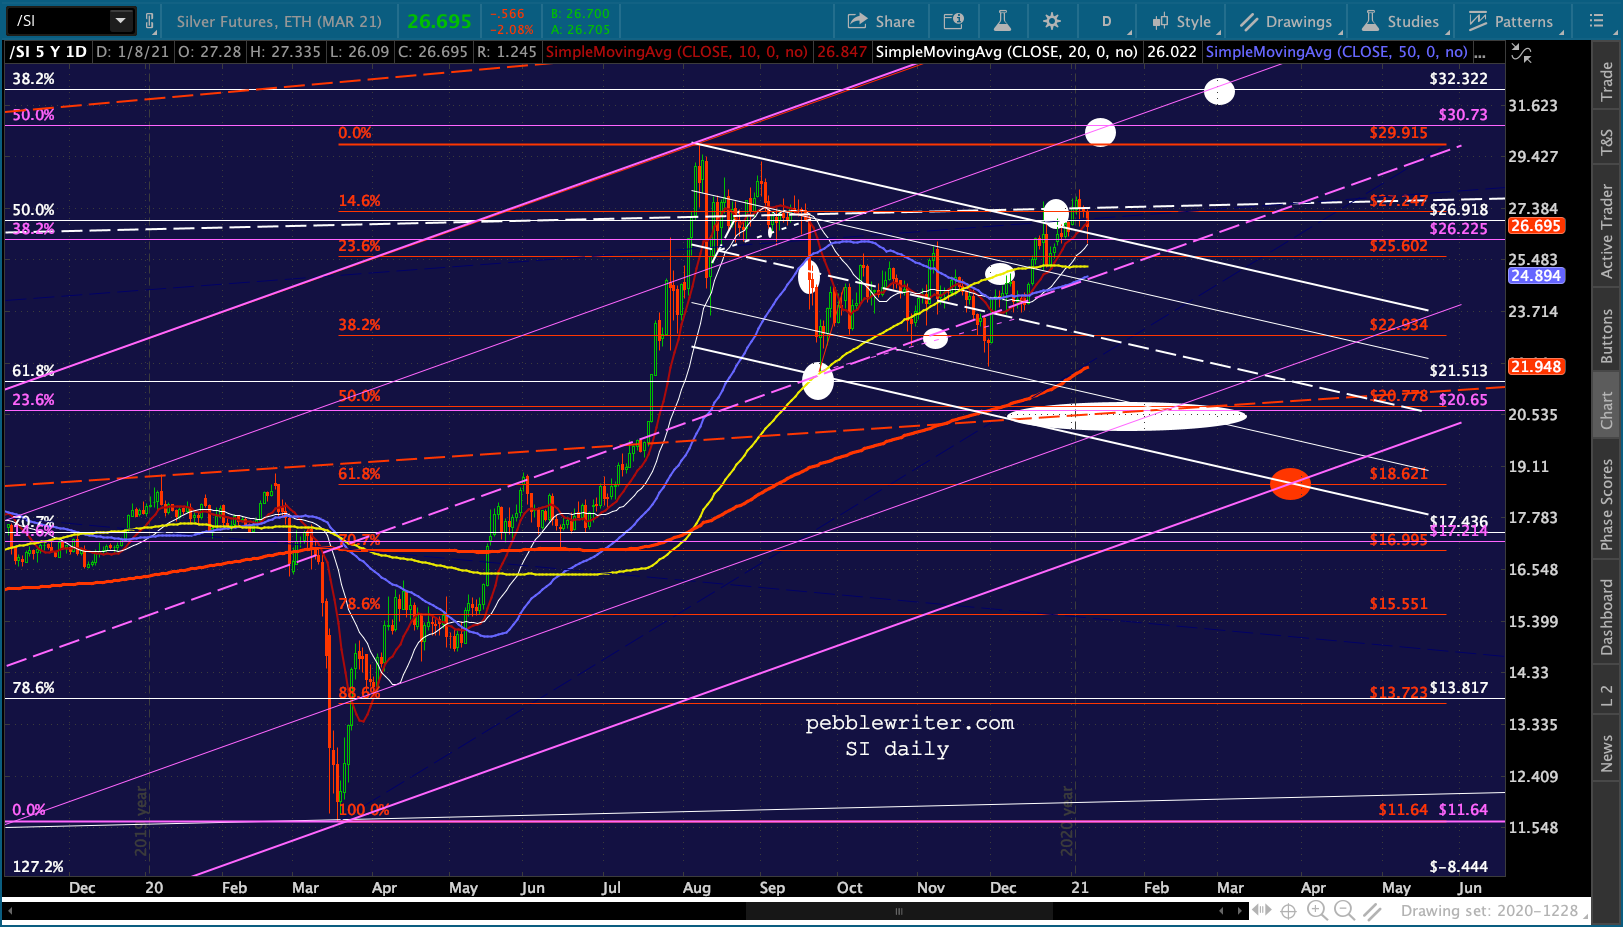
 The SMA50 (purple line) has held many times before, and reversals off it have at times led to big equity reversals.
 Note that GC and Si are faltering. For now, they’re backtesting the channels they broke out of. A drop back into the channels would be very damaging.
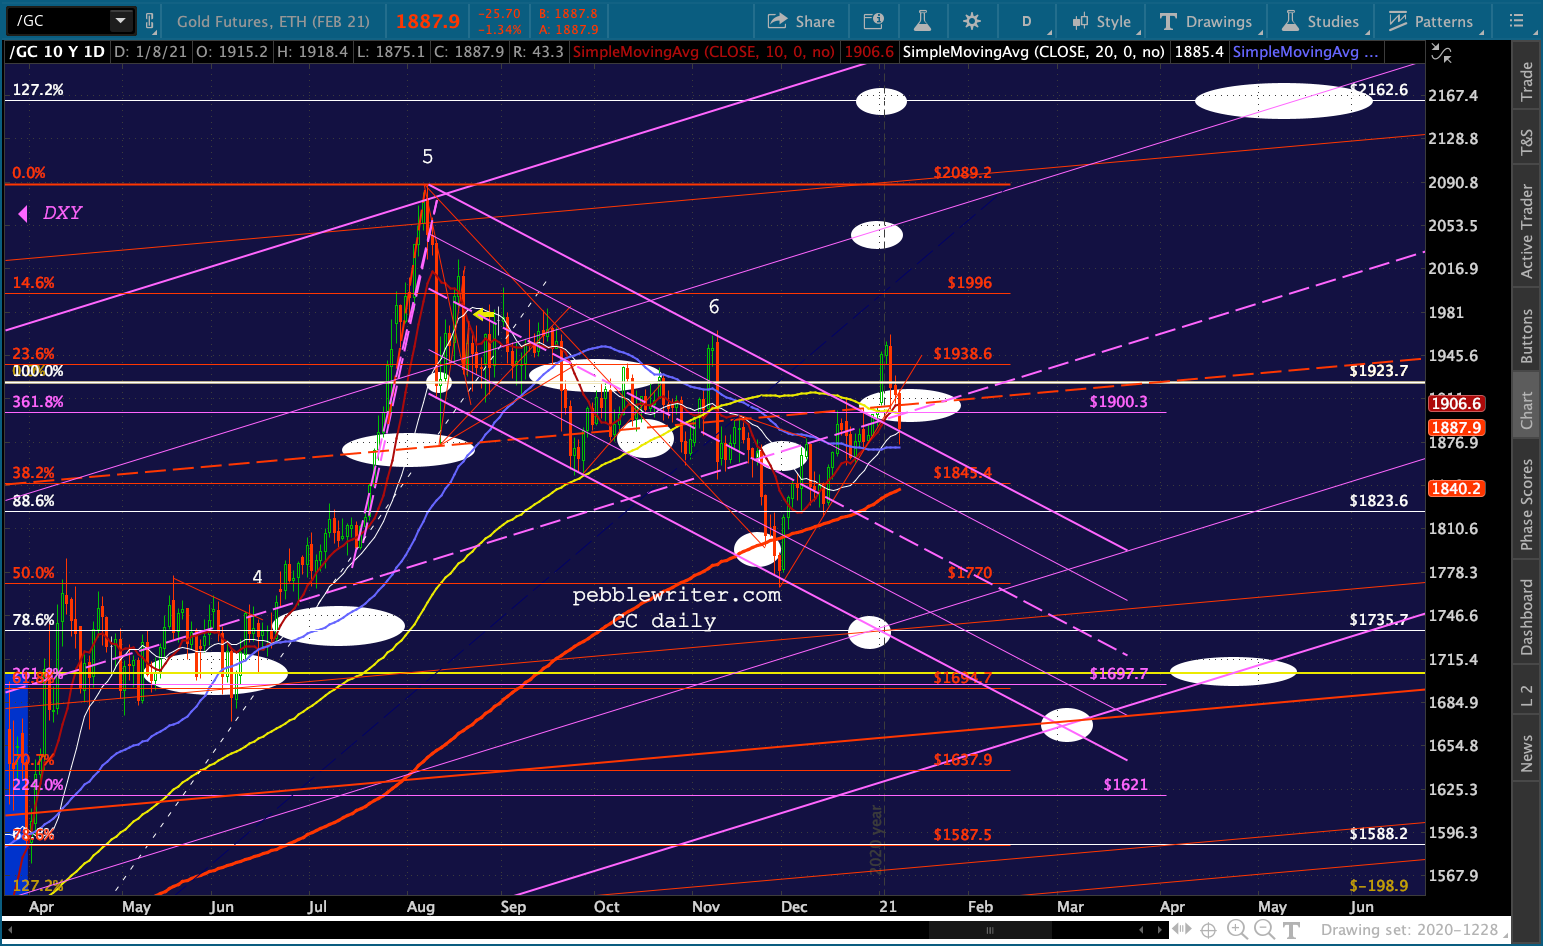
 The rise in 10Y yields has been an important factor in the rally. But, the 10Y is nearing the top of the rising white channel. A breakout would not be positive for stocks. But, a breakdown would be even worse.
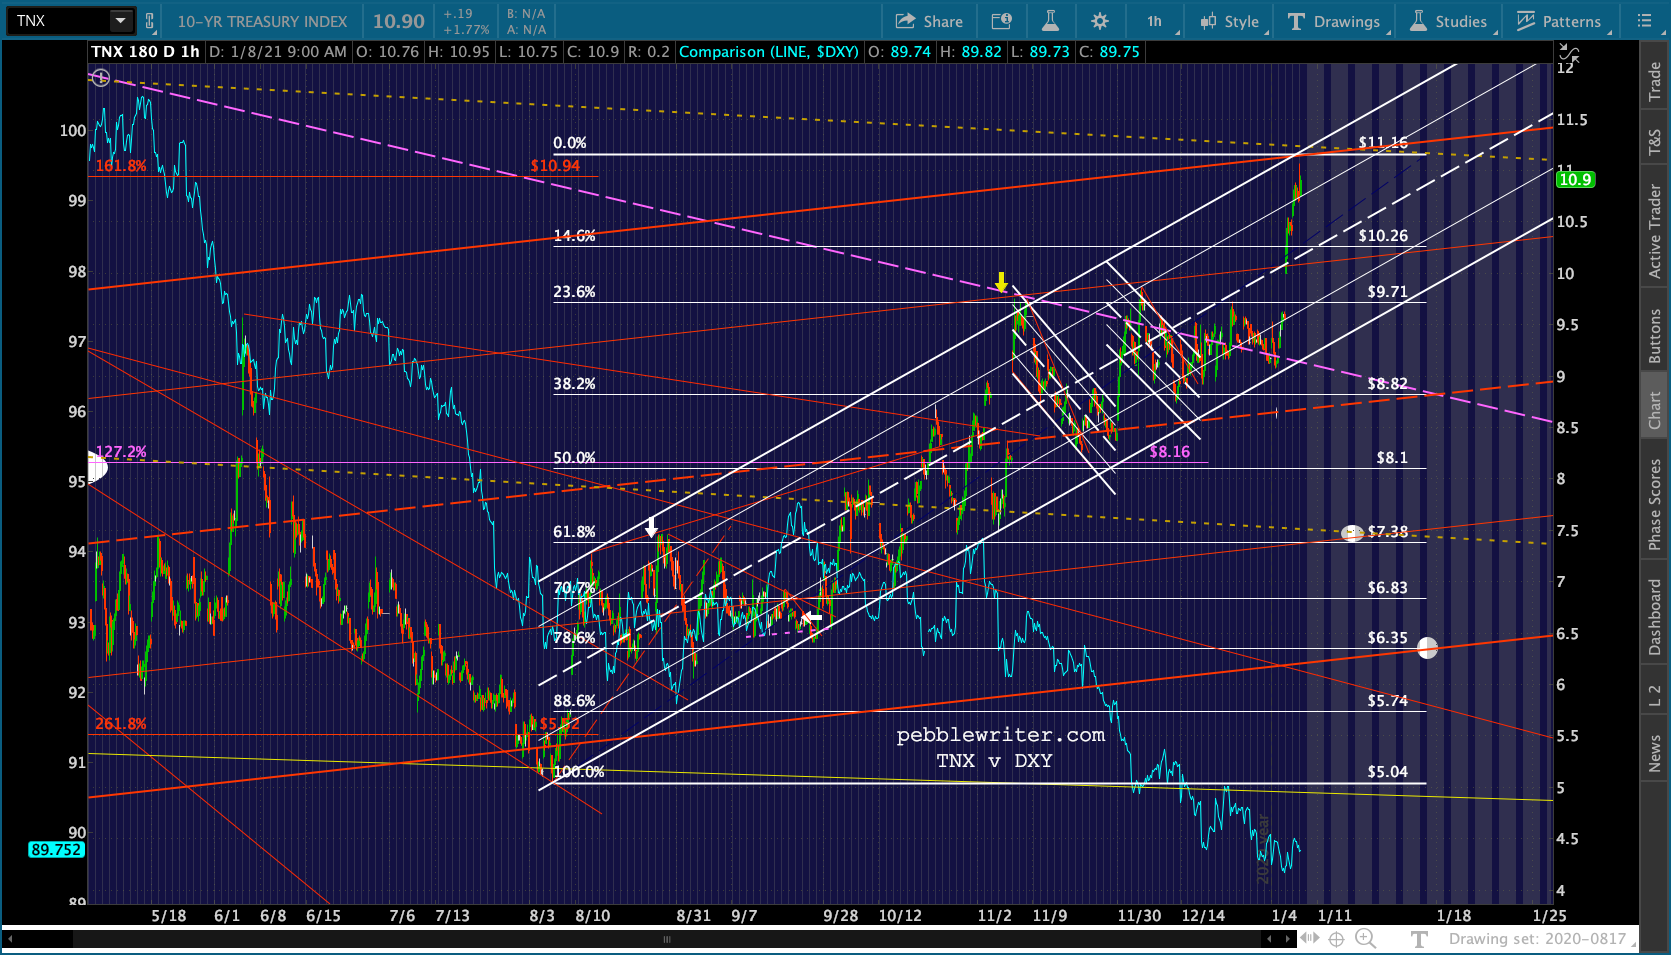 Meanwhile, the bond market remains at risk of a nasty correction with the breakdown of the 10Y futures. Gold bugs, remember the correlation here.
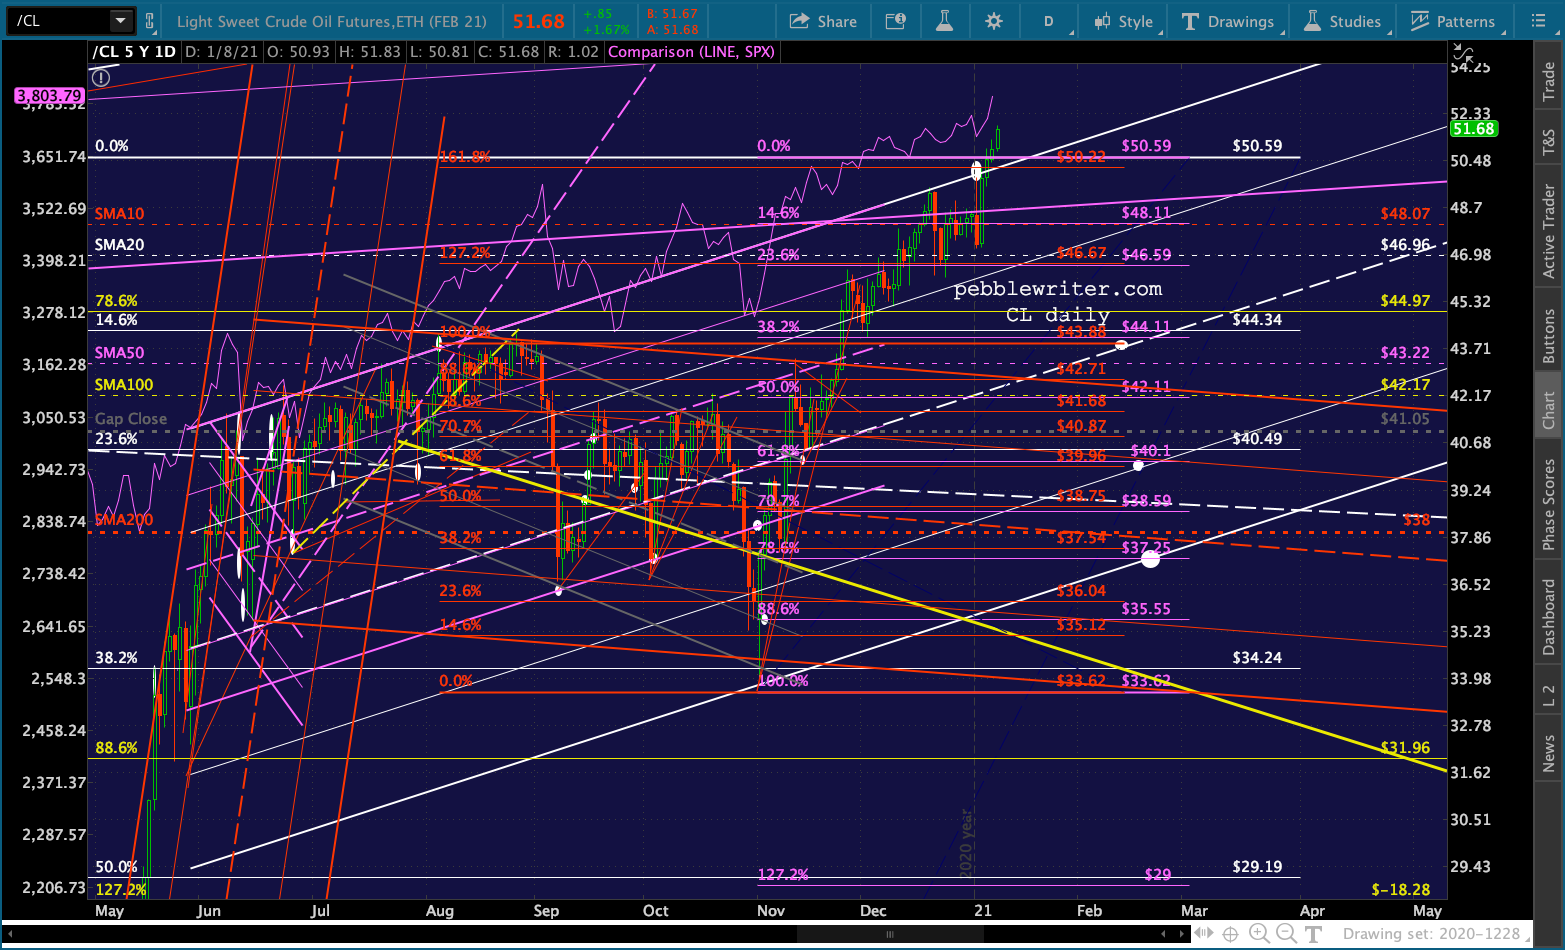
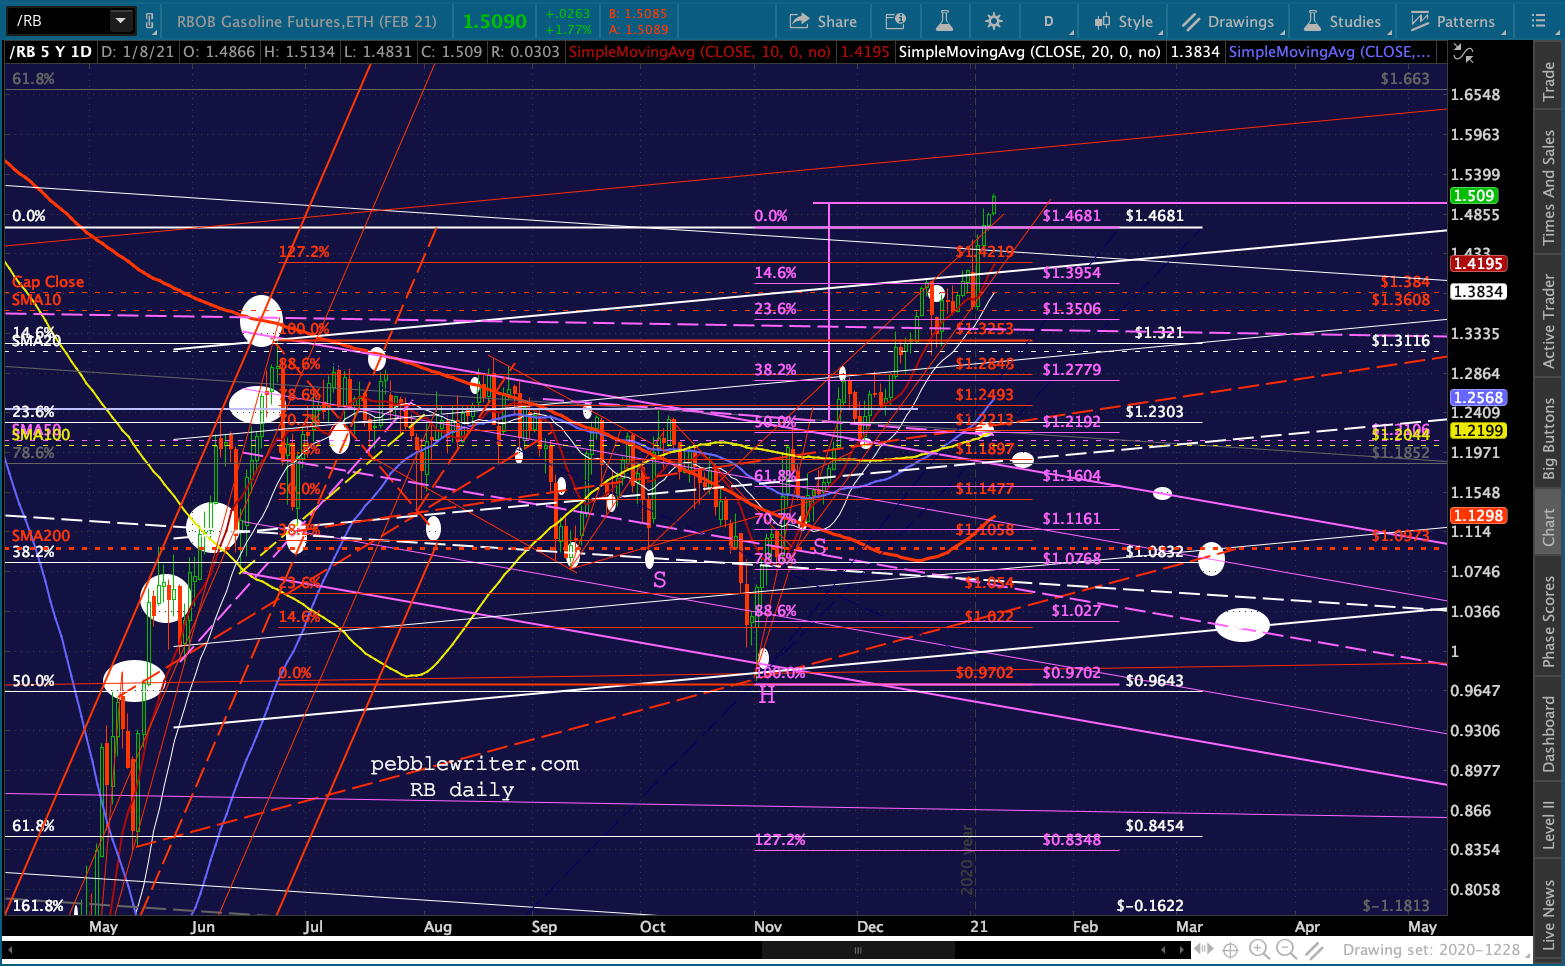
 CL and RB continue to melt up, but IMO it cannot last. I am still bearish.
 One other chart I haven’t shown in a while: HG. While the correlation with stocks has been tenuous at times, it’s a strong hint of trouble ahead.
 I have a couple of conference calls, then will resume yesterday’s post regarding some newly charted nuances to the yield curve model.
Stay tuned.
UPDATE: 3:15 PM
For those following the oil/gas rally, RB has reached an interesting resistance level. I know the past week has been painful for shorts, but I still believe there will be a nice payoff.
