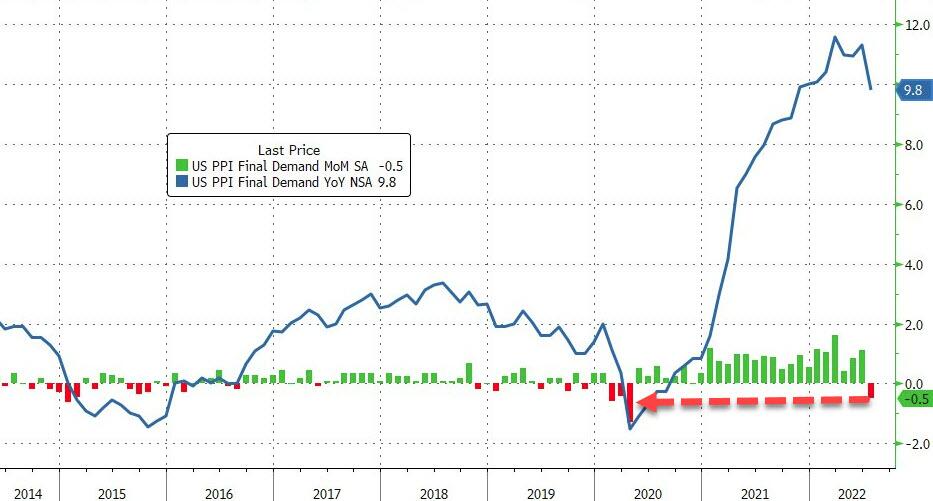
Annual headline PPI eased slightly in July, rising 9.8% versus June’s 11.1% increase. Monthly headline actually fell 0.5%, due largely to drops in oil prices. Core PPI remained elevated at 5.8% annually and 0.2% monthly.
As with CPI, the question remains whether inflation is rolling over or merely pausing.
With OPEX approaching, algos can’t be bothered such matters. Futures were off to the races again, perhaps catching the scent of the 200-day moving average just above…
 …and enticed by an ever-decreasing VIX.
 continued for members…
VIX hasn’t made new lows yet, but then again it hasn’t needed to. The channel breakdown has been sufficient to fuel the ongoing equity rally.
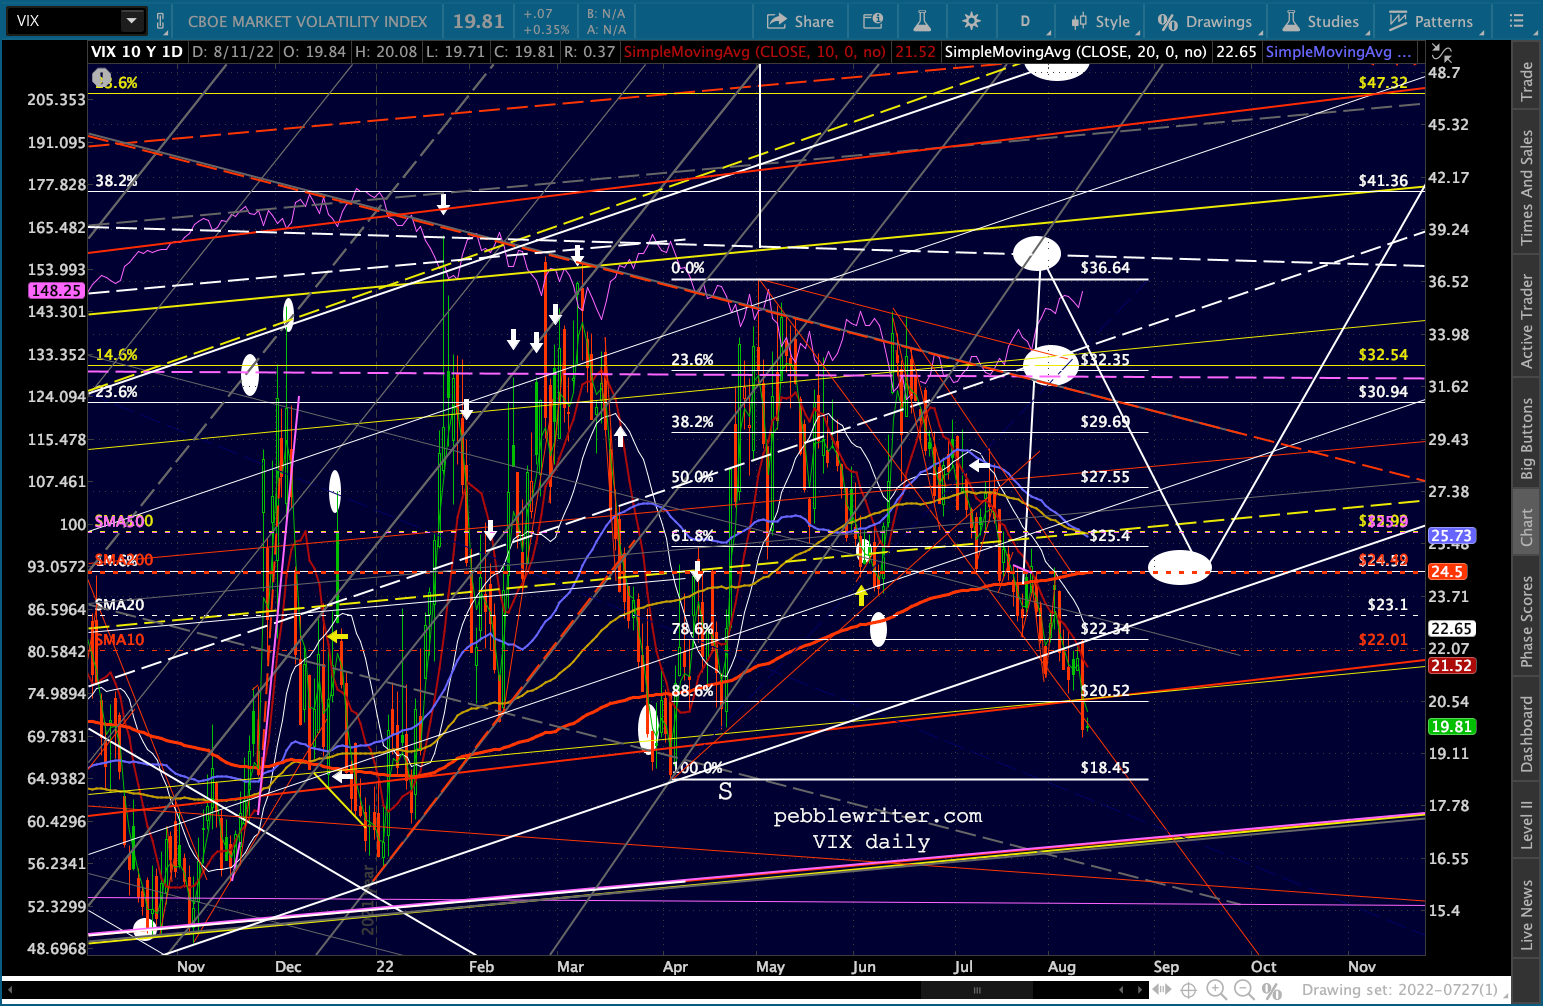
 Why does it matter what VIX does? If SPX is heading up to reverse at the SMA200, VIX will probably try to avoid new lows. If it’s destined for a breakout and resumption of the bull market (unlikely given the Fed tightening and recession) then new lows are probably on the menu, with VIX dropping to or even through the larger white channel bottom currently around 16.8.
 I don’t enjoy being so wishy washy about it. But, it’s been years since actual “bad” economic and monetary conditions produced a sustained bear market. We almost had one in 2020, but it lasted only a couple of months. Before that, you’d have to go back to 2007-2009 – before the Fed dreamt up fixing markets with QE.
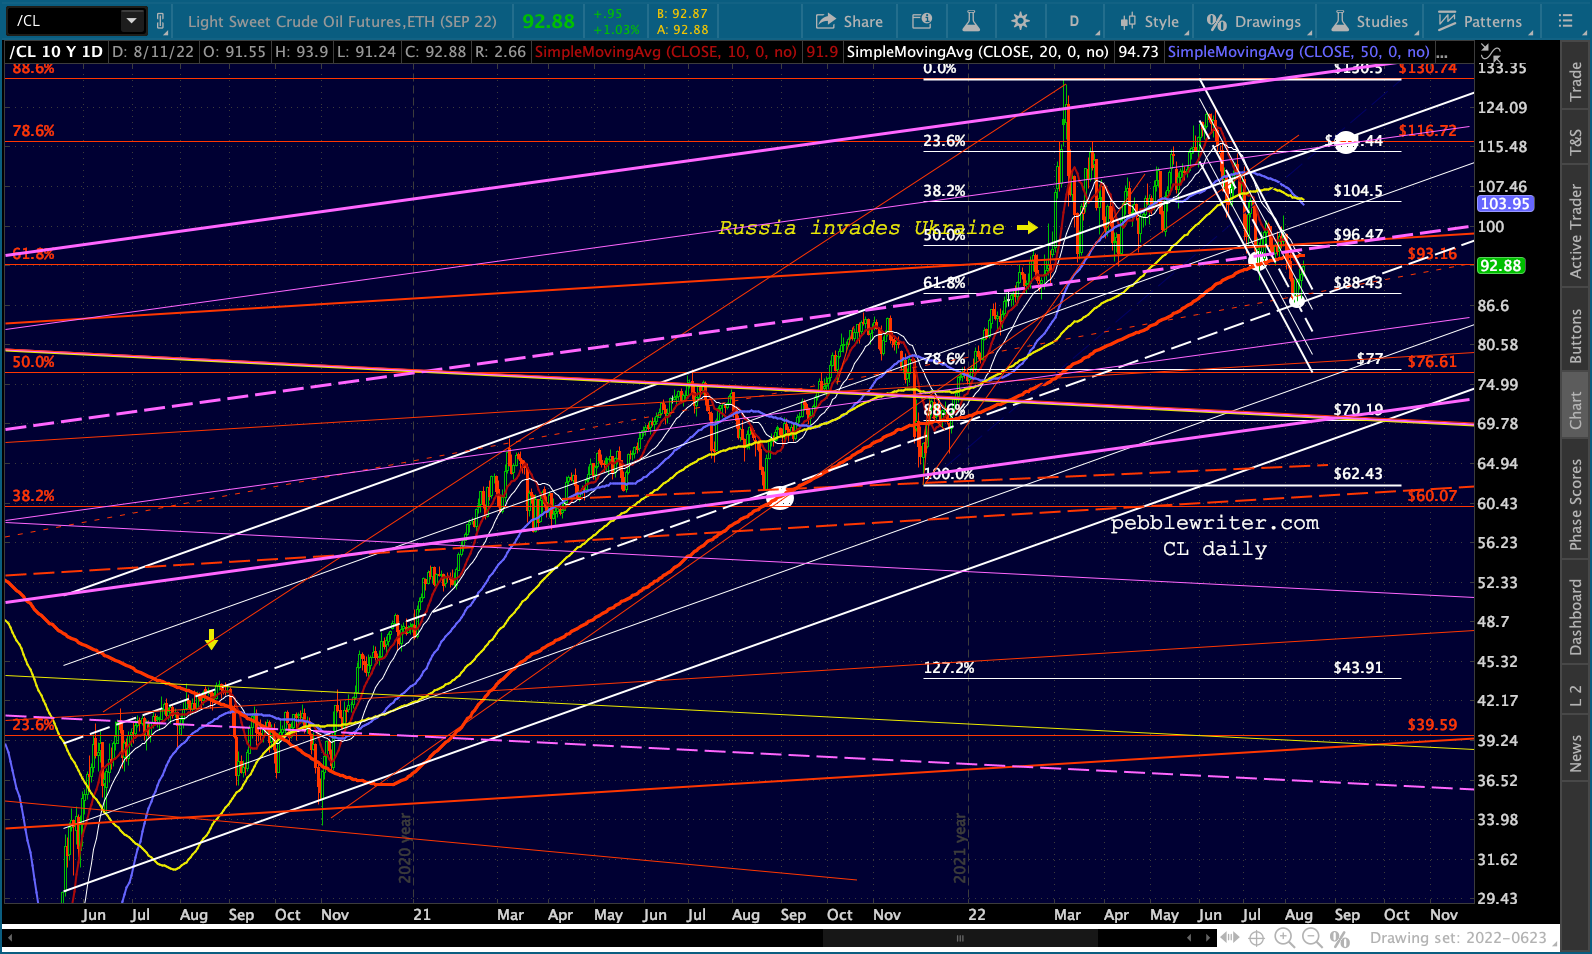
At this point, there’s a lot of wishy-washyness to the charts. CL and RB, for instance, have both reached decent support and have bounced up to decent resistance. The Fed and the administration need them to continue declining, but it boils down to what happens in Ukraine and what was agreed to during Biden’s recent trip to Saudi Arabia. I’m guessing there was some sort of deal made, but there’s no way of knowing.
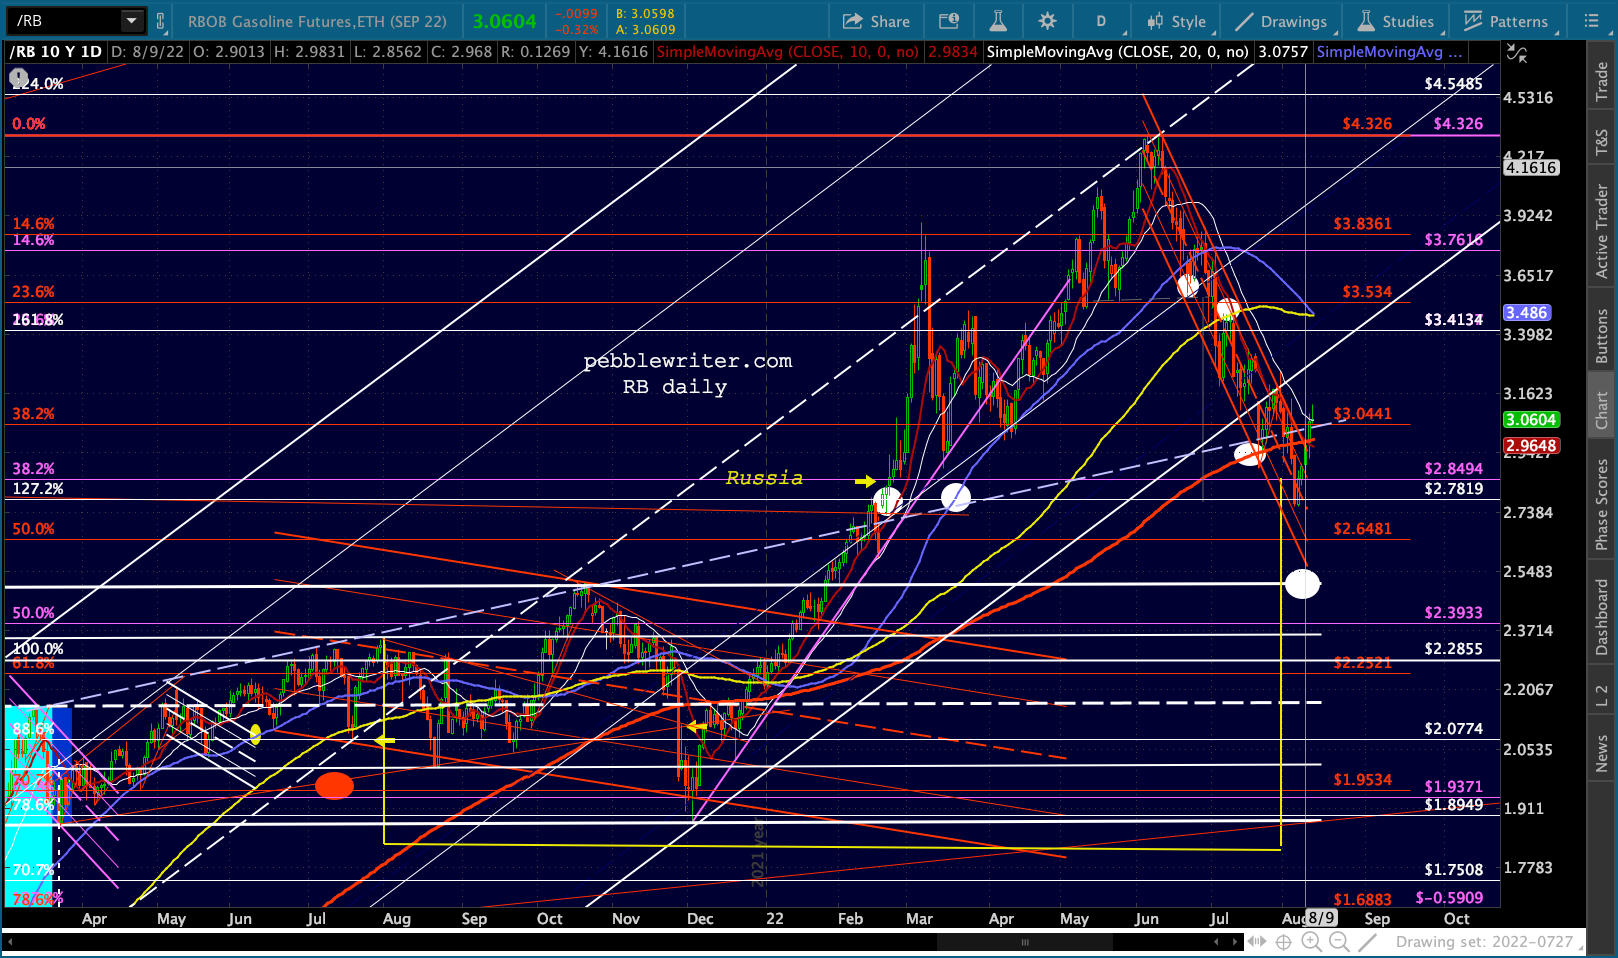 Bottom line, both have the ability to levitate stocks by simply pushing above the overhead resistance – even just intraday.
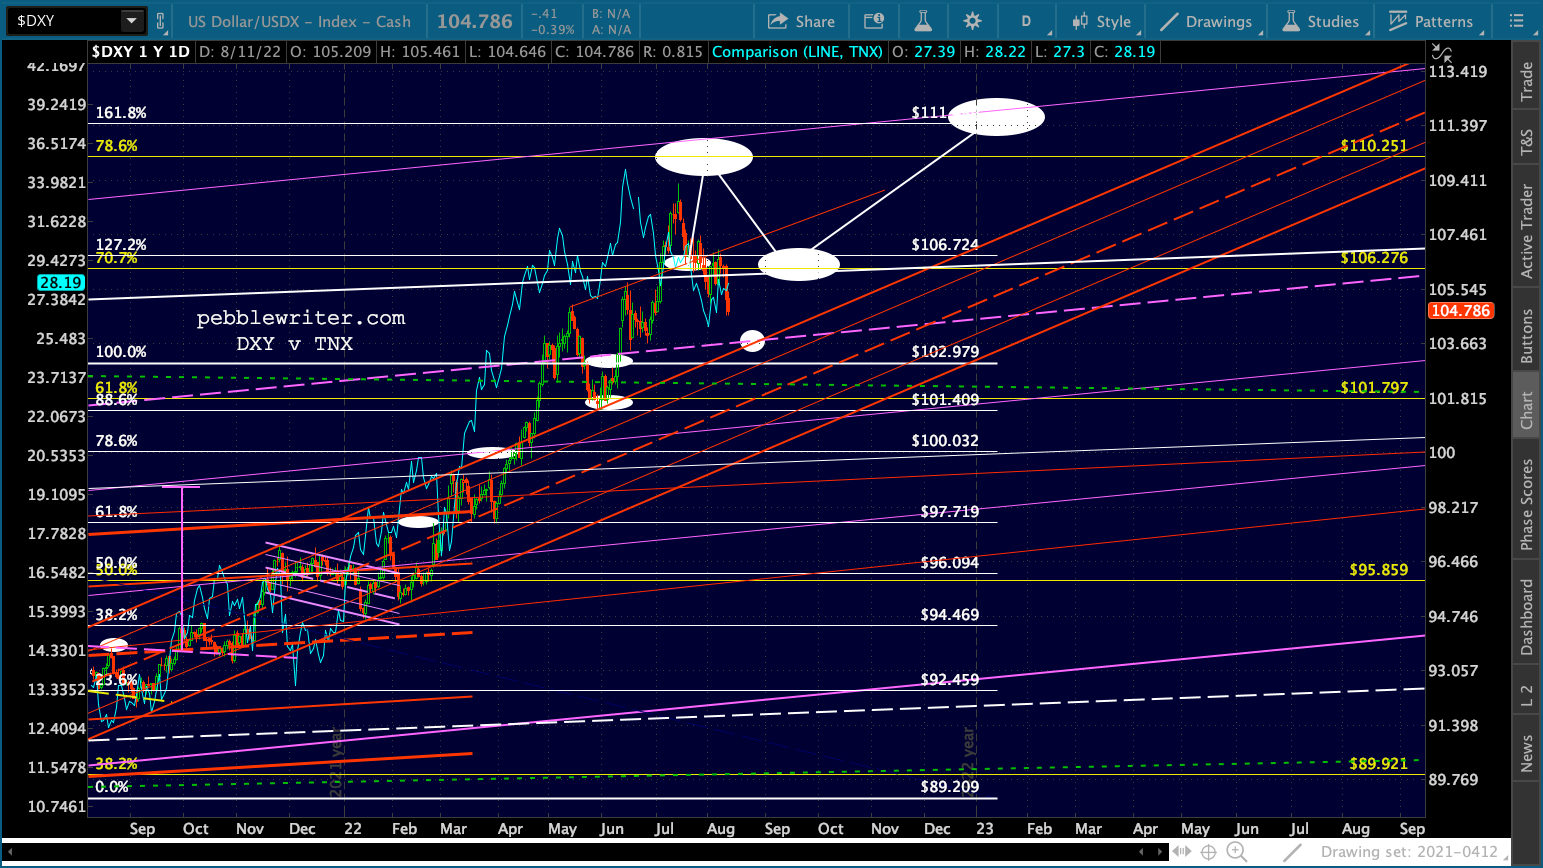
Ditto for currencies. USDJPY is always ready for a bounce, such as the SMA100. And, if the goal is to get ES to its SMA200 at 4327, isn’t it interesting that the top of the falling white channel crosses that MA at exactly the same time that EURUSD reaches the red channel top where it intersects with the former low next Friday (the small white circle)…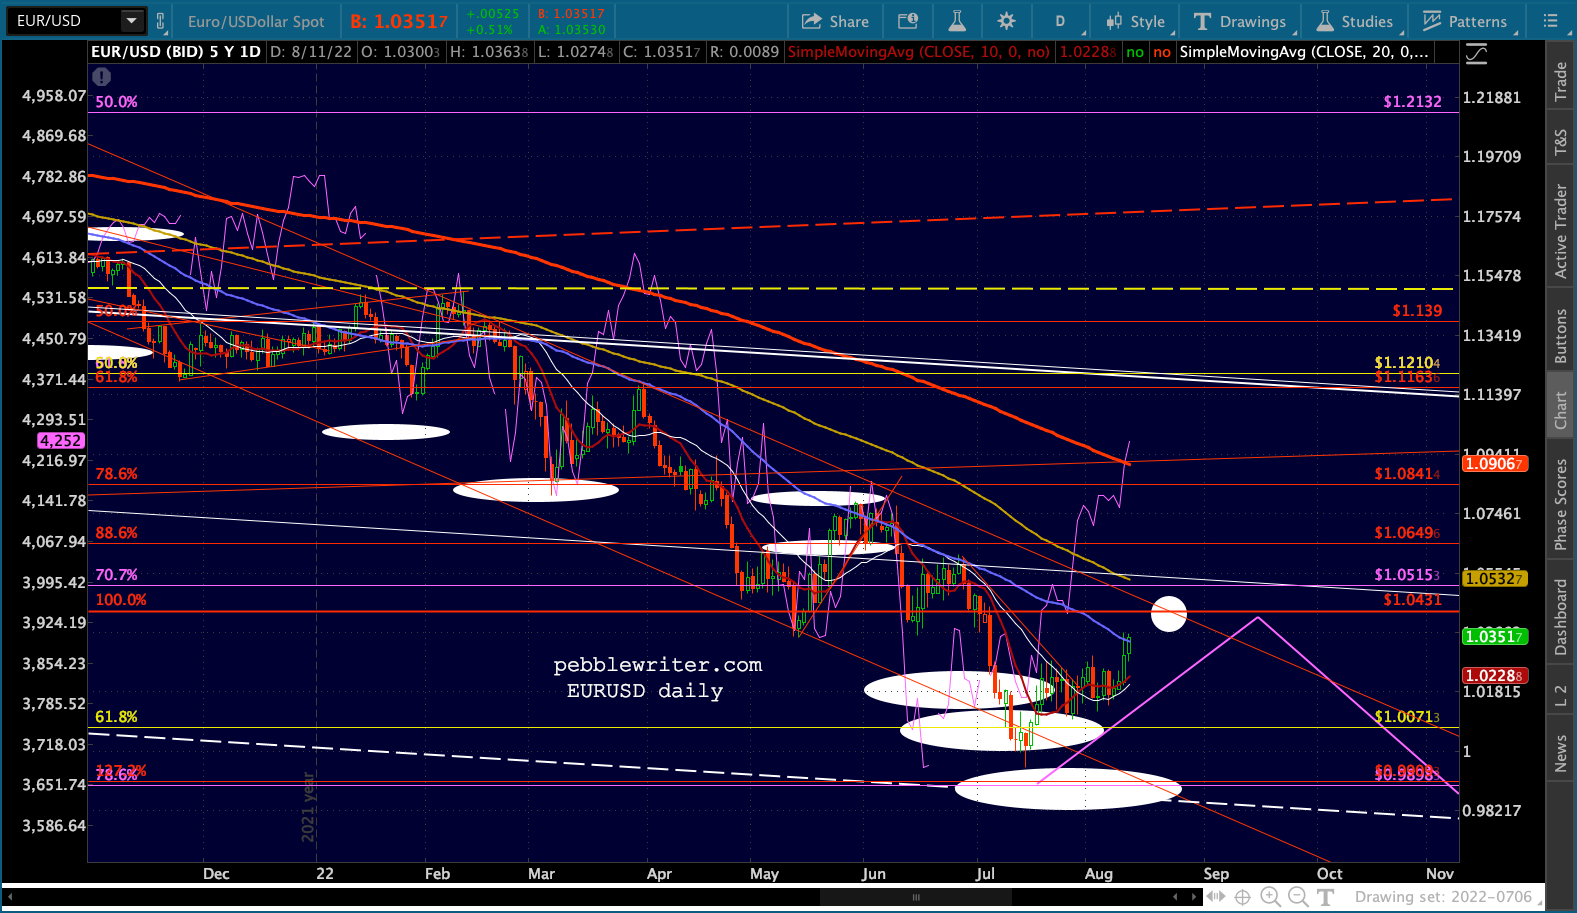 …and DXY could backtest the broken red channel at the purple channel midline?
 If currencies and CL/RB could step up to the plate, there’s no need for VIX to plumb new lows in order to keep stocks rising into OPEX – meaning that tool could be saved for a rainier day.
Not to be outdone, TNX is even rocking some indecision. It perfectly backtested the falling yellow channel from the last century and proceeded to backtest the neckline of a well-formed H&S that targets 2.0%. 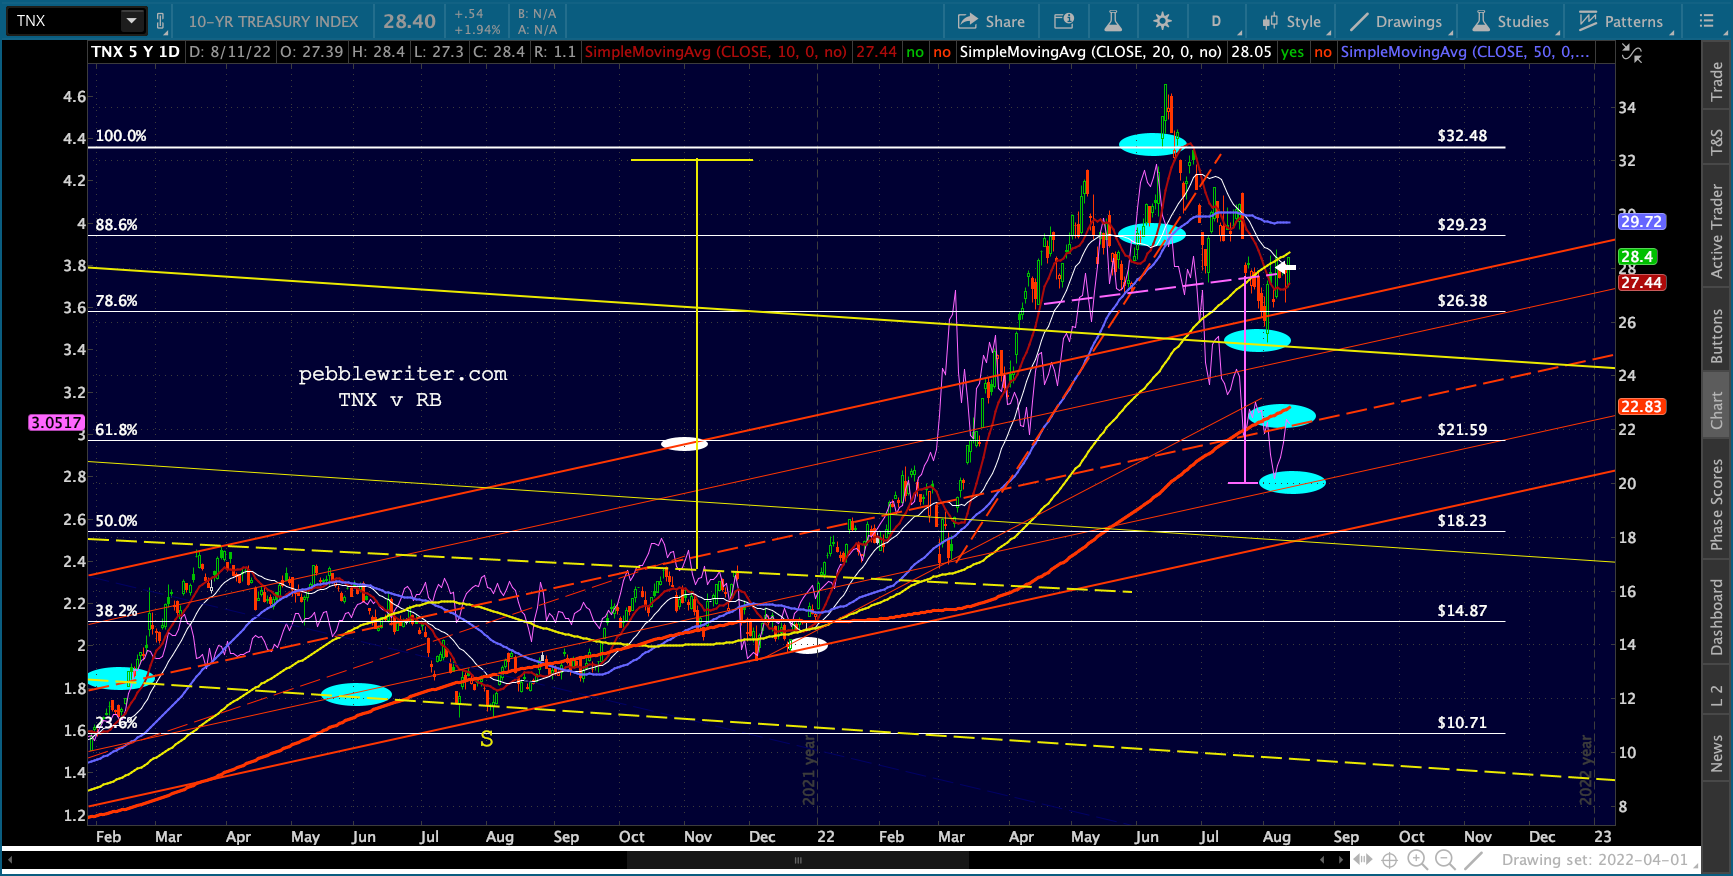 However, it’s now pushing slightly above that neckline and testing a trend line off the recent highs.
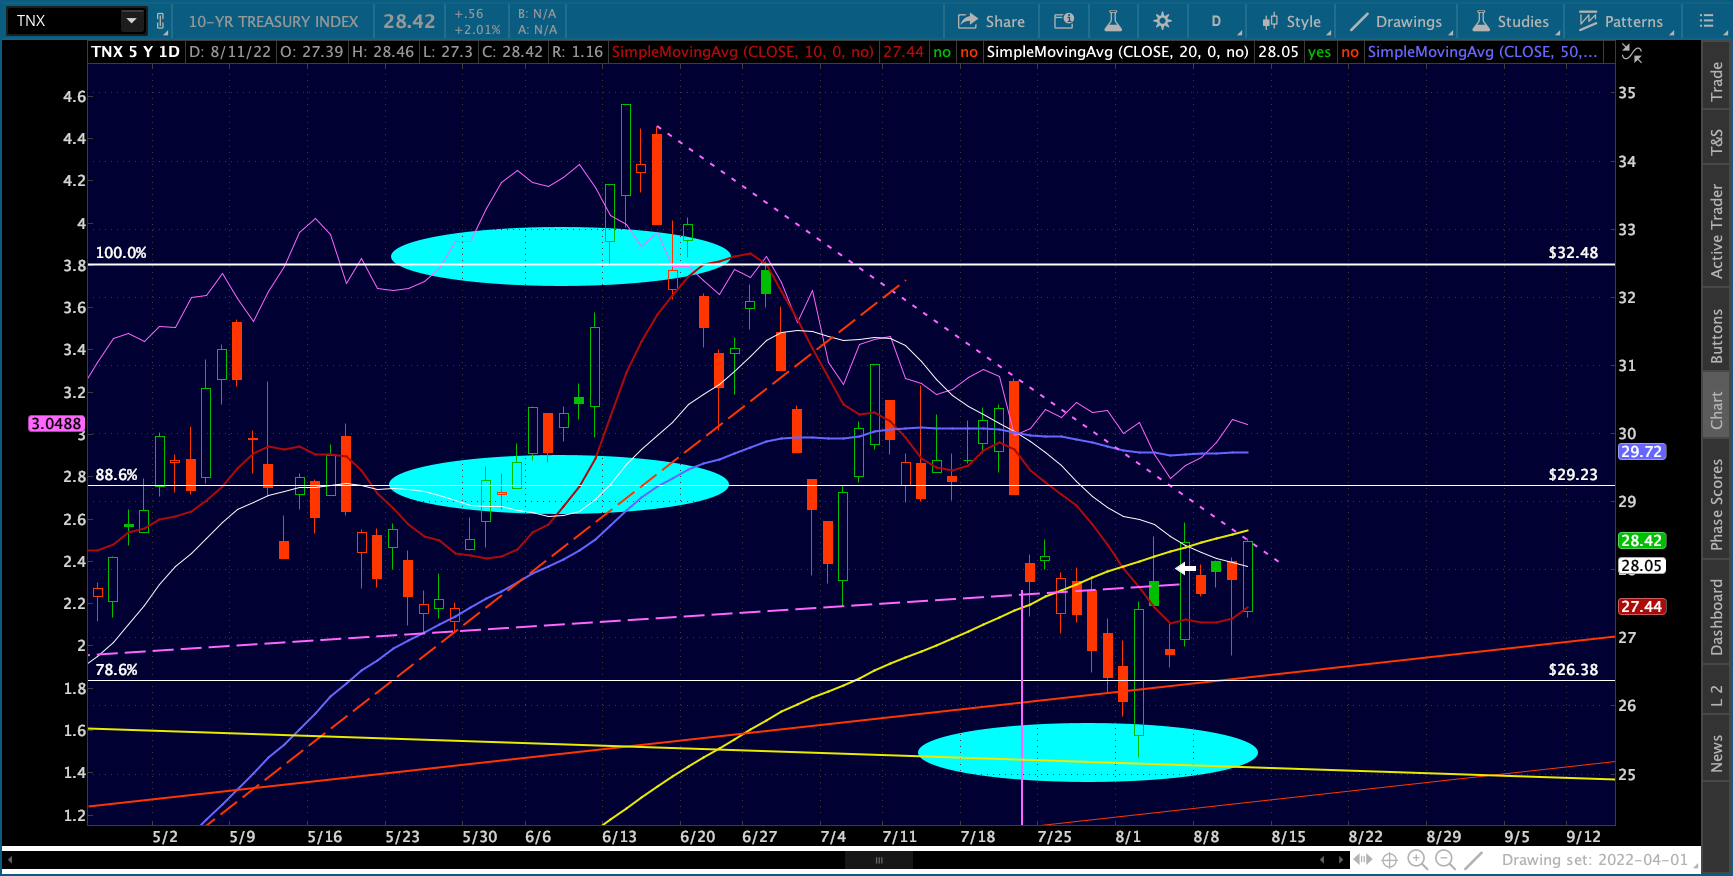 It’s stopped at a three way intersection with the engine racing and the brakes about to give out. But, which way to go?
That’s ALWAYS the issue when approaching the top of a channel. We saw this happen on Jul 28 when SPX/ES broke out of the falling purple channels. Remember, that was the day we got the 2nd quarter of negative GDP. Go figure.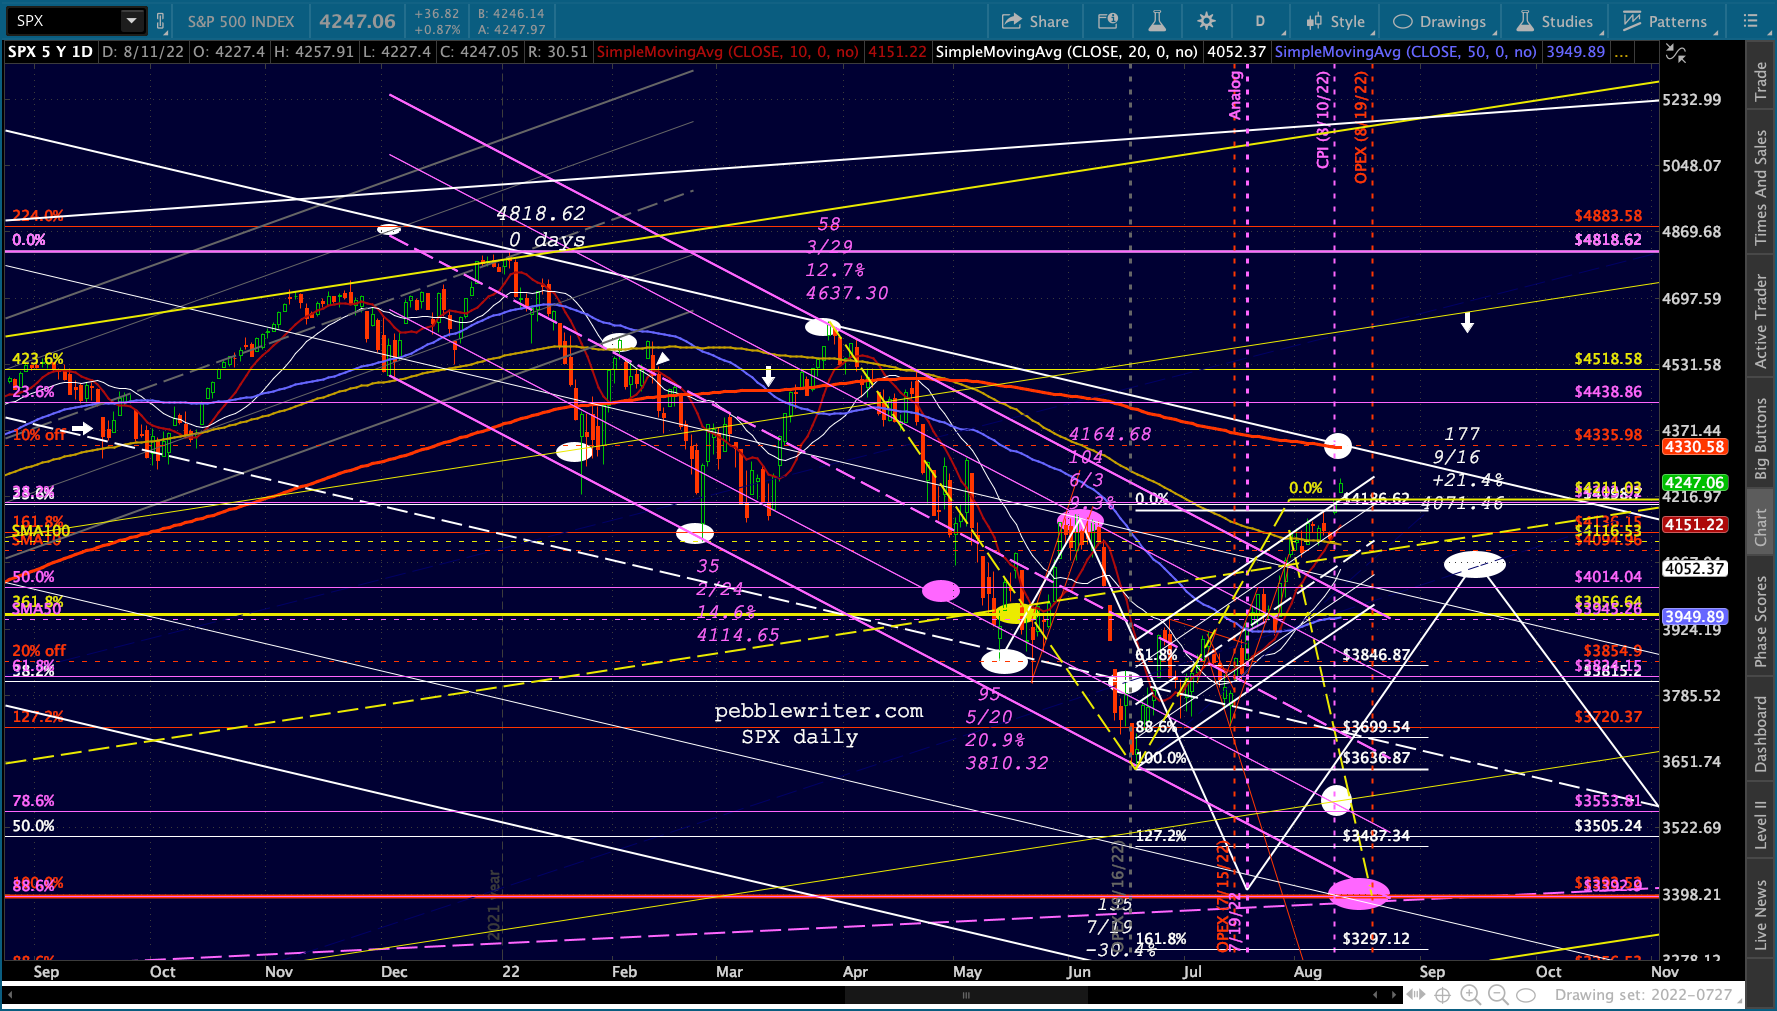 It all makes sense only when you consider how the system is set up to collect the directional bets of traders. When a massive amount of puts are purchased by traders, the writers of those puts (the house) faces the huge risk that they’ll be on the losing end of those trades between now and when the options expire. The only way to get out from under that potential obligation is to ramp SPX up to a level at which they won’t owe much to anyone on OPEX.
Consider just one contract, the Aug 355 puts. Remember, our analog suggested that SPX could reach 340, which would have made these worth at least 15.
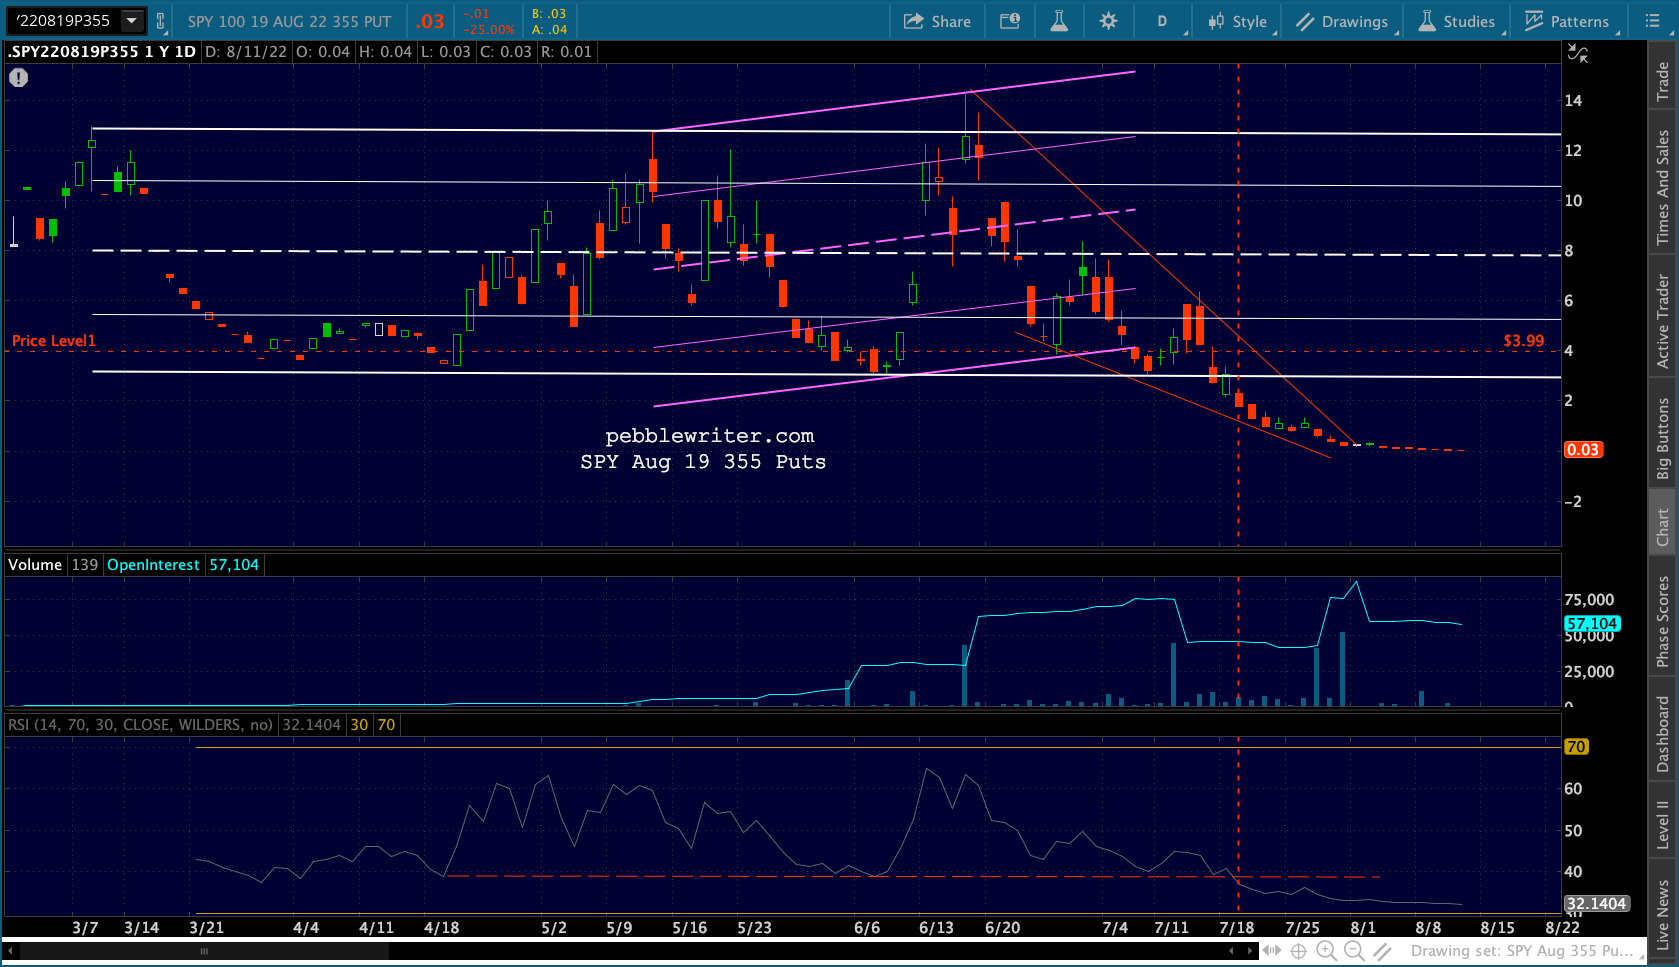 Open interest was around 75,000 in mid-July, so people who wrote them at the average price of 8 would have been on the hook for $52.5 million. Multiply that by all the different strike prices and expiration dates, and you’re looking at well over $1 billion. These were bets placed by traders who were silly enough to think that stagflation might be bad for the stock market.
It’s extremely frustrating to be right about the conditions for a meltdown but see trading opportunities snatched away by market makers and/or the Fed, which also has a huge incentive to not let the bear market get too ugly. It would ruin their chance to negotiate a soft landing. And, since we can’t examine their books, we’ll never know how involved they are in such maneuvers.
This is why I’ve spent the past six months working with a couple of PhDs on a quantitative model that would do a good job of following trends in rising markets but stepping aside during significant corrections. If we’re successful, it won’t matter that the market is manipulated.
We’re making progress, with a model that when backtested 22 years shows a 5-8% annual outperformance versus SPX with about 1/2 – 2/3 the volatility. But, there’s more work to do. Our goal is to create a fund that utilizes the model. I’ll keep everyone posted.
UPDATE: 3:30 PM
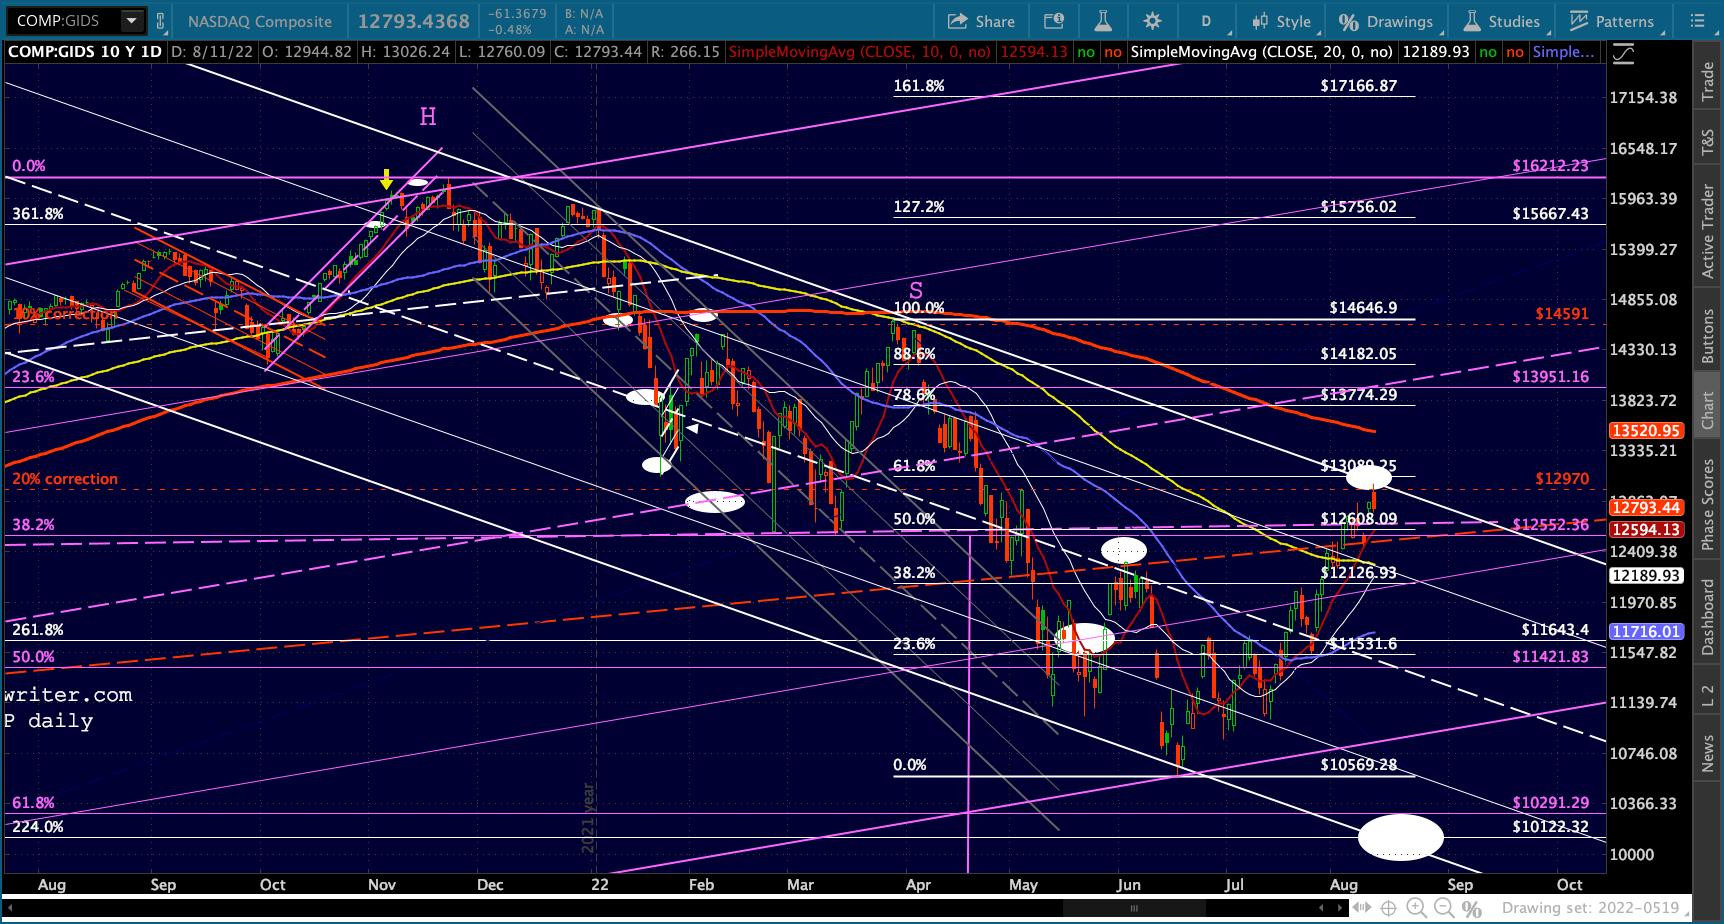
FWIW, COMP just reached the top of the falling white channel. Since the market’s bounce began on the day that COMP tested the bottom of its rising white channel, I consider this potentially quite significant.