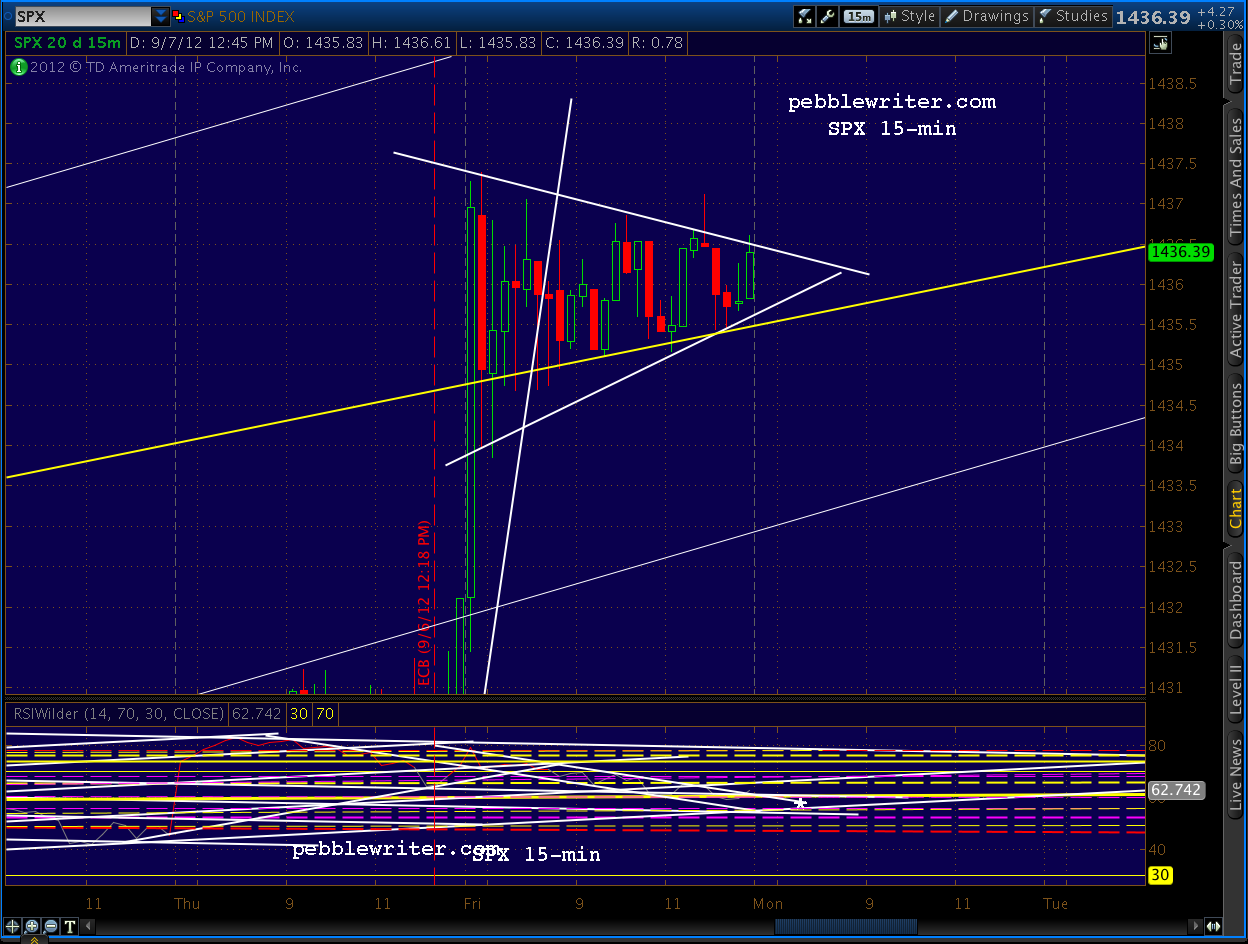
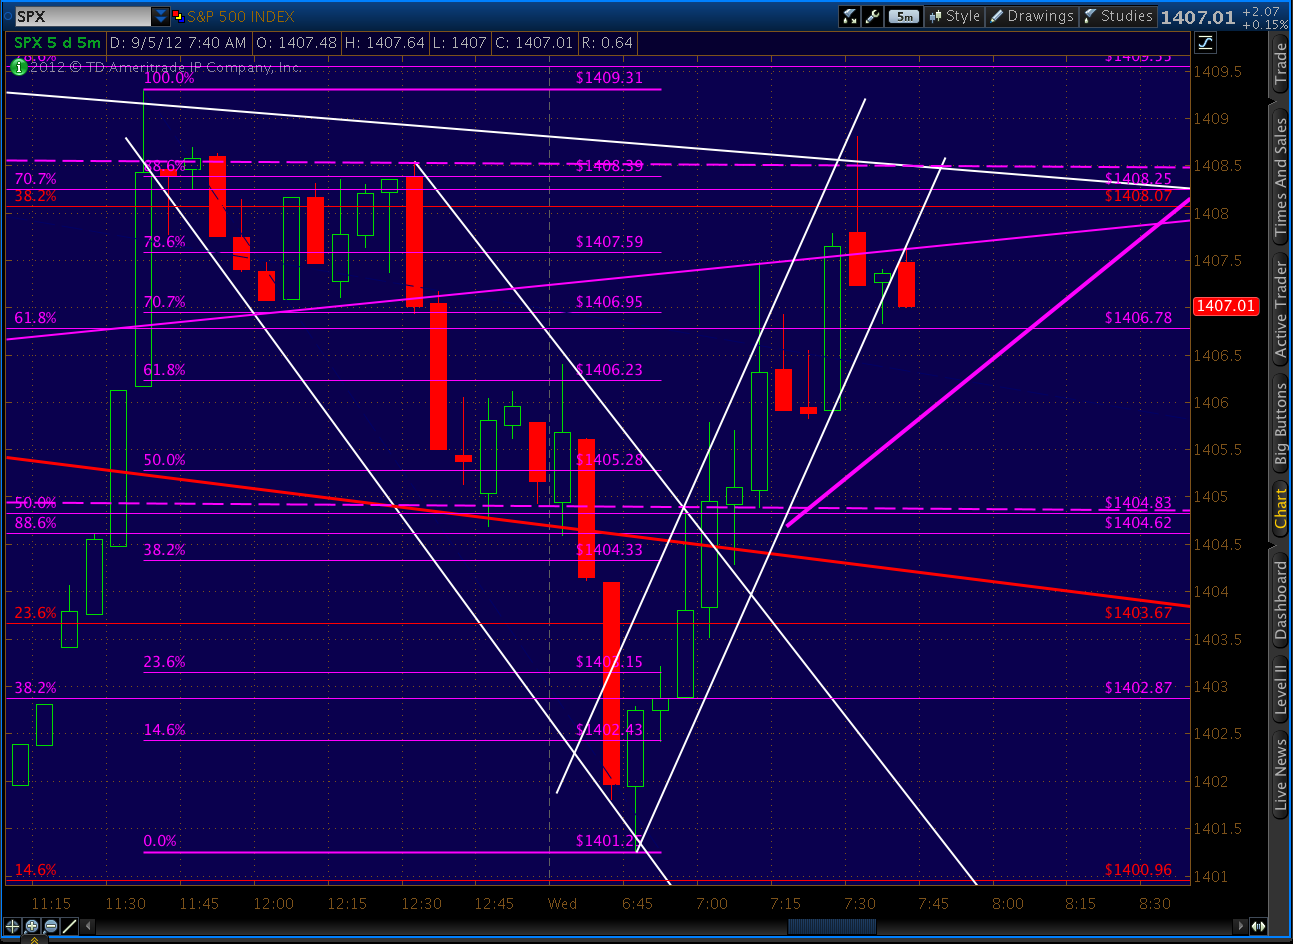
It’s entirely likely the market will remain comatose for the next two days until the German constitutional court decision on the 12th and/or the FOMC announcements/press conference on the 13th. IMHO, QE3 is very much baked into current prices; though, we should get at least a nice little pop if the central planners deliver as expected.
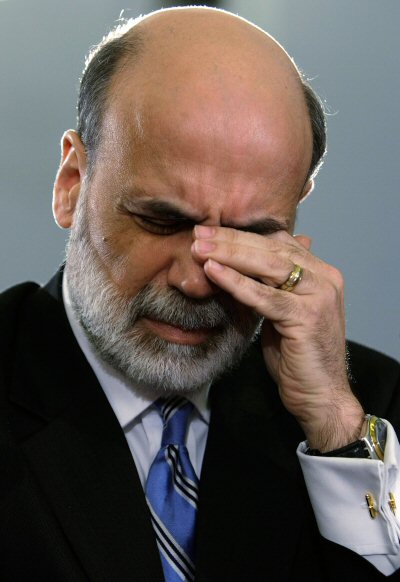
If not, expect a sizable sell-off unless Bernanke is able to let us down so easy as keep hopes very high (“we are postponing QE until October 12, at which point we will buy every POS bond in sight.”) It’s really that simple — which, of course, renders both fundamental and technical analysis meaningless in the short run and turns any long/short decisions made today into a veritable coin toss.
 The German court situation is similar. Draghi’s jawboning worked exceptionally well last week, producing a single-day 2.5 cent euro-bump versus the dollar that left it at least short-term overbought. If, after adjusting their hats, the BVerfG reign (sic) on Draghi’s parade, look for the overbought euro to become oversold sehr schnell.
I have no special insight into either event. Though, as I wrote last week, Dow Jones put out an interesting statistic last week regarding employment data: over the past 28 years, the August NFP stats have missed expectations 3/4 of the time. For the past 10 years, the average adjustment after the fact is 62K.
Not that I think the Fed harbors any illusions about QE actually addressing the stifling unemployment in this country (yes, I’m cynical), but if they’re attempting to at least make it look good…this might play into their decision. Their vastly greater concern is a stock market running on fumes and unbelievably leveraged banks whose solvency hinges on perpetuating the myth that their trillions in derivatives aren’t a bad hair day away from implosion [see: The Wipeout Ratio.]
 Then, there’s the small matter of the election only eight weeks away from tomorrow. The Republicans have stepped up Fed-centric rhetoric of late, practically guaranteeing an Eccles Building house cleaning if elected (though I suspect they’re only trying to lure some Paulies into the tent.)
At the end of the day, the Fed is at least as concerned with self-preservation as any other body politic. After throwing “We the People” under the bus for their friends on Wall Street, it’s hard to imagine them falling on their swords now for the sake of the economy (did I mention I’m a cynical bastard?)
As I perused the financial press over the weekend (anything to avoid doing my taxes), the euro zone’s financial melt-down dominated. Criticism abounded, with a common theme being how much better America has handled the crisis. While our friends across the Atlantic face many structural and governance challenges, the real difference between our fates has been the willingness of our politicians to spend $16 trillion more than they’ve taken in and our central bankers to stymie the natural market response — i.e., soaring interest rates.
Then, there’s the minor fact that the USD is still the world’s reserve currency. As a wise friend of mine likes to say, until we go full barter and I start making your kids shoes in exchange for your extra chicken, it’ll remain so — even after we tumble over the fiscal cliff (we can’t really expect them to “fix” that in the months leading up to an election, can we?)
That’s where things get really interesting. The stock market’s ramp to new highs has taken our collective minds off the calamitous impact that a severe spending decrease and/or tax increase will have on our economy. As our predicament comes home to roost, the (continuing) recession will finally be obvious to all. Even if, by some miracle, Bernanke can muster enough spit and bailing wire to keep the markets from crashing, it’s not entirely up to him.
George Soros argued earlier today that Germany and the rest of the euro zone are heading for a Depression within the next six months. Draghi and Merkel’s solid Eddie Murphy impression notwithstanding (Keep it together! Keep it together! Keep it together!), the weakened and over-leveraged US economy will no doubt follow suit. Maybe the Fed will go down swinging, throwing good money after bad, and maybe not. But, it will make a difference only in when and how — not whether — the markets will collapse.
 In 1923, Dr. W. Frederick Gerhardt, head of Aeronautical Engineering at the University of Michigan reasoned that since wings provide lift, more wings would provide more lift. He built a beautiful aircraft known as the Cycleplane that featured a total of seven wings. It even flew a few times.
But it’s best known for the time it was being pushed along the ground and the entire contraption collapsed under its own weight.
As we’ve discussed many times in these pages over the past year, the solution for too much debt isn’t more debt. There will be a point of recognition, sometime between now and December 31, when capital markets begin to reflect simple math. The economic shock will be too great for even the Fed to mitigate.
When that happens, the rush to the exits will be swift and severe. But, until then, we’ll do our best to navigate the twists and turns — making the best of markets that are showing few signs of rational behavior.
Stay tuned.
UPDATE: 12:00 PM
Taking a little short position here at 1435, with a trailing stop of 1435 if the break of the 60-min RSI TL plays out. Probably won’t go anywhere, but you never know. Maybe the Soros comments will rattle some folks.
 Made an interesting discovery in EURUSD this morning. The RSI level of 73.108 reached Friday is relatively rare. It presaged several decent corrections over the years — the most recent being April 28 – May 3, 2011 when the market topped at 1370.
 Eight out of the past 10 instances were followed by SPX drops of 50 points or more — typically within 2-3 weeks.
UPDATE: 3:20 PM
Adjusting my stop to 1434.
UPDATE: 3:55 PM
Taking profits on the bulk of my shorts at 1429.30; will leave a small flyer position in place.
UPDATE: EOD
What a crazy day. As I was writing about the inevitable demise of the economy as we know it, the market started slipping. Pretty soon we had broken an important supportive TL on the 60-min RSI — usually a clear sign of at least a little slide in prices.
I paused my pontificating to put out a trade alert, and found out that apparently everyone at GoDaddy went out to lunch at the same time, leaving no one to pedal the generator that keeps millions of sites open.
No sooner had I sent an email version of the post and trade alert re my short at 1435, when I realized the email servers were down, too. I switched to an old Gmail account and sent it out via email; hopefully, everyone got one. I was a tad early, as it took a while for investors to believe that a dip was being allowed in the days leading up to Bernanke’s press conference (Thursday.)
Fortunately, there was plenty of remaining movement over the next hour or so and we were able to ring up another 6 points to the good. Any other time, I’d stay full-on short into the close and overnight. There is a strong case for continued weakness. But, given the proximity of the German court decision re ESM and the FOMC meeting, I’m continuing to play it safe. I kept a smallish position overnight, but took profits on the majority of my shorts. Unless something changes, I’ll resume directional/swing trading again after Bernanke’s speech on the 13th.
Regarding the GoDaddy issue: it continues to go down periodically. As of a few minutes ago, the mail servers are down but the others are up. There’s nothing I can do in the meantime other than send out email versions of each post and double-post everything to the old pebblewriter.blogspot.com address on Google’s Blogger until the dust settles.
BTW, as GoDaddy comes back to life, you will probably receive emails and/or texts advising you of “new” posts that were actually made months ago. If you haven’t done so yet, register your email address in the window to the right and consider registering your cell phone for text advisories.
* * * * * * * *
THE CONTEST
Just for grins, lets give away some memberships. Since we’re likely to have some fireworks this week, I’m curious as to what folks are expecting. From now through 6pm EDT on the 11th, submit your best guess as to the closing quote for the SPX on September 13th. One entry only, please, and verified Disqus ID’s only. Prizes are as follows:
- closest to the mark: one year membership
- 2nd closest: semi-annual membership
- 3rd closest: quarterly membership
Post entries in the Disqus section of the THE CONTEST. First come, first served. Once a particular number is posted, no one else may chose it. I’ll do my best to police these, but it’s up to you to do your homework first. And, while you’re at it, impress us with the logic behind your reasoning. I have some monthly membership awards to hand out for overwhelming brilliance, creativity or humor.
If you’re already a member, you may use your award to extend your current membership or give it away to your favorite charity or a close friend. All winners are responsible for any taxes, etc. on their winnings, and entries are void where prohibited.
If Disqus eats your entry, use the “contact me” form in the menu above and I’ll post it for you as soon as I notice it. Just to be on the safe side, you could also copy me at pebblescribe at gmail dot com. Who knows when/if GoDaddy will get things going again?
Remember, post all entries in the Disqus section of THE CONTEST, not below.
Good luck to all.




 As Mish reported in June, the EUR 700 bn is funded in 5 annual payments. For 2012, there should be EUR 140 bn with which to beat back the bond vigilantes. However, several of the supposed contributors on the list are also likely contributees.
 While waiting for the red-hatted ones to make their appearance last night, I had time to do a total reset on SPX. Every month or so, I erase all patterns on my charts and start with a fresh slate — just to see if I come up with the same conclusions.