

Time flies when you’re having fun. It’s hard to believe it’s been almost three years since Brexit first broke.
I initially looked at EURGBP as an interesting trade opportunity. With the EURGBP at .7622, it looked like there was a good chance it would end up at .86 or so. This was our daily chart from June 22, 2016 [see: The Eve of Destruction.]
 It reached our initial targets of .8262 and .8411 by June 30, and reached .8599 on July 6 — a nice 13% return in two weeks. It might have stopped there, as it represented the .886 Fib retracement as well as the channel midline.
As we had discussed in The Eve of Destruction, sharp rallies and pushes above resistance were bearish for stocks.  So, I expected heroic central bankers to swoop in and save the world at that point. To be sure, it needed saving. Futures crashed 6.5% overnight. Additional carnage-depicting charts are available at It’s a Brexit! posted live that evening.
 In any case, TPTB didn’t save the world by putting a lid on EURGBP — which popped above the former highs.
  Instead, USDJPY made a heroic reversal and VIX collapsed to some of the lowest levels seen in over a decade…
 …all because EURGBP couldn’t be contained. It’s important to note that even though SPX didn’t completely collapse, it tested important lows and took almost a year to regain its 2015 highs (the shaded area below.)
 There were other things going on. But, GBP’s weakness was certainly a drag on stocks as had been the pattern in previous years.
As it turned out, EURGBP’s ascent wasn’t without a target in mind. It had passed up the purple .886 to focus on a different one. On Oct 7, 2016, it came within .0039 of its white .886 Fib based on its all-time high and its post-GFC lows. Since then, it has been consolidating. The highs have been very well aligned — preserving the narrative of a downward trend. Does this mean we can count on the GBP to steadily increase in value? Maybe.
continued for members…
Note that the lower bound in Dec 2016 and Apr 17 was limited to about 0.83 — close to the white .500 Fib. Since Sep 2017, it has been well defined by the midline of a falling channel.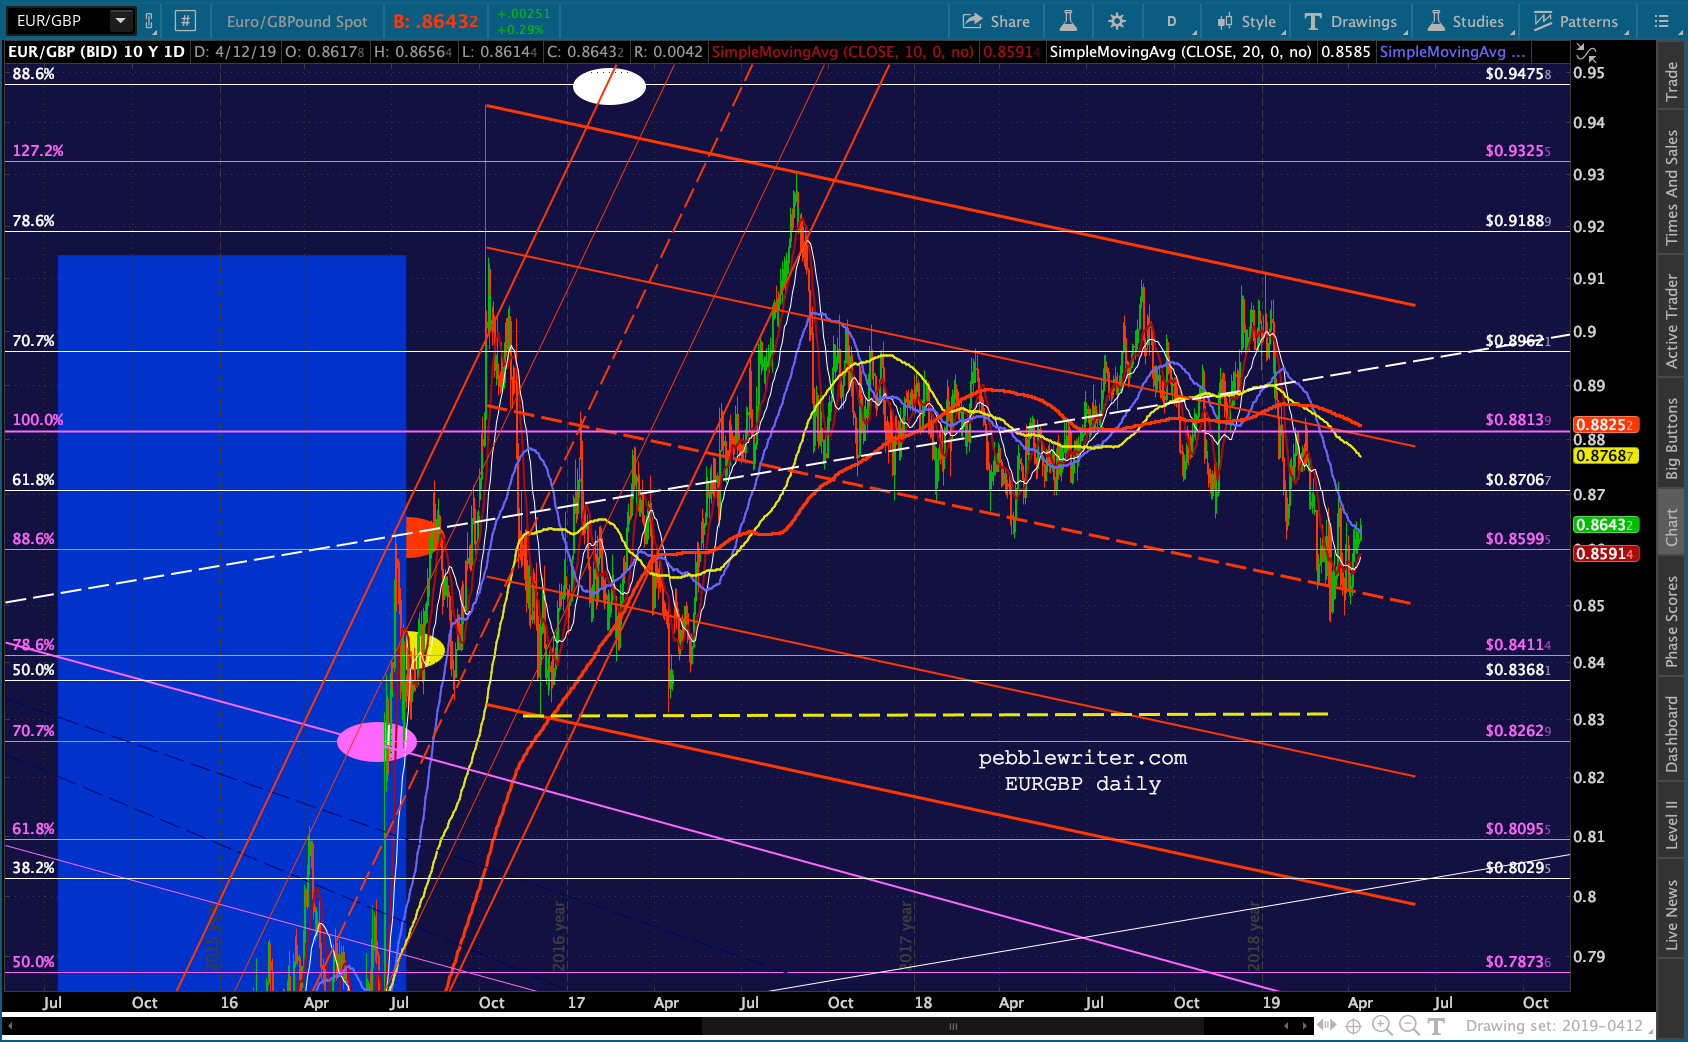 If we examine the pattern from 30,000 feet, we can see the makings of both a consolidating triangle (the yellow dotted lines) and a flag pattern (the red channel.)
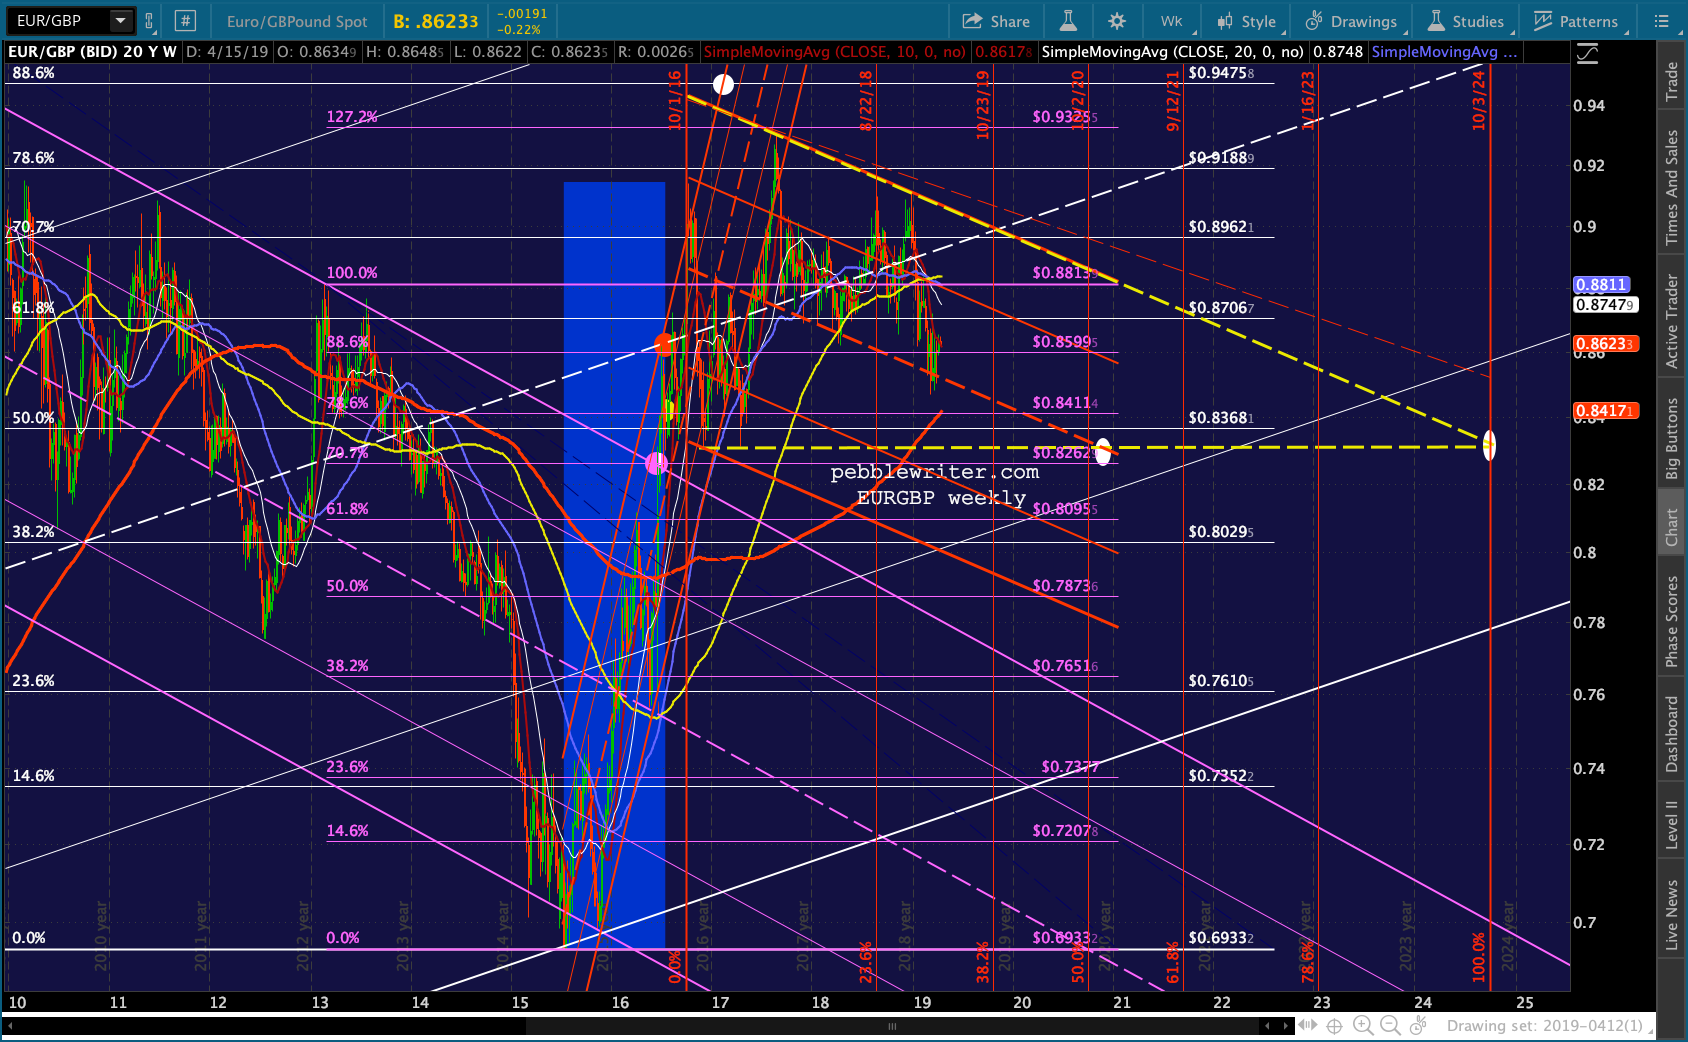
Looking at potential retracements of the 2015-2016 rise, we can get a little more perspective, especially on a bigger weekly chart.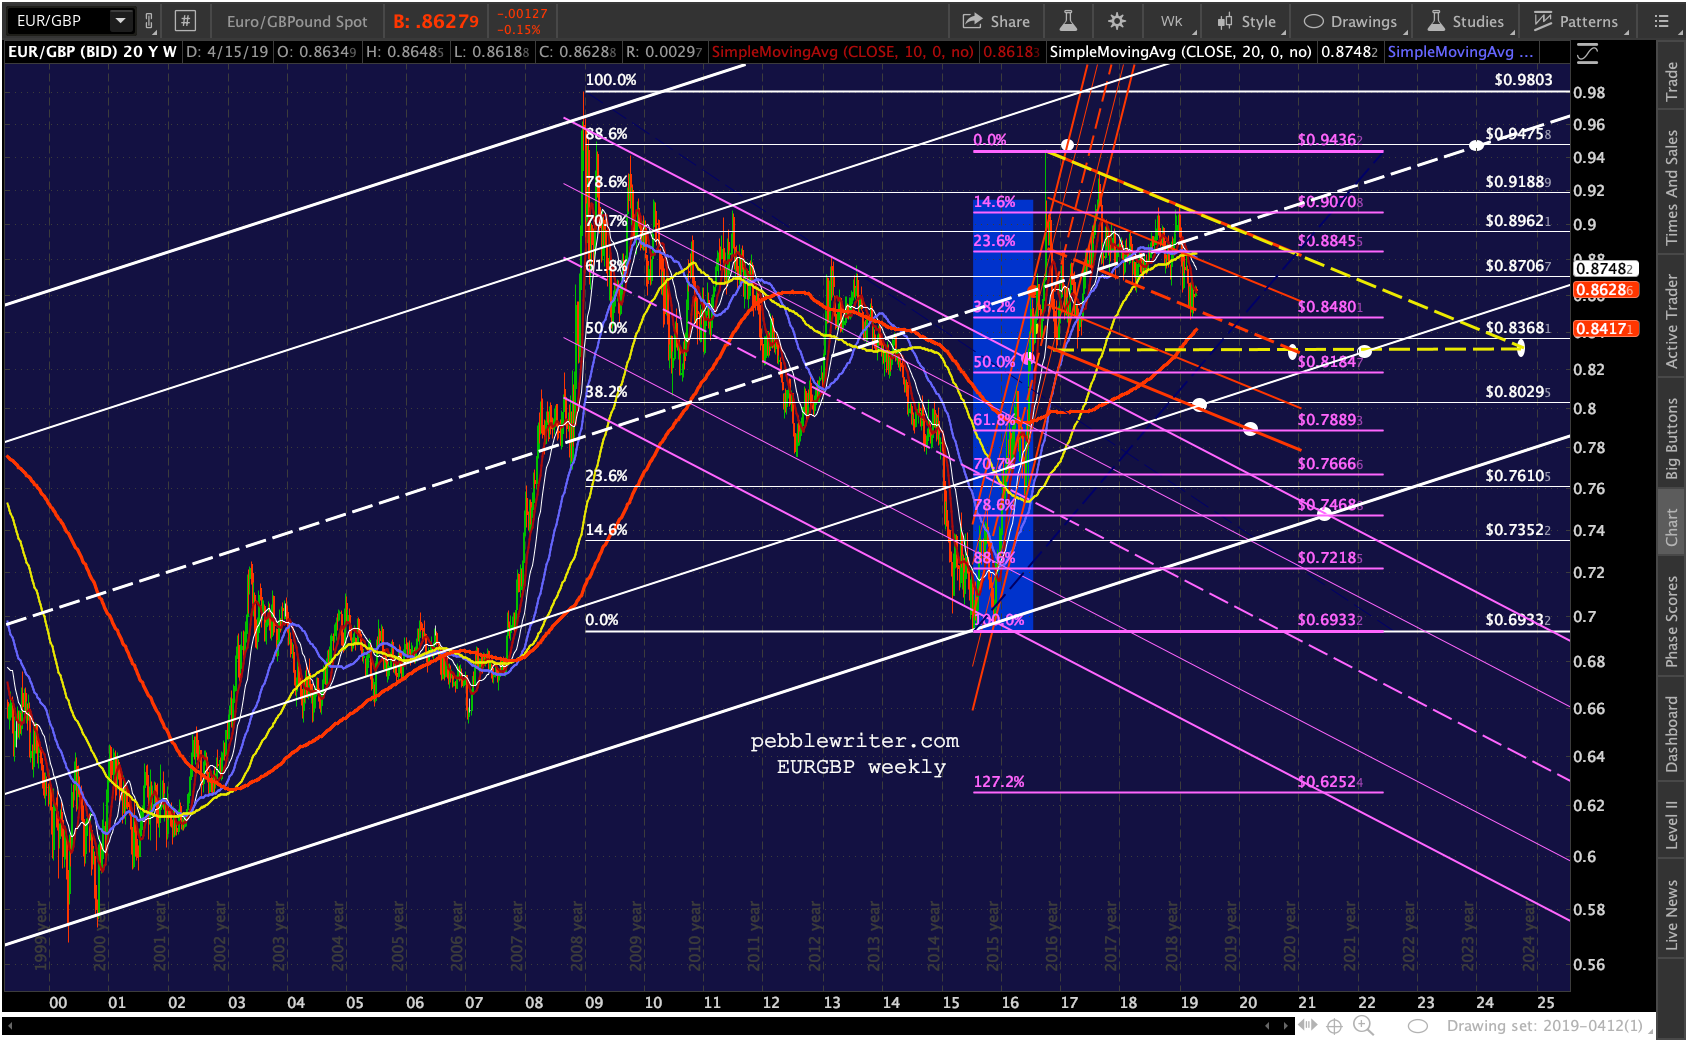 While the big, rising white channel has done a great job of capturing tops and bottoms, the .236, .500 and .786 channel lines have been violated on a regular basis. They are imprecise targets at best.
The Sep 2016 high, for instance, never reached the .786 line — which would have been near a new high. The drop back down exceeded the midline. And, the subsequent bounces around the midline have presented many headfakes.
The latest decline, were it to drop through the red channel midline, would run into support at the yellow horizontal support before reaching the white channel .236 line. If it dropped through, it could conceivably reach the white .382 Fib if it hurried.
Otherwise, it might well wait until 2021 to tag the intersection of the red midline and the yellow TL. That’s a very long time to wait for such a small move. A drop to the purple .618 Fib at .7889, if it were to remain within the falling red channel, wouldn’t happen until Feb 2020.
The only strong downside candidate from a charting standpoint would be a drop to the bottom of the large white channel and backtest of the broken purple channel top at the purple .786 Fib in Jun 2021 — an outcome that would almost certainly require Brexit to be unraveled.
On the upside (GBP weakness) the most logical target is back to the white midline as it intersects the falling red channel top around .8989 in Oct-Nov 2019. This would suggest that the recently agreed upon 6-month extension results in at least an interim failure.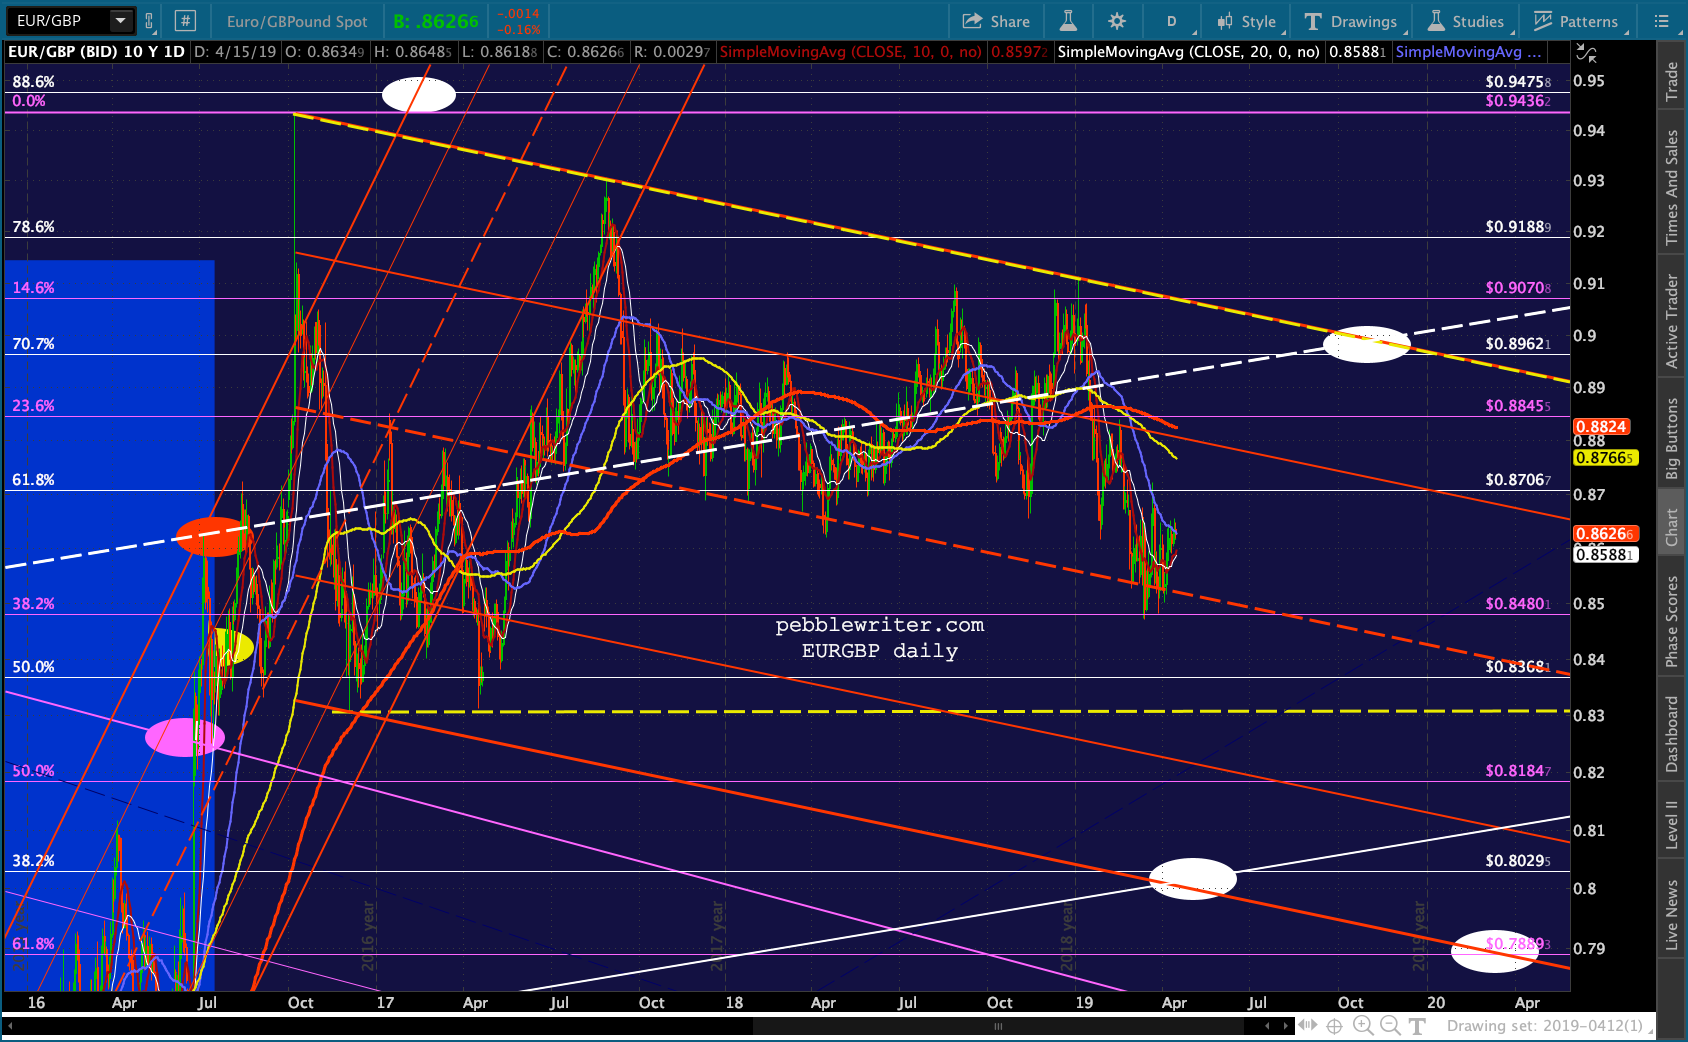 If the pair were to break out of falling red channel, then the most obvious target would be the .886 at .9475 which was nearly reached in 2016.
Obviously, this pair isn’t operating in a vacuum. While the GBP’s fate is partially responsible for how the pair trades, the other half of the equation is the nonsensical strength of the euro. 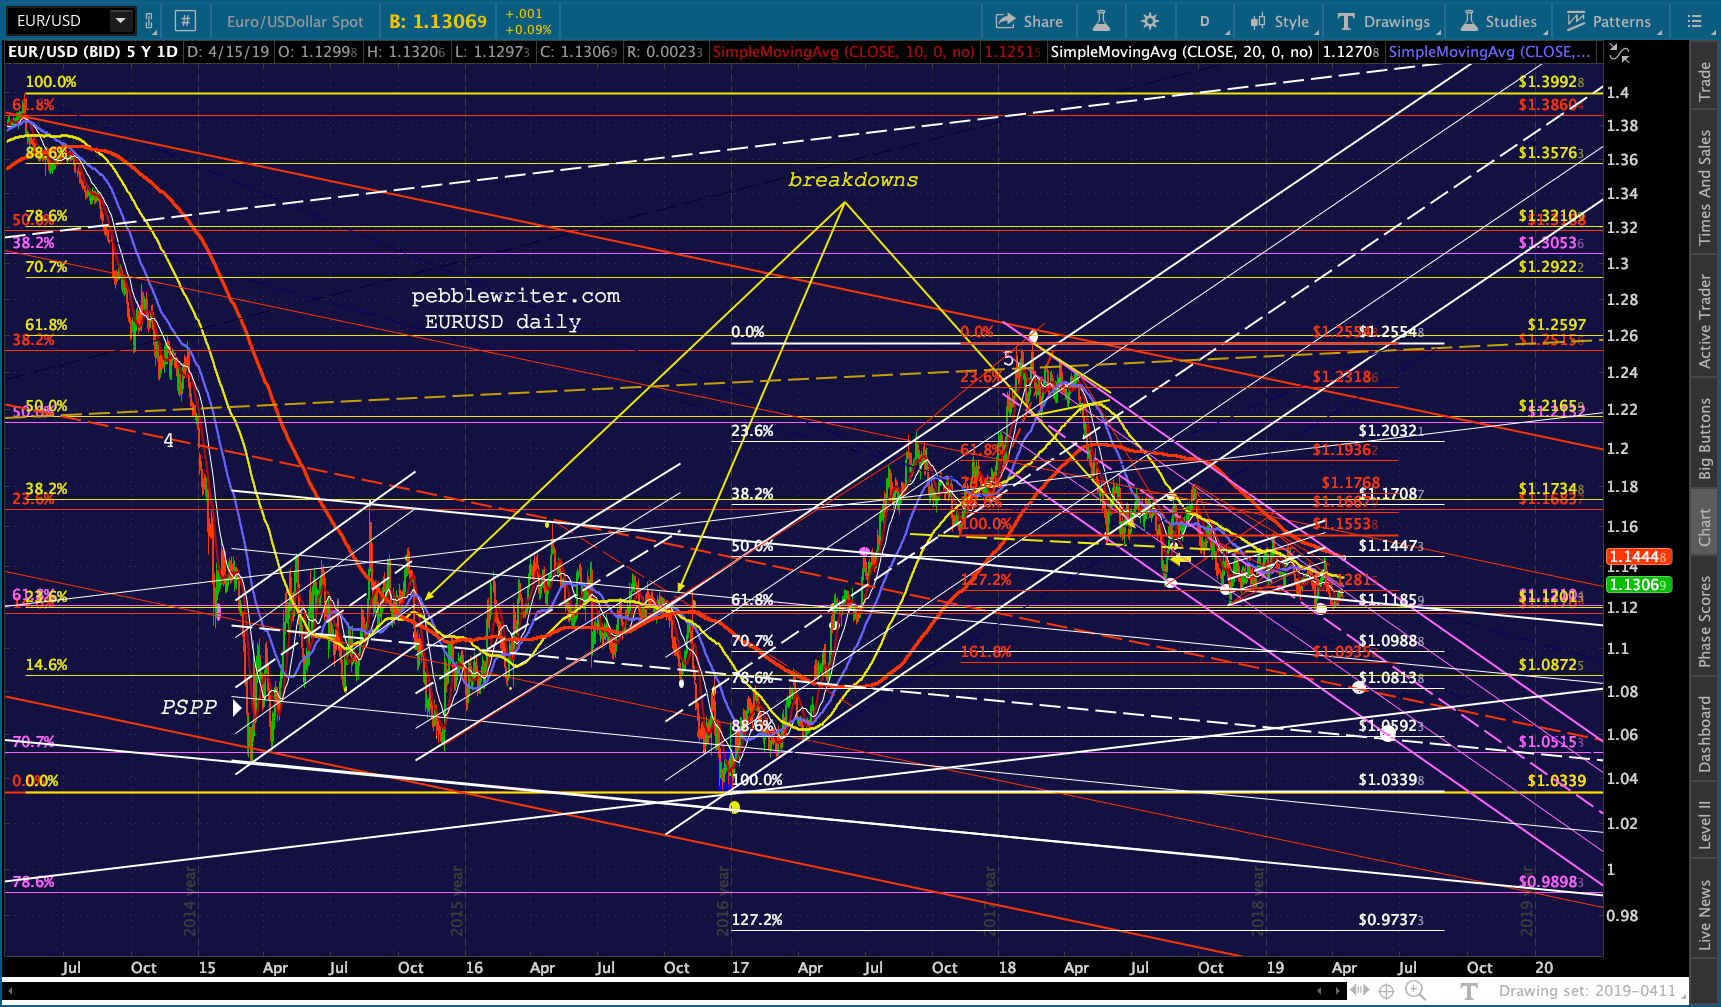 Consider the EURUSD, which has broken down from its third rising channel in the past four years — but, refused to drop below a backtest of the falling white channel. By the same token, it has failed to bounce up and backtest the SMA200 since plunging through it in Apr 2018.
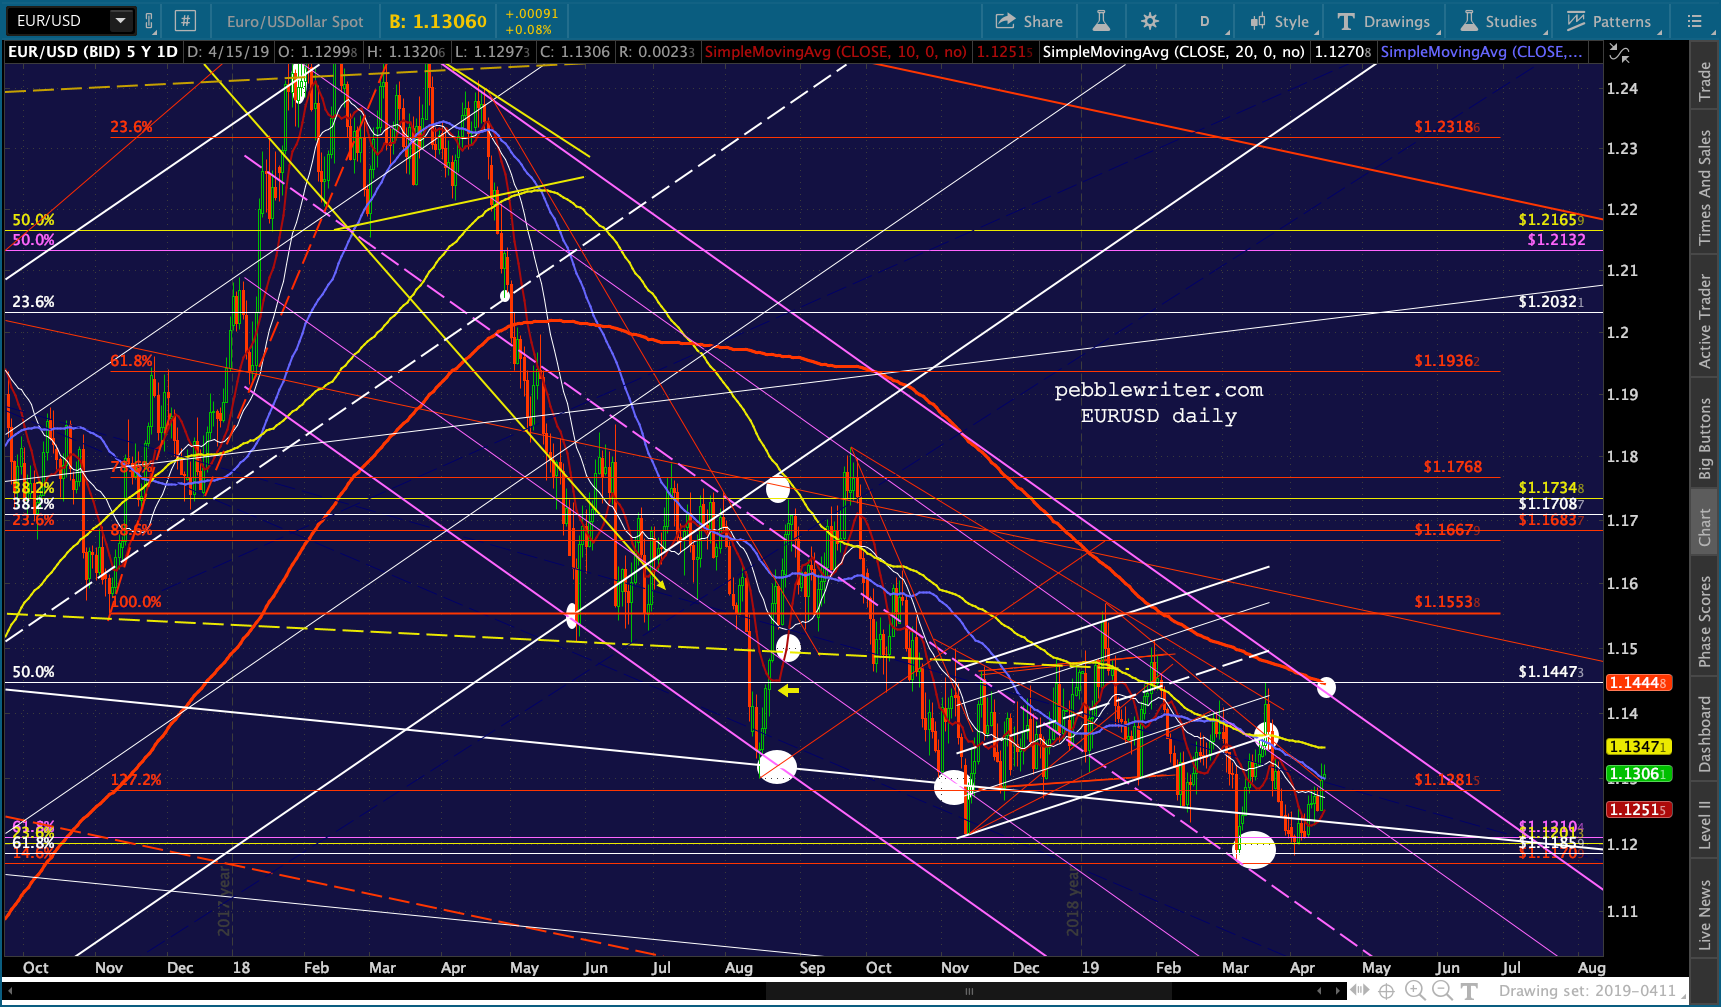 I think it’s safe to say that central bankers have found a tight trading range they are comfortable with and would are doing what is necessary to keep the pairs contained within that range.
This same situation may also be seen in the USDJPY, which has been consolidating since 2015…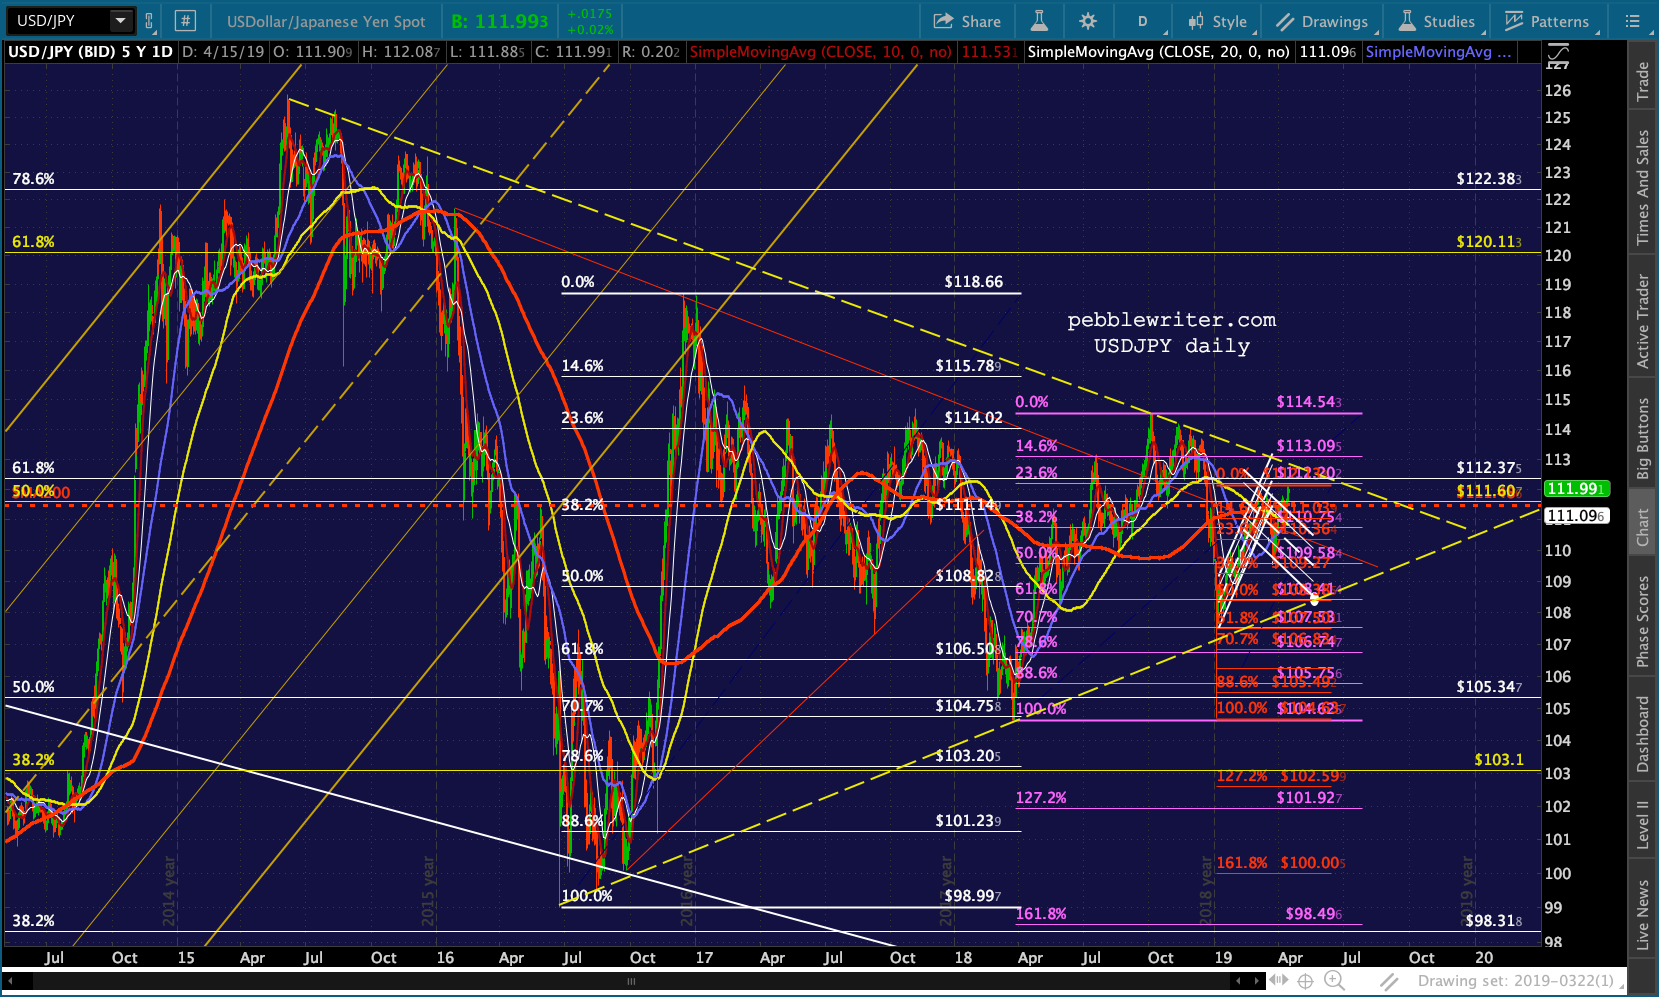 …after breaking out of a massive falling channel in 2014. The rising red channel broke down – bearish – but the breakdown resulted in a backtest of the huge white channel — bullish.
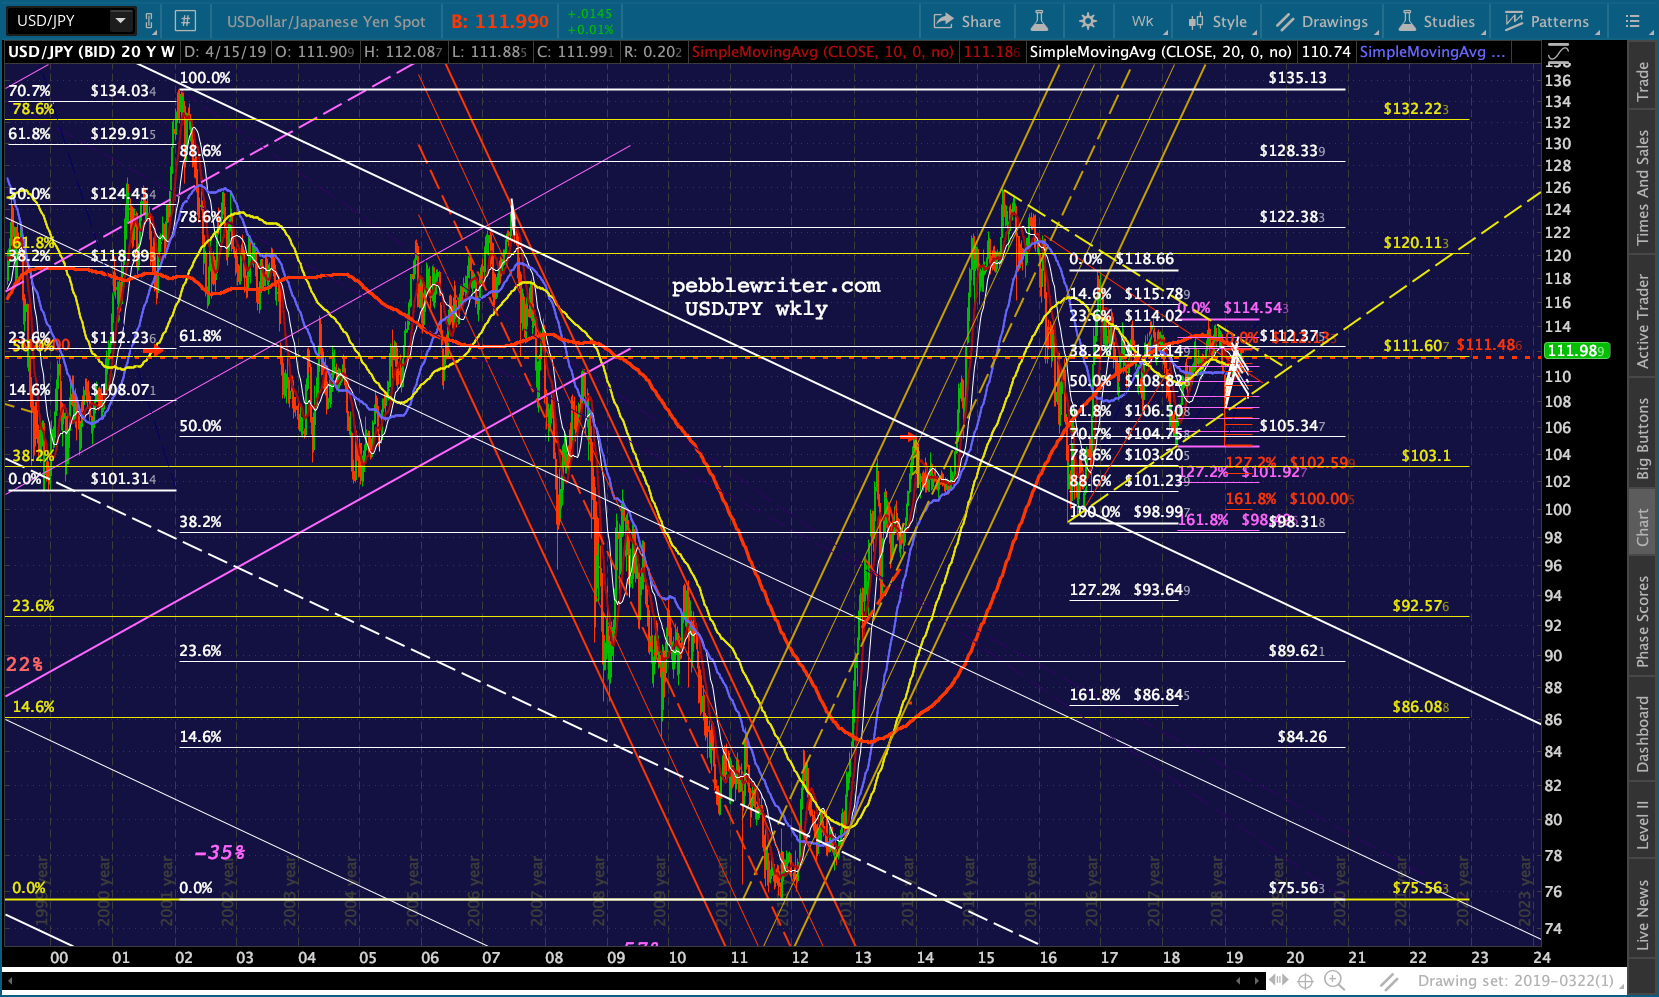 Bottom line, the currency markets are coiling — which, by definition, implies an explosive move sooner or later. For the EURUSD, the precedent since 2015 has been that once rising channels break down, there has been a sharp drop. Since it broke down in July 2018, we have been expecting a further drop. So far, it has been muted.
Compare EURUSD to EURGBP, a massive divergence can be seen. EURUSD (the thin purple line) has continued to decline while EURGBP has been on a very different path.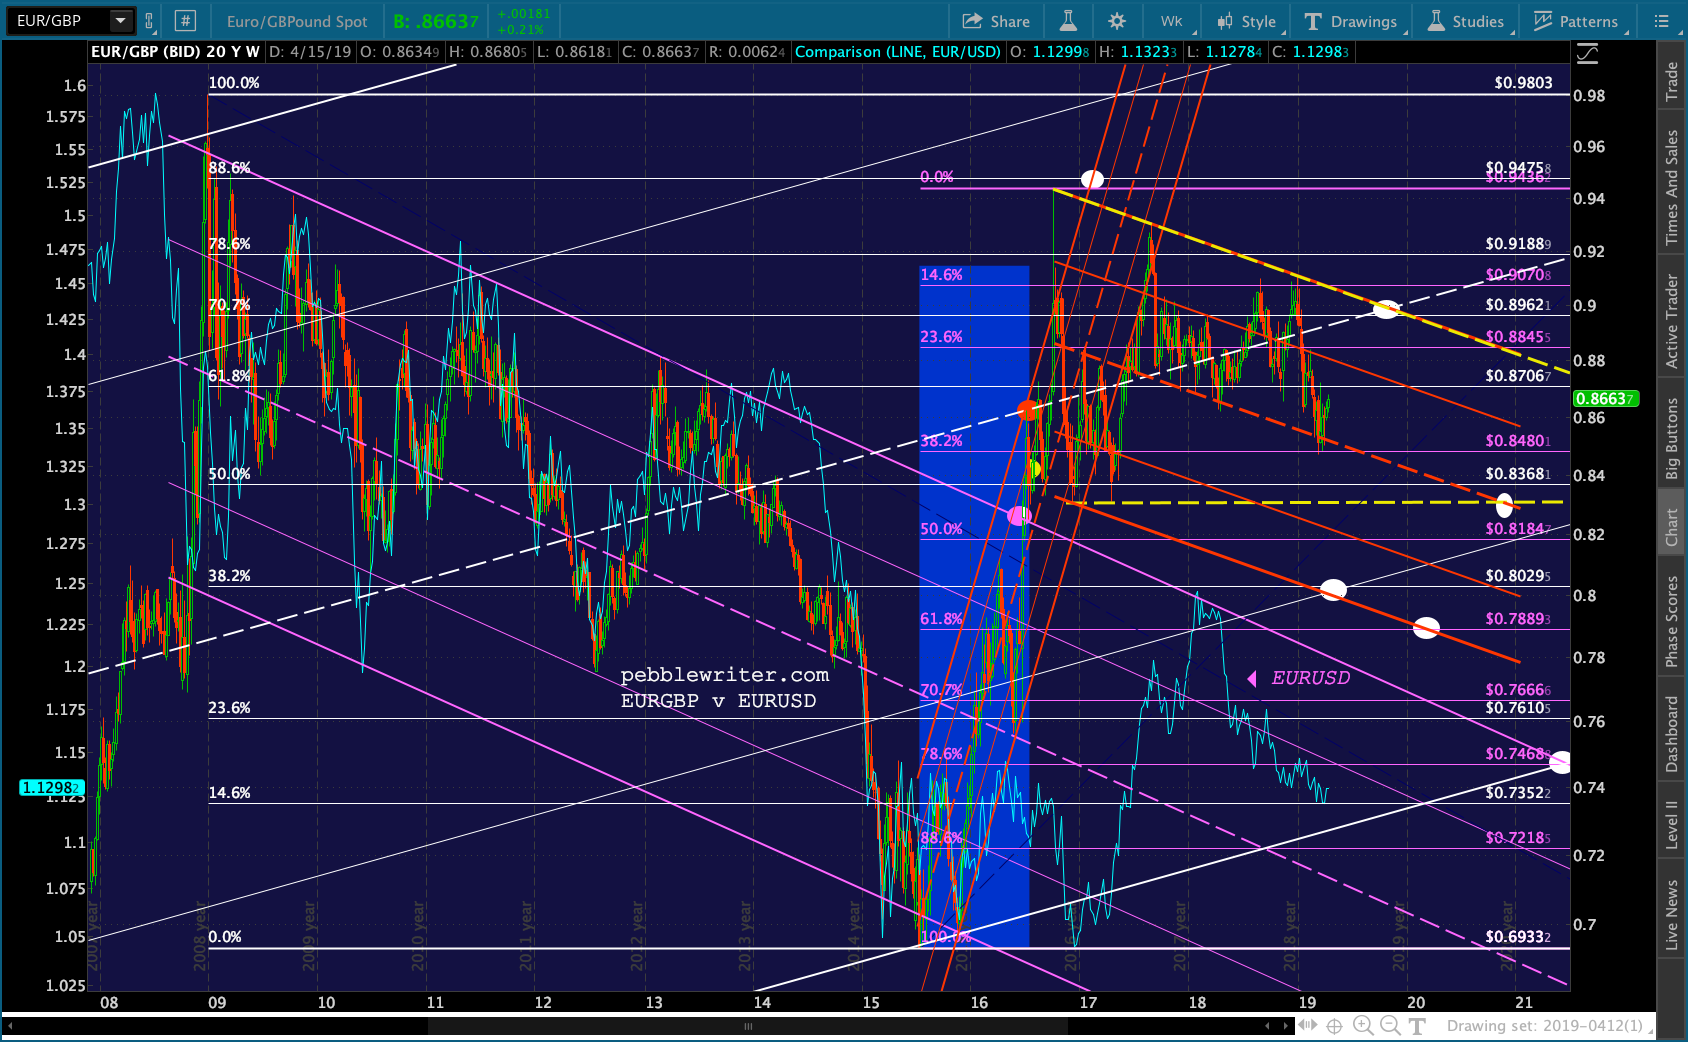 Though, they have been pretty well correlated since October — peas in a pod thanks to the dollar’s persistent strength.
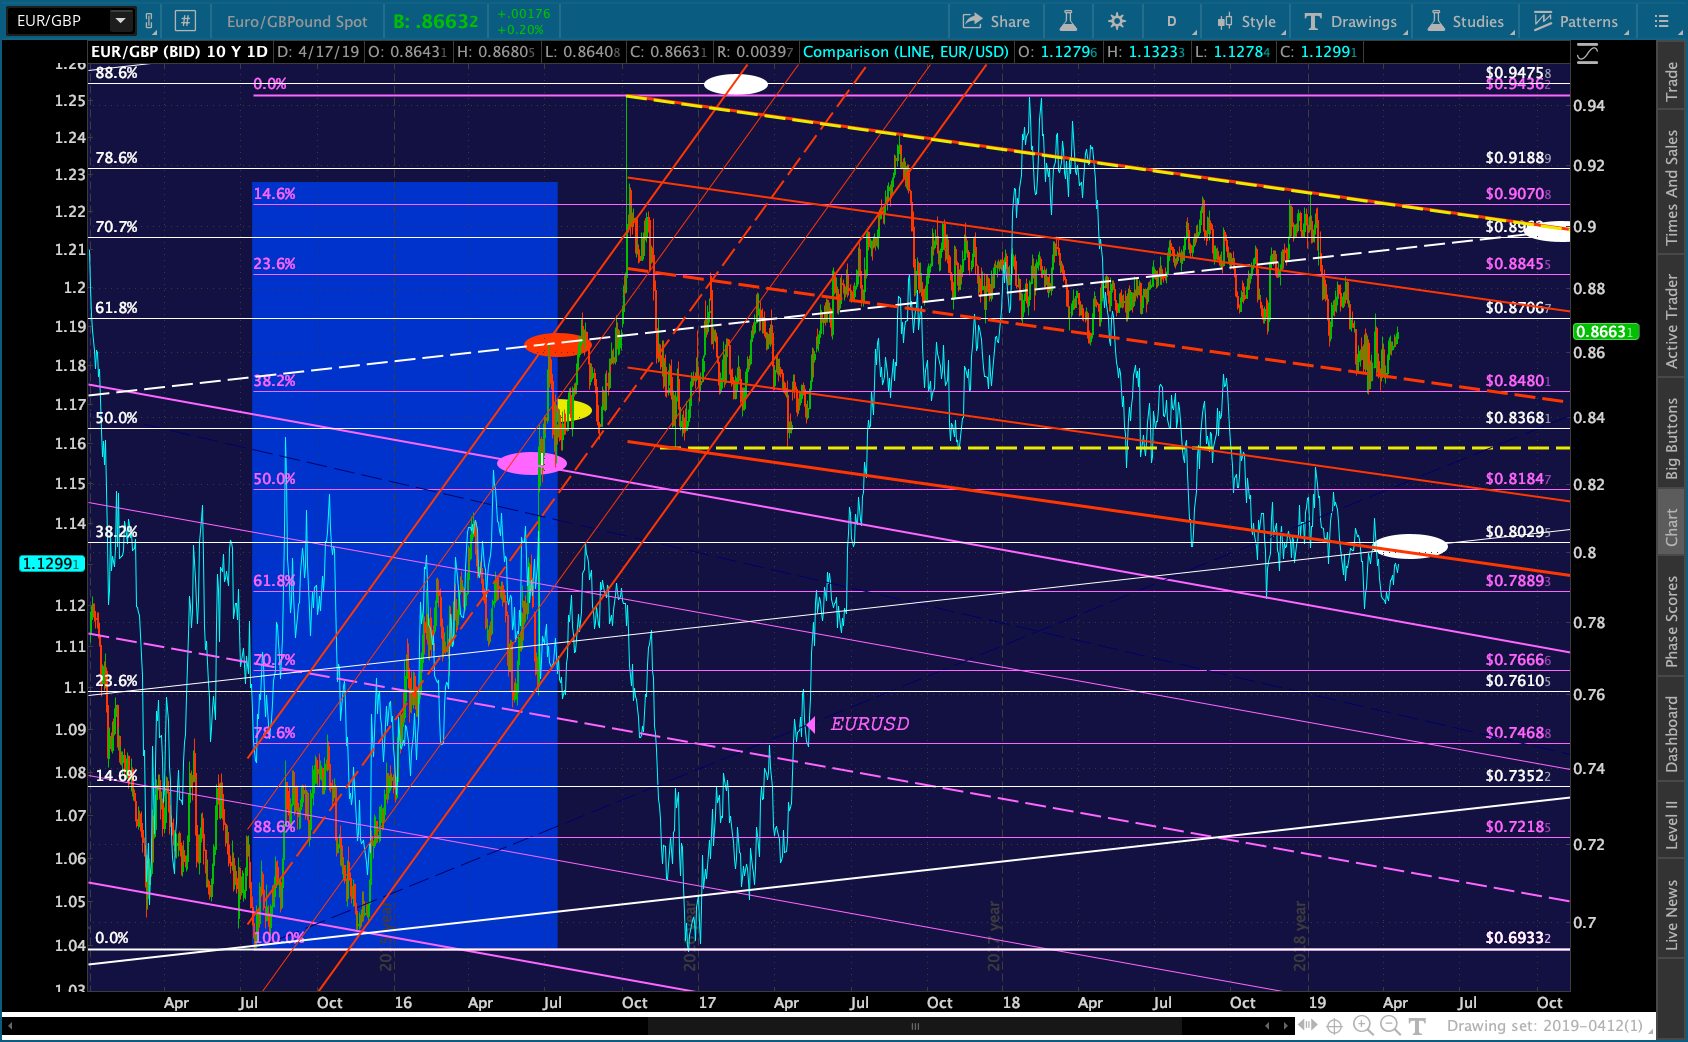 If as I suspect, TNX and DXY face another downturn, we could see EURUSD and EURGBP both rally up to backtest their SMA200s — provided Brexit is further delayed. If/when the separation does occur, we should expect the GBP to suffer the most and for the divergence between EURGBP and EURUSD to widen as EURGBP tests the red channel top and, potentially, the .886 at .9475.
* * *
Meanwhile, it’s Monday and the rest of the market is about to open to little fanfare. Futures are essentially flat following what looked like a breakout of sorts on Friday.
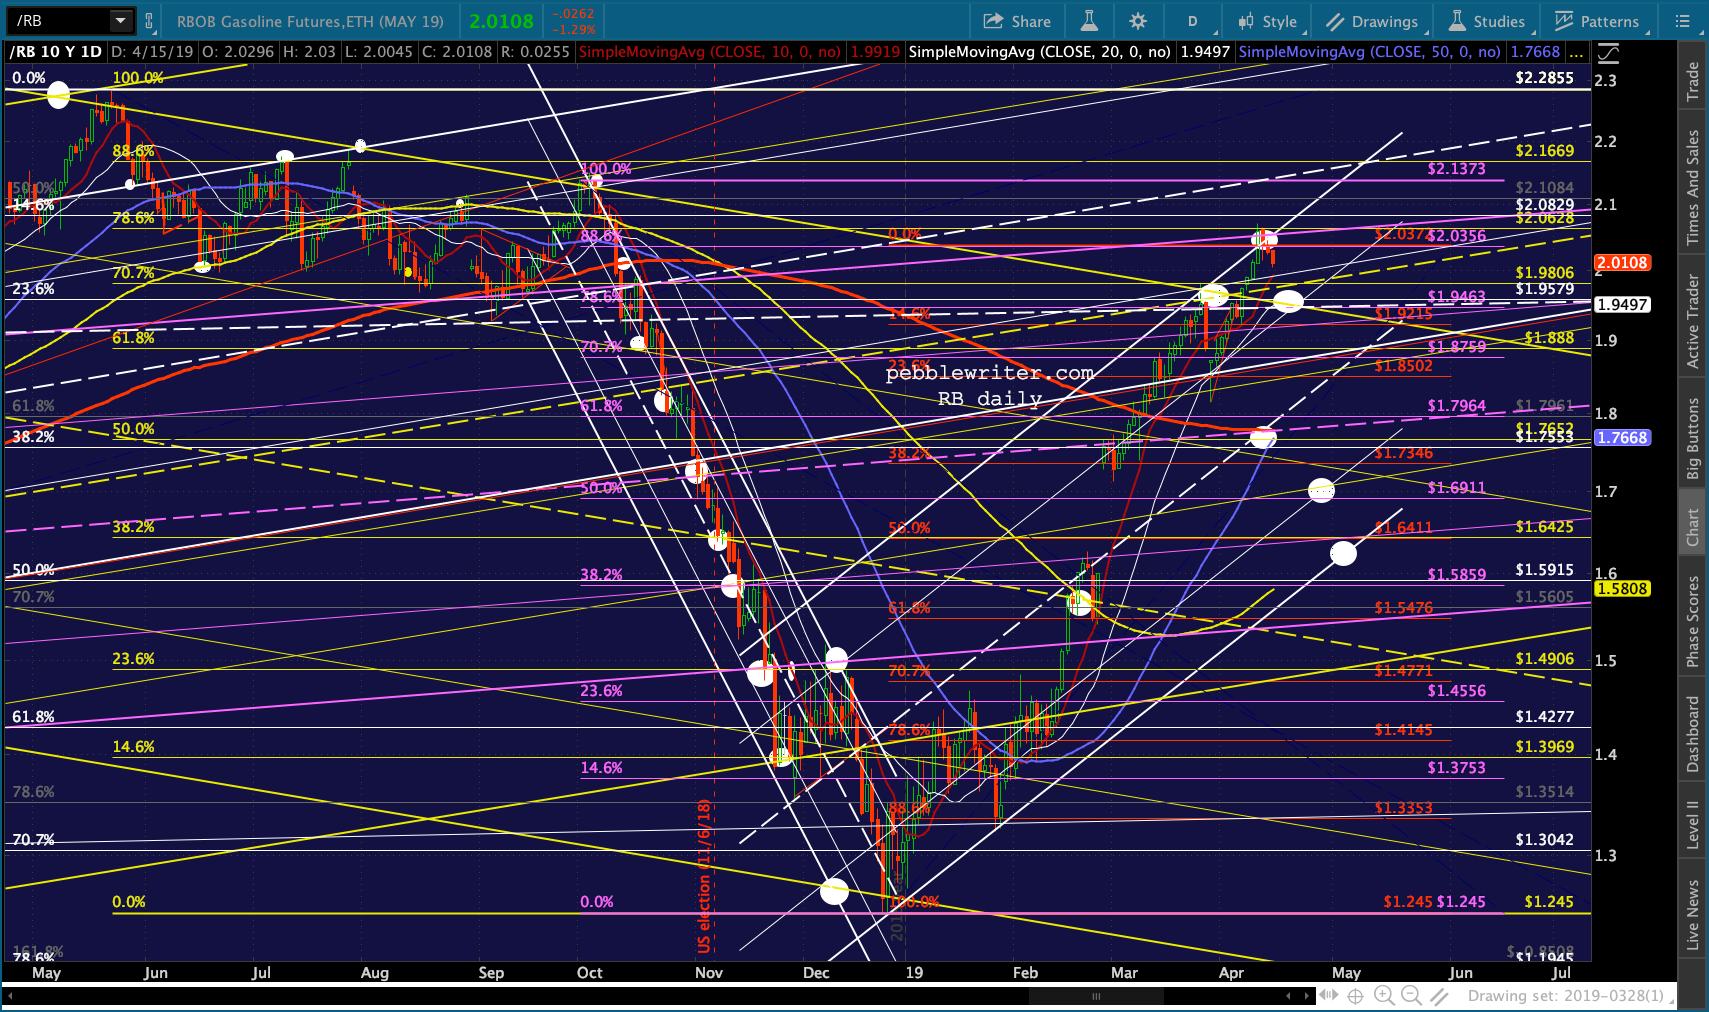
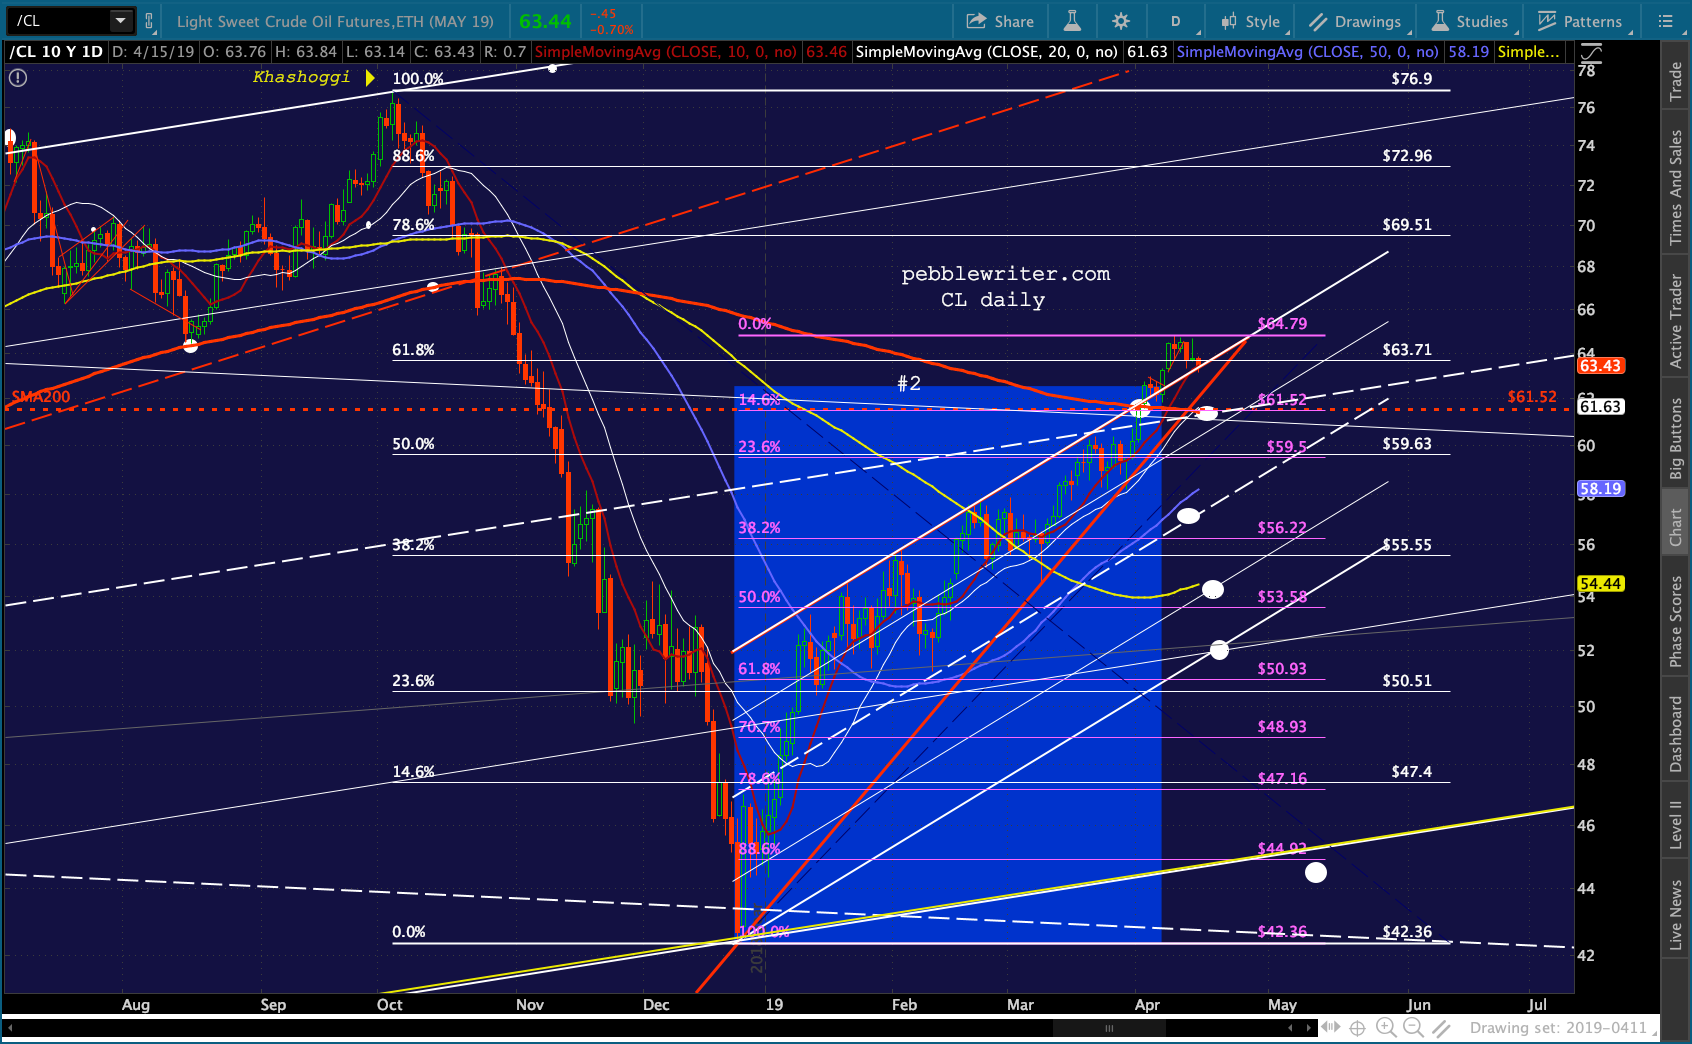
RB and CL are backtesting.
 VIX has bounced off its channel bottom.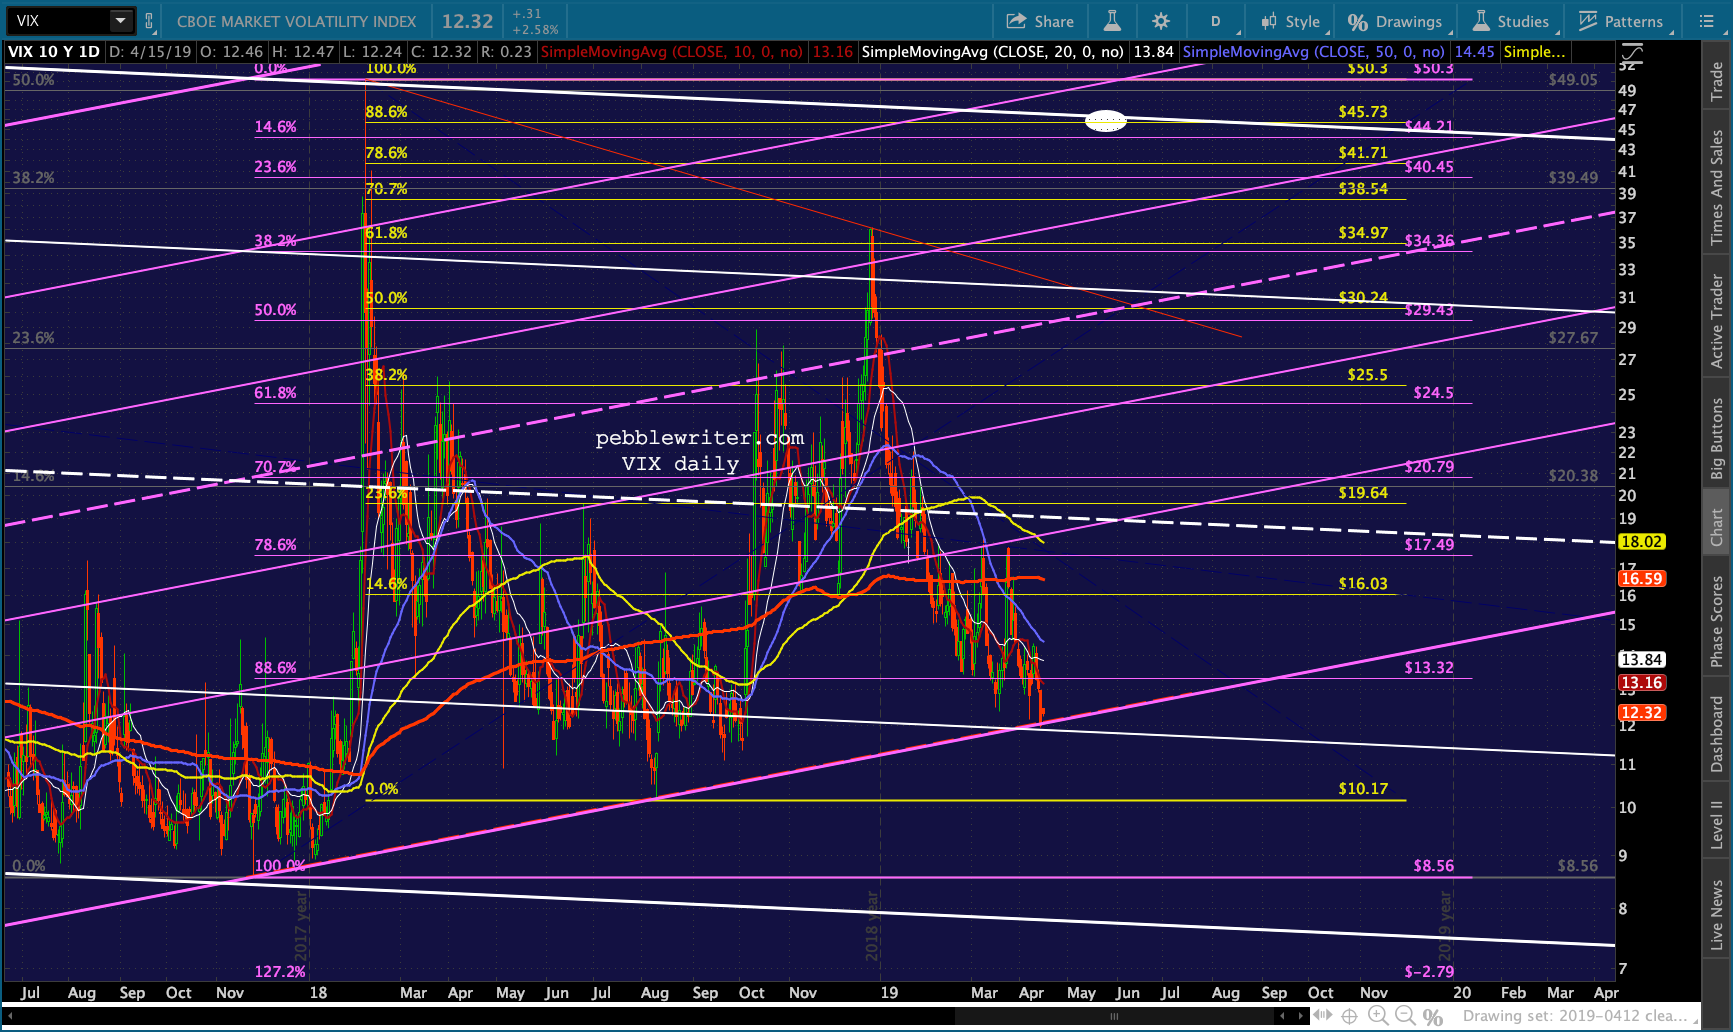
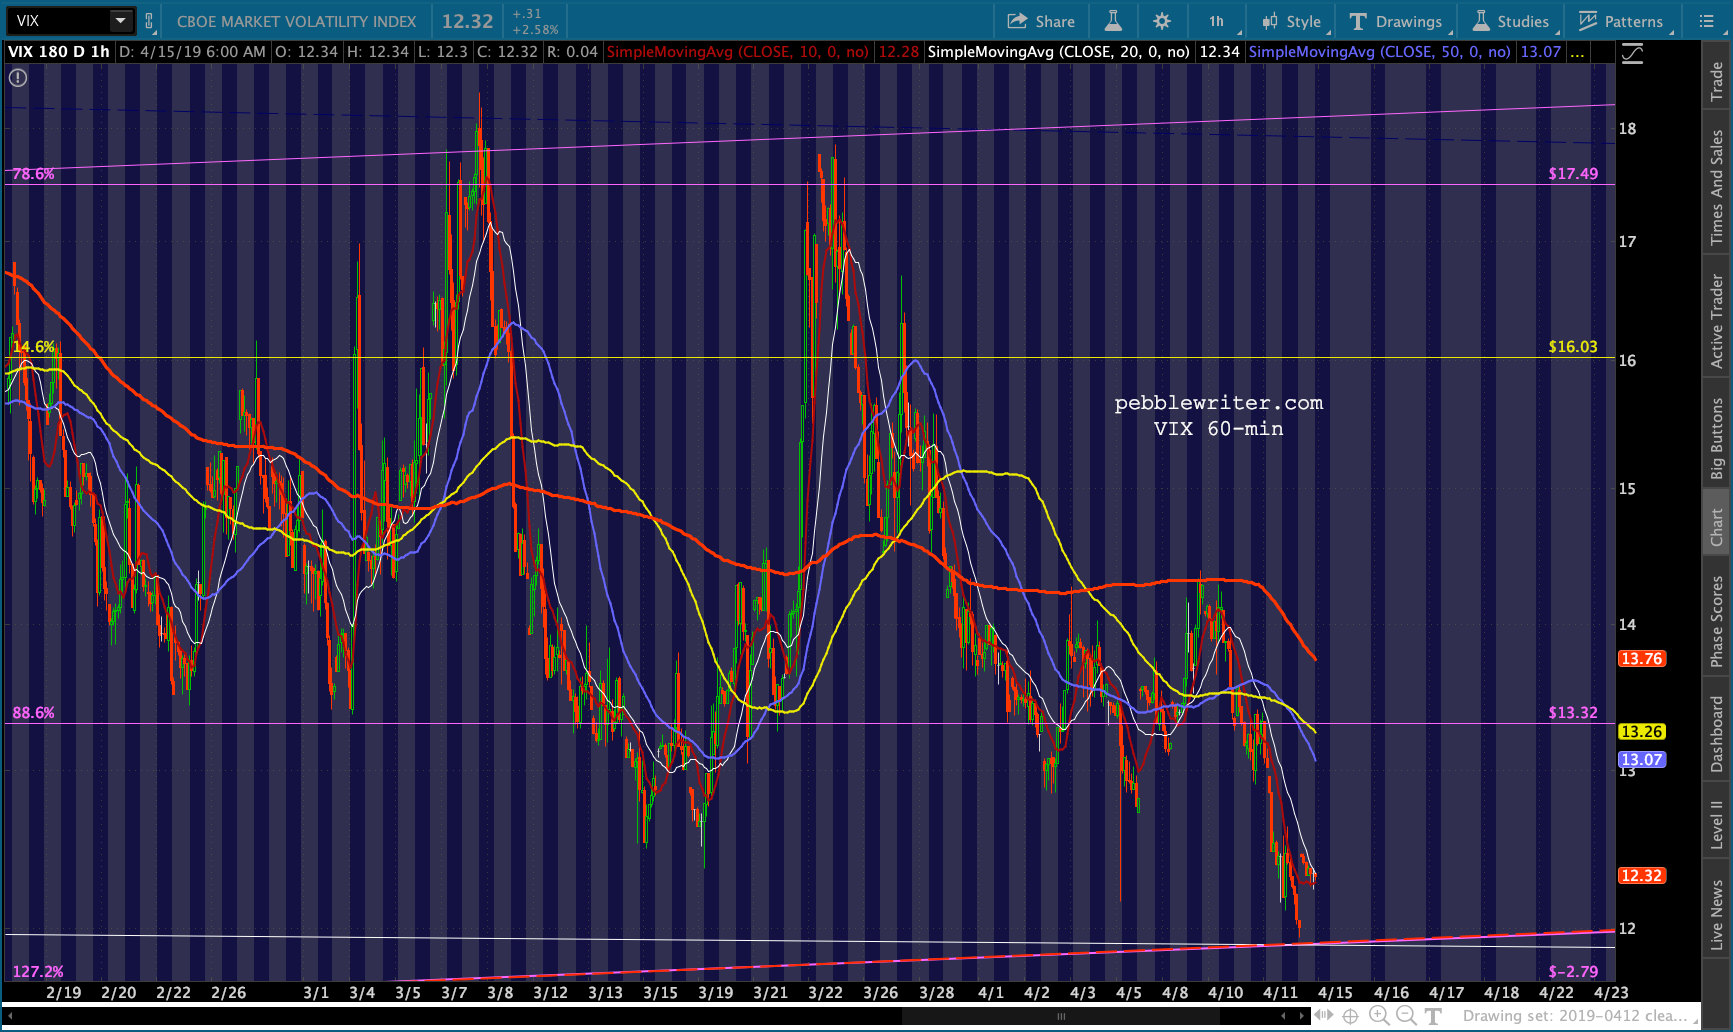
The most important chart today.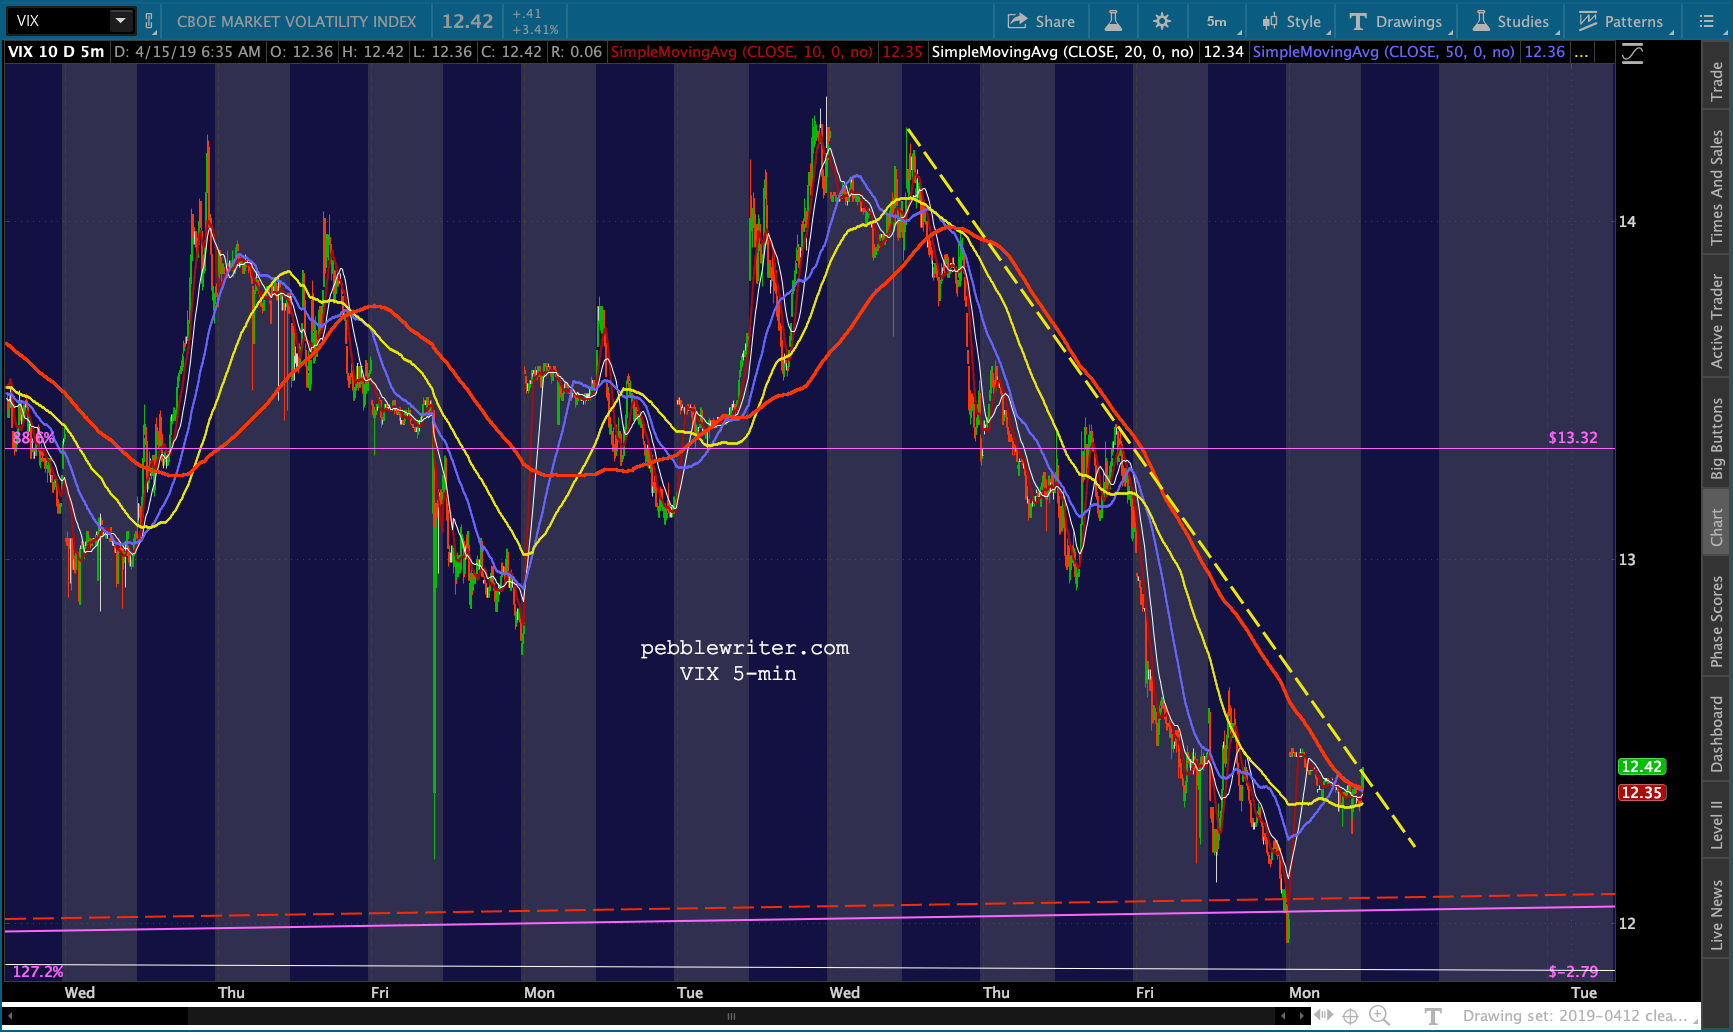 And, ES has bumped up against the purple TL.
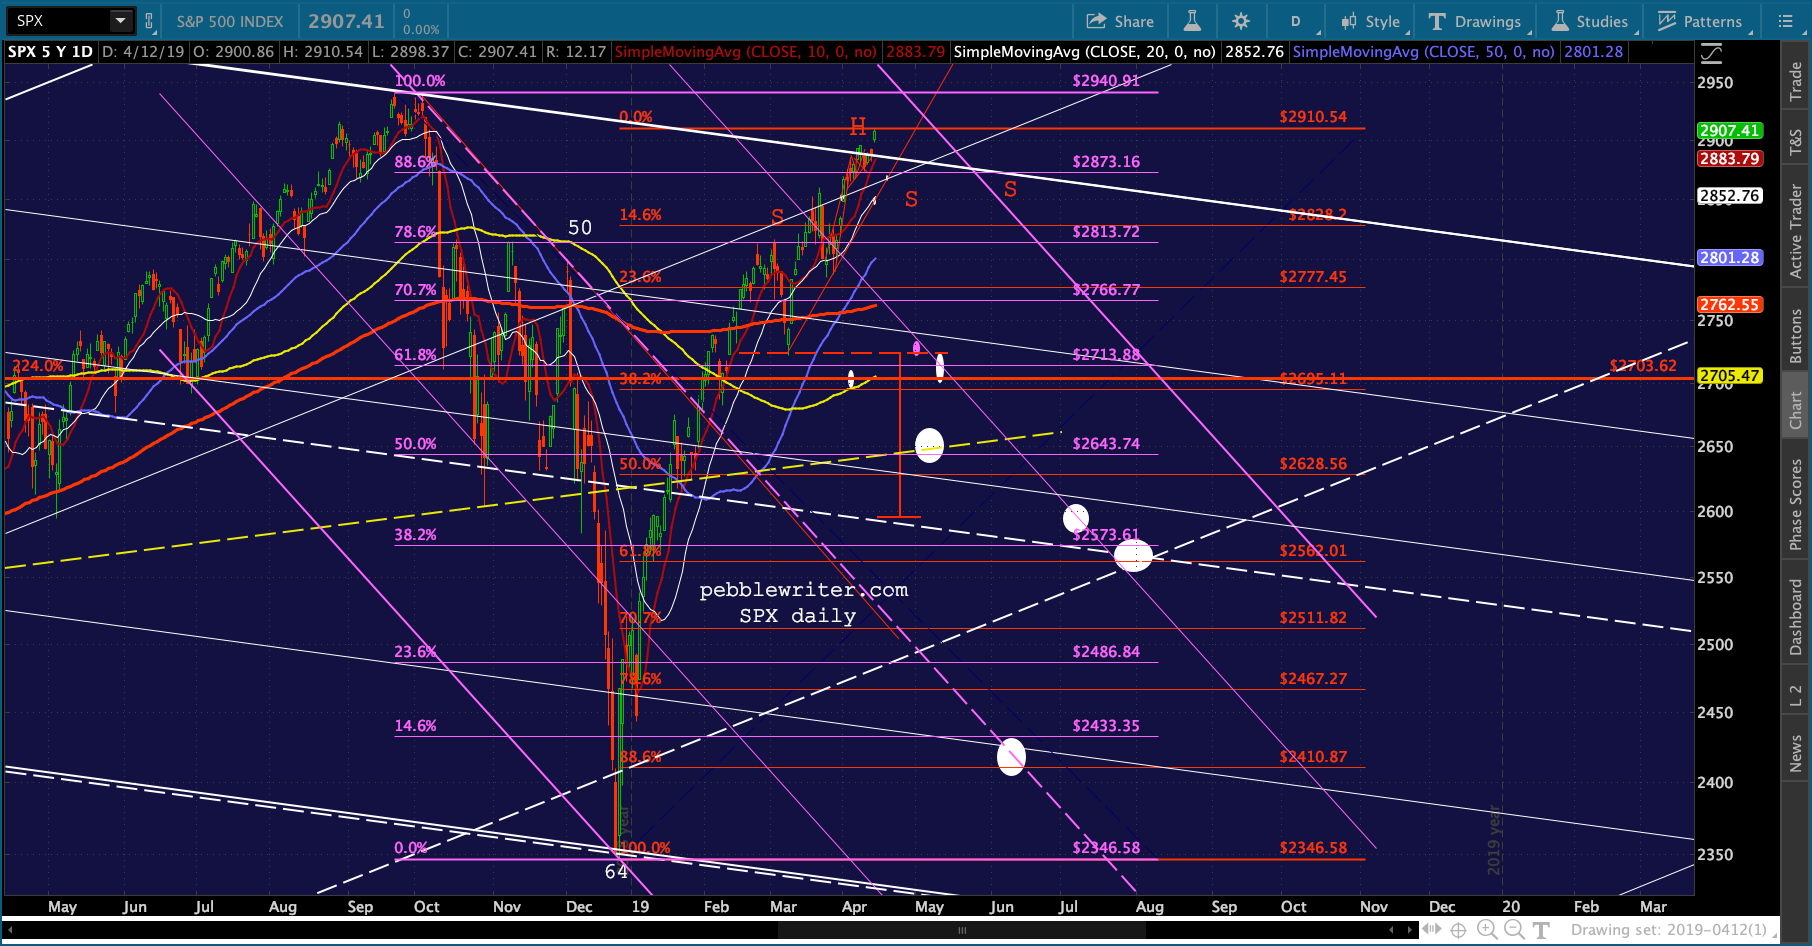
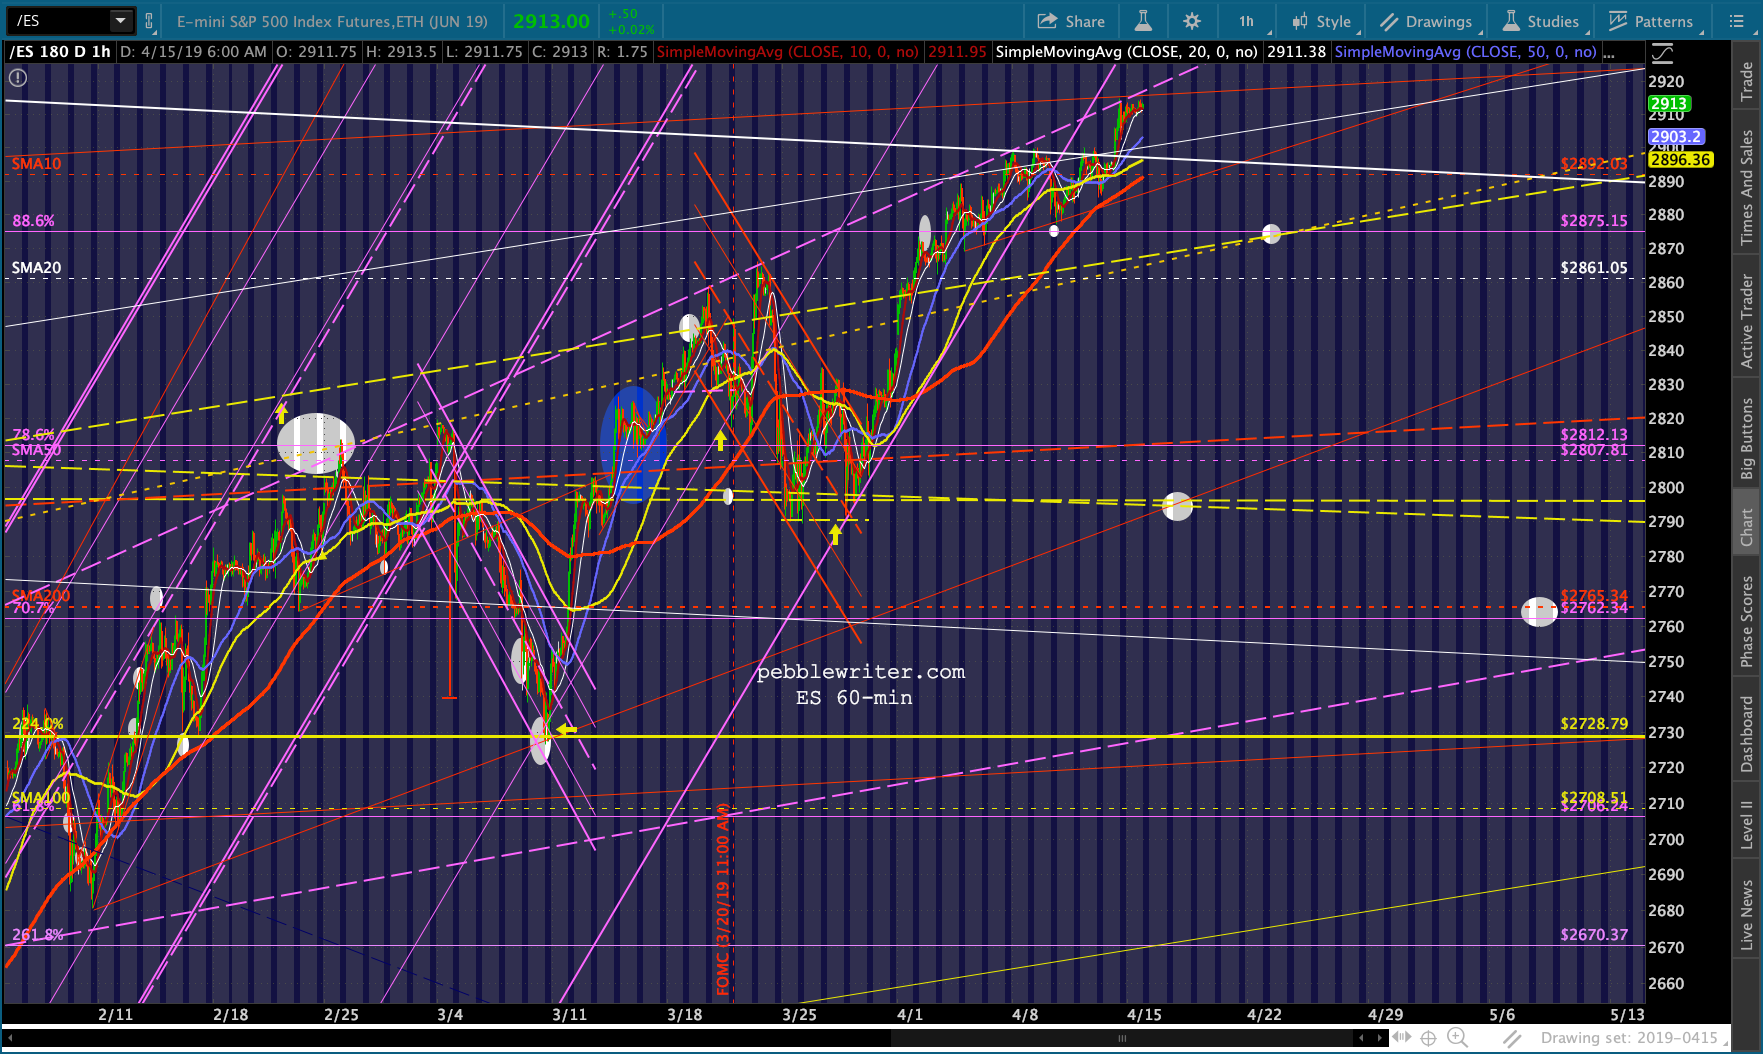 The SPX version…
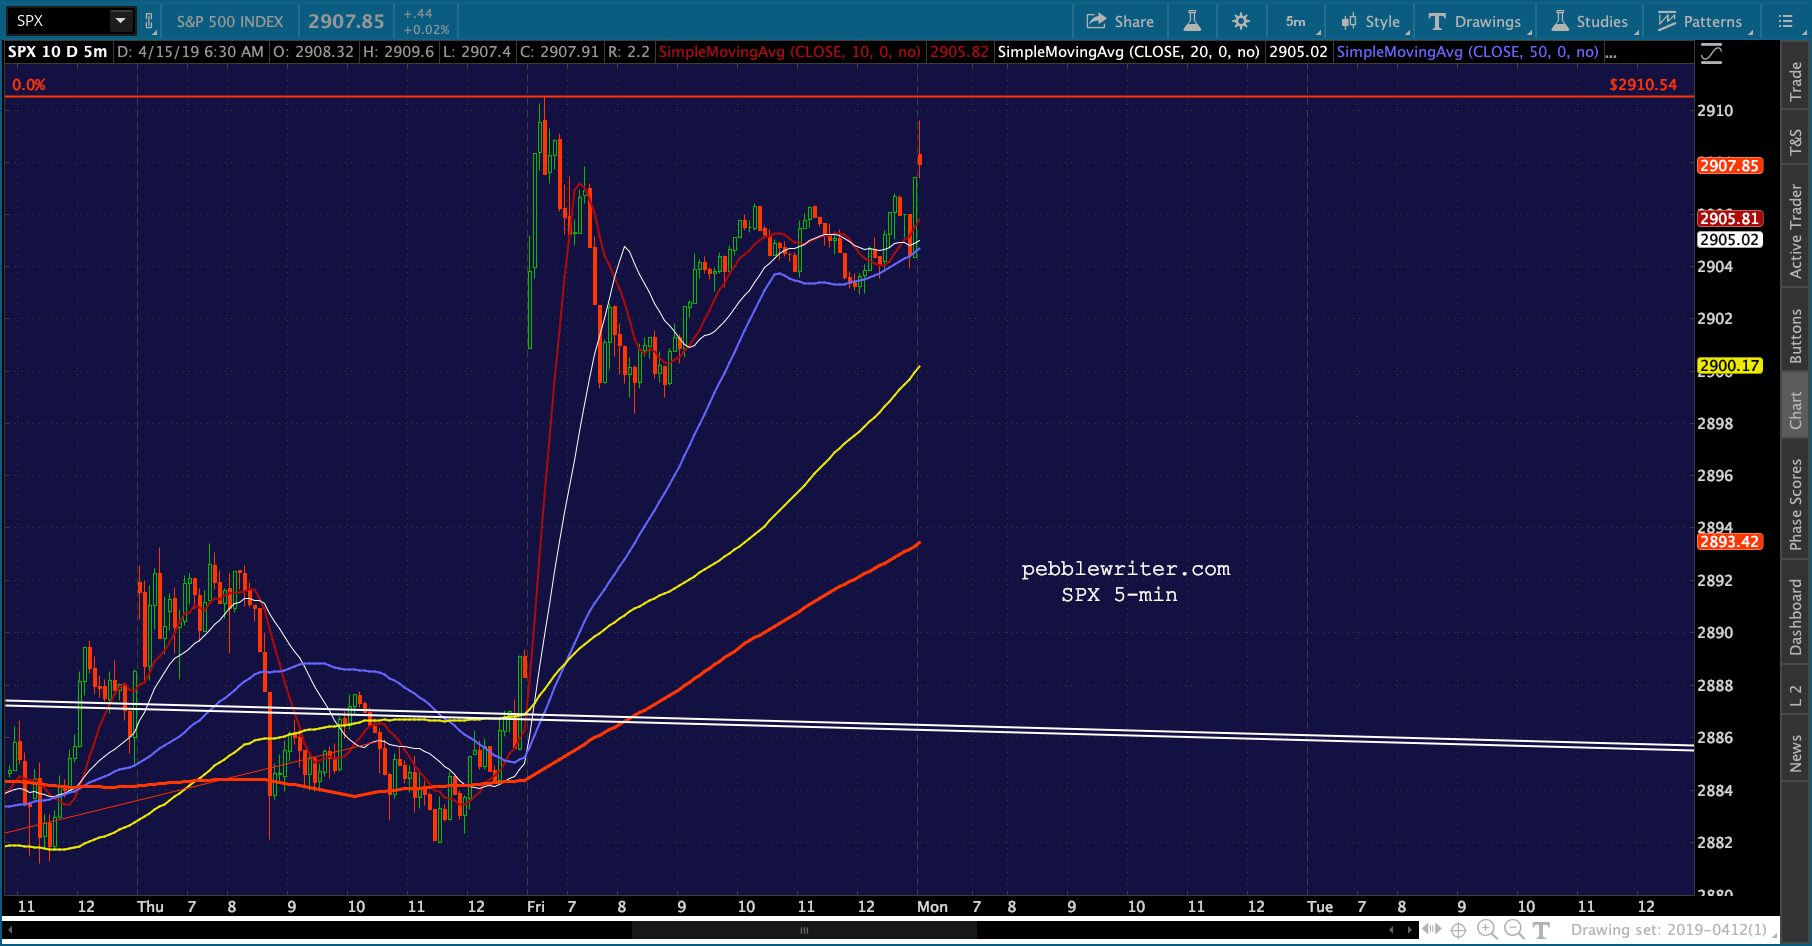
 …and the close-up, showing the gap at 2893.42.
 I’m going to take a break and watch the Boston Marathon go by. I used to love running marathons, but a series of knee injuries and surgeries over the years have turned me into an envious spectator.
More later.