

Today’s post could be an extension of yesterdays, with more beneficiaries of the shutdown such as Target and Lowes reporting big beats. Winners and losers.
Curiously, ES failed to make a new high yesterday even thoughy SPX briefly rose above its February highs.
 You’ve always had to worry about predatory traders and specialists trying to catch momentum traders offsides, pushing above resistance in order to stop out shorts and draw in fresh meat. These days, the players have expanded to include predatory HFTs, algos, central banks, the US Treasury, politicians, etc. The list of “interested parties” is long and distinguished, and most of them have access to plenty of free capital.
So, as we always ask when SPX reaches new highs: breakout or headfake?
continued for members…
That tingly feeling tells me it’s a headfake, but I’m certainly open to being wrong. The money thrown at the pandemic ravaged economy hasn’t really fixed the economy, but it has clearly reinflated the market bubble. As the saying goes, it will work forever – until it doesn’t. you don’t have to be a Kelpian to appreciate the downside risk if the narrative comes apart.
I’ve shown the chart below a few times lately. The shaded rectangle represents the time and distance SPX would need to fall if the intersection of the 2.618 Fib and white channel bottom is to be tested. Otherwise, the rising white channel would need to break down in order to accommodate a drop to 3047. 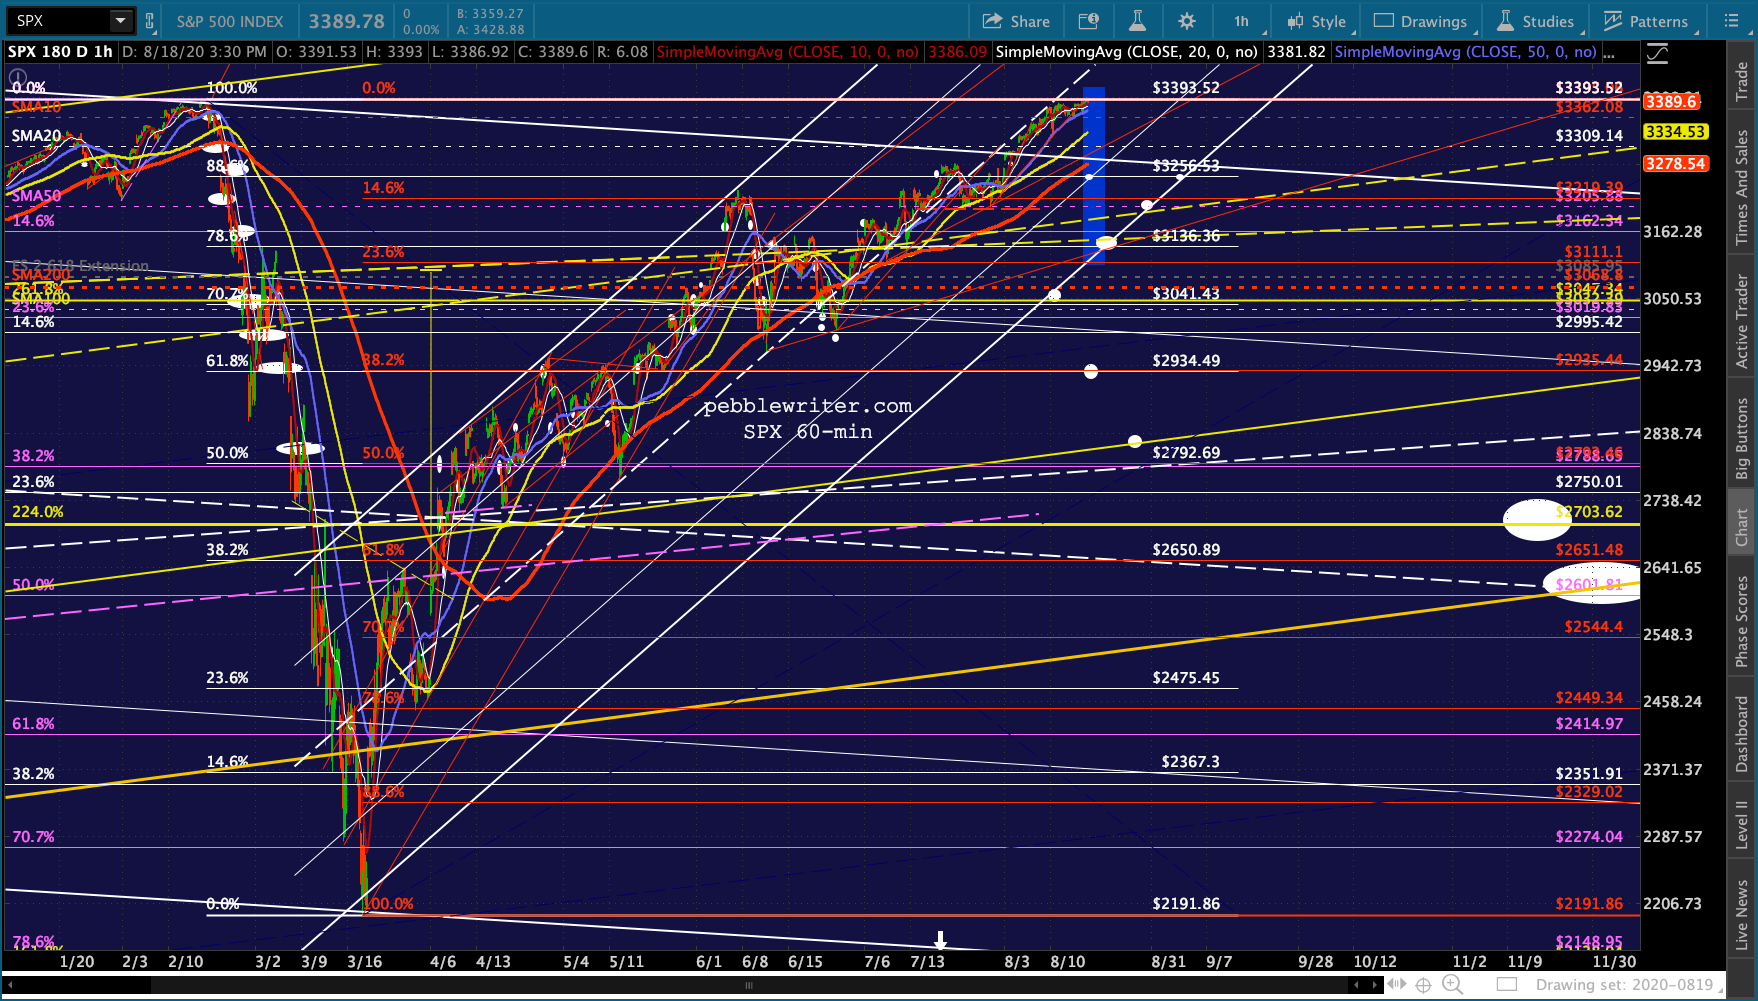 The close-ups:
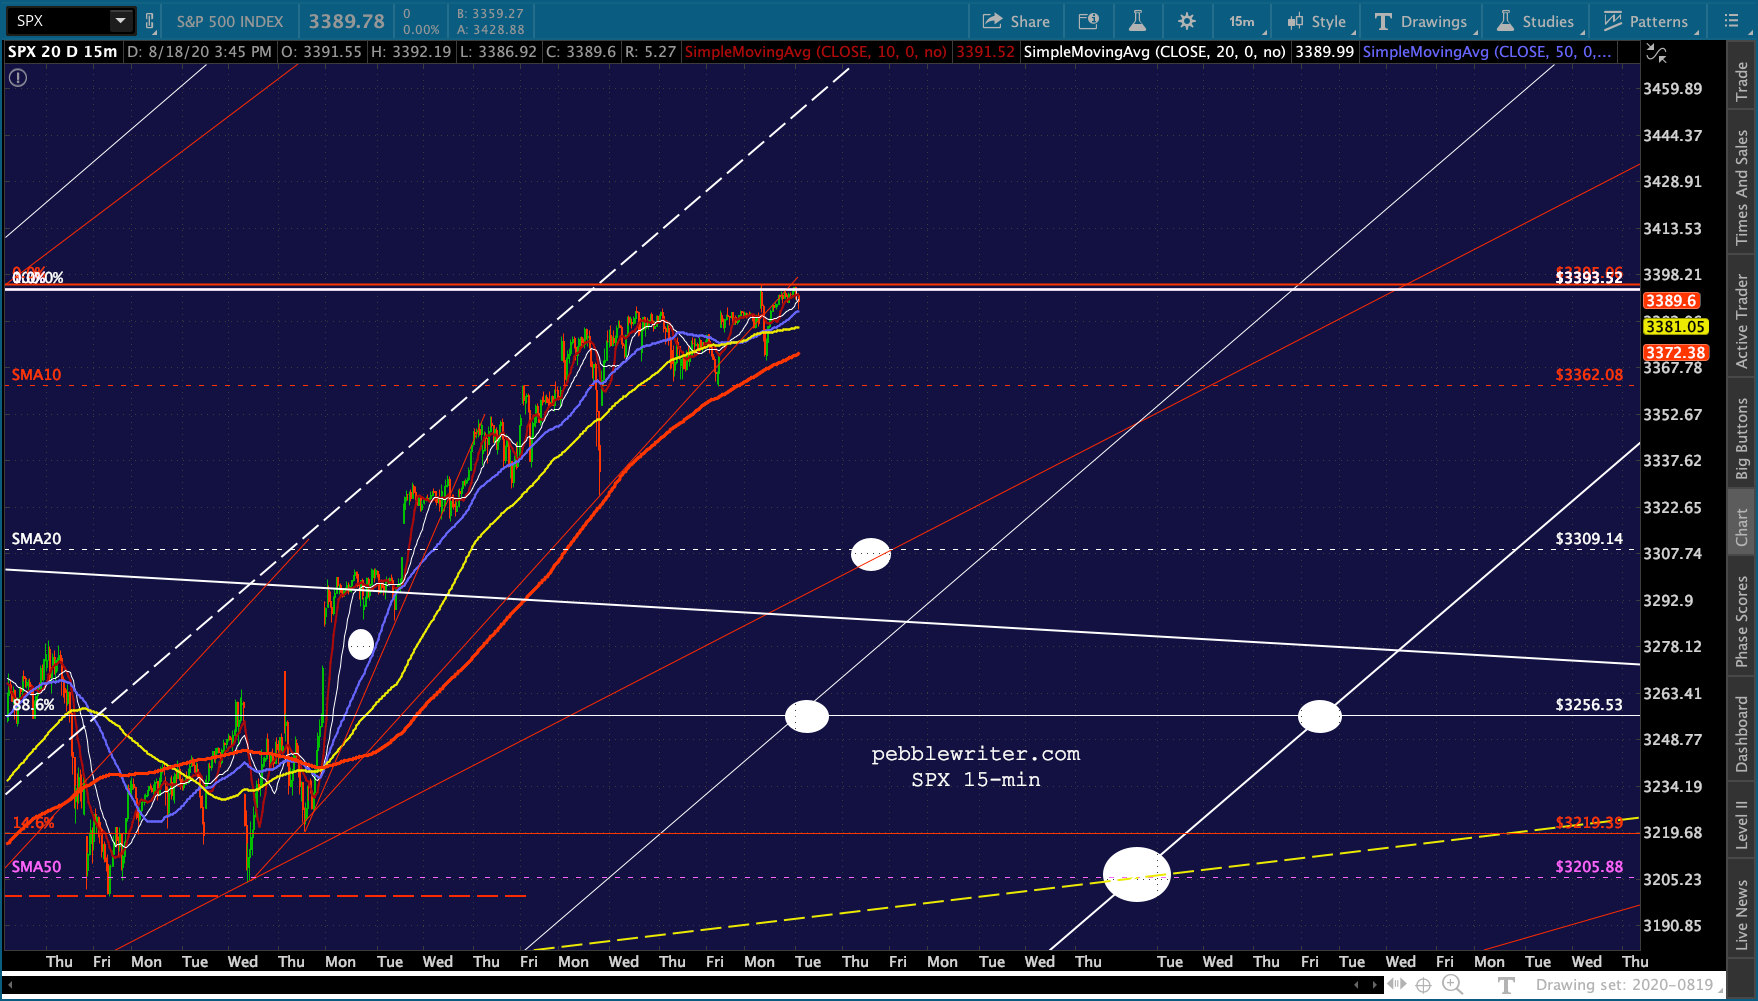
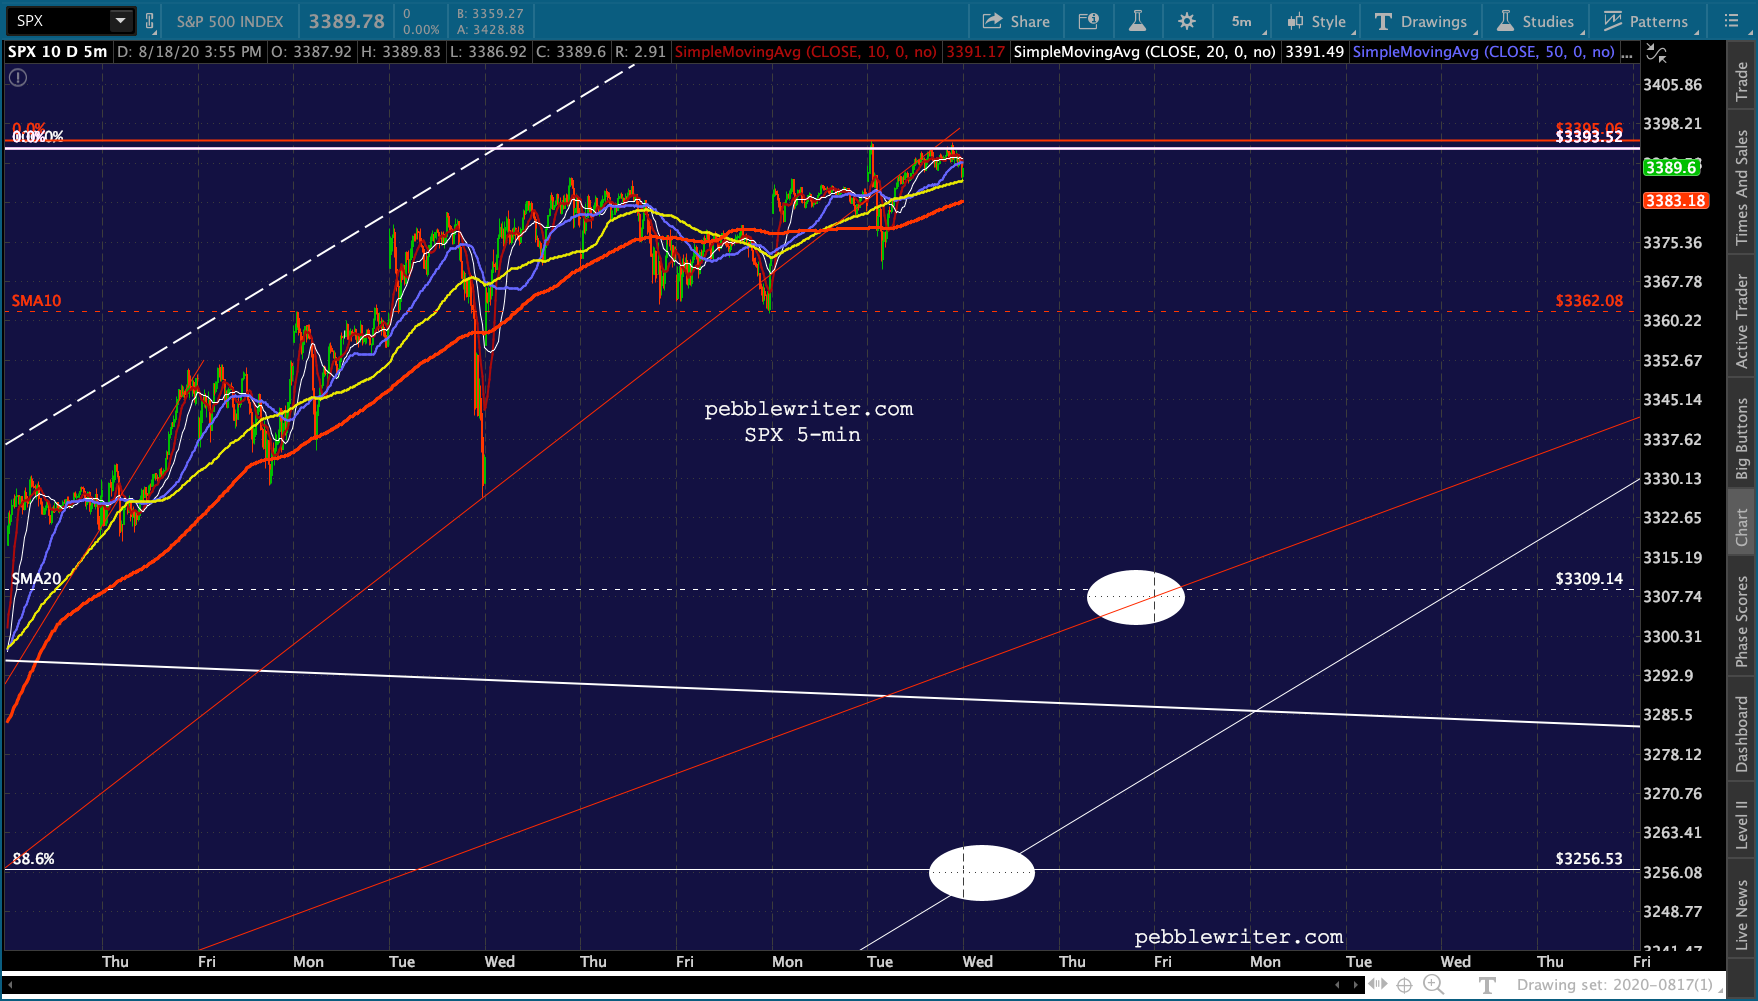
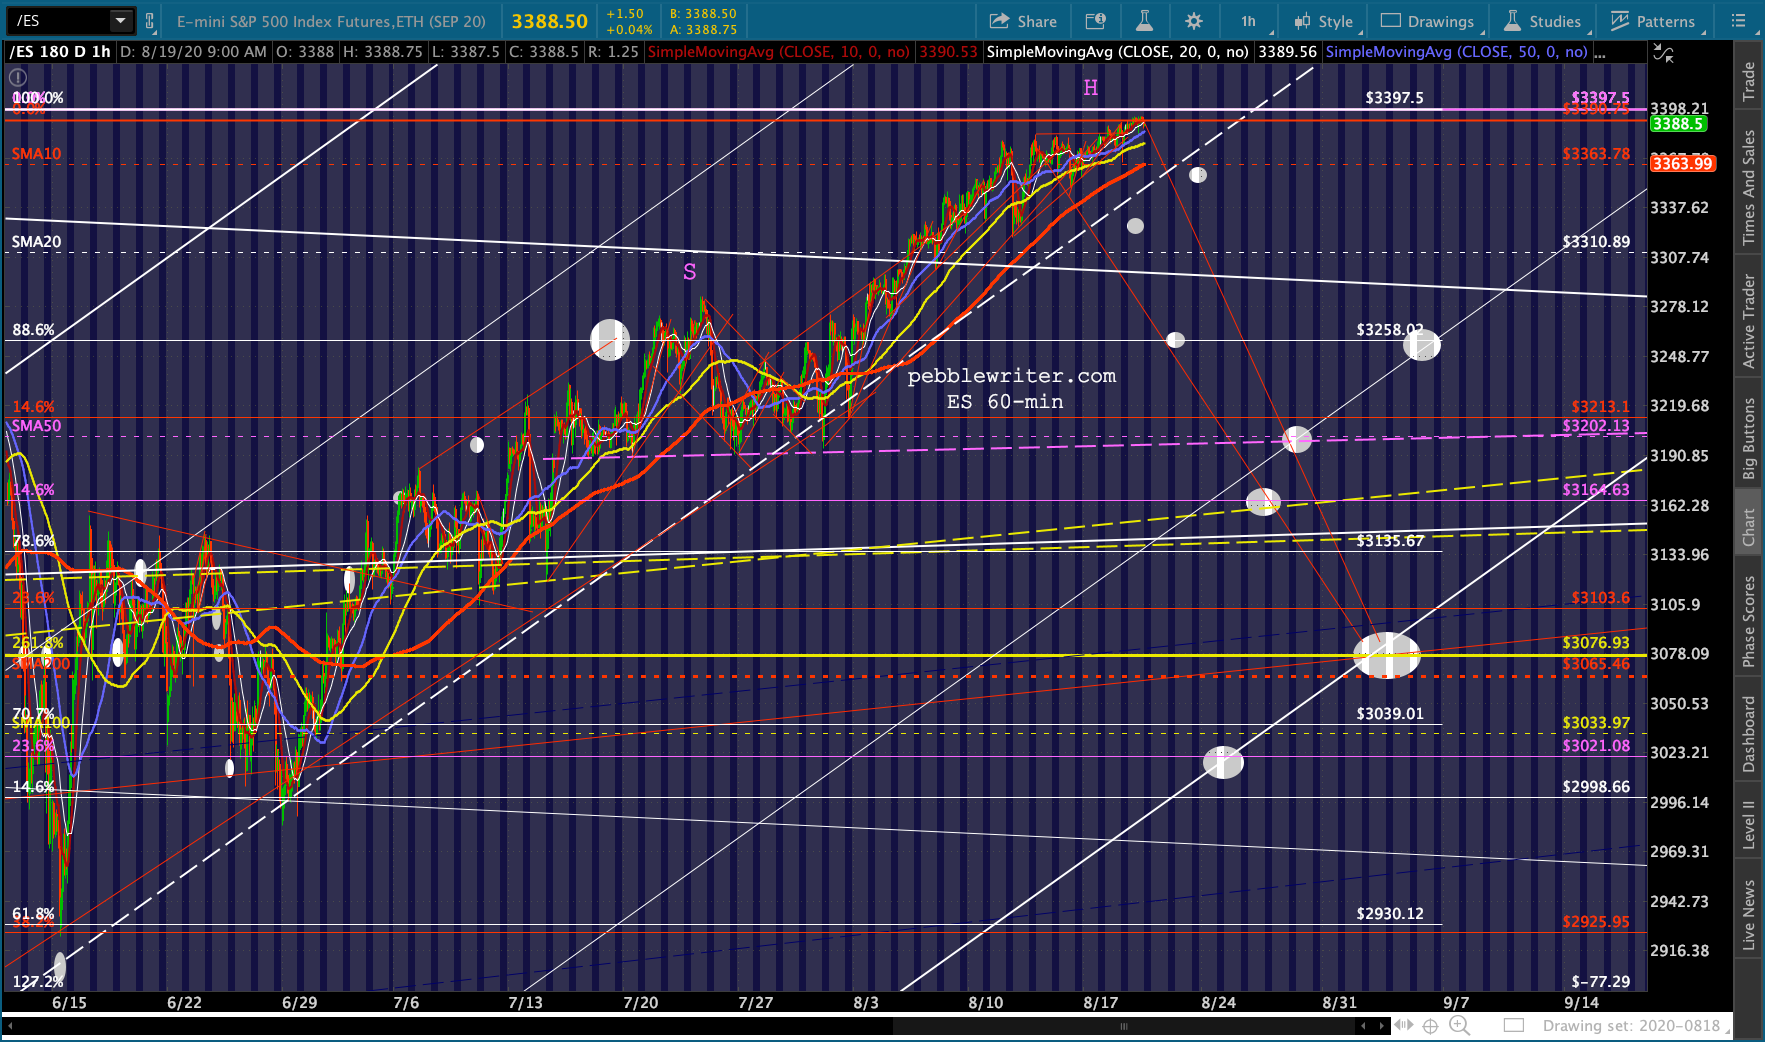
 The ES version of the 2.618 Fib backtest and a potential falling wedge that would get us there:
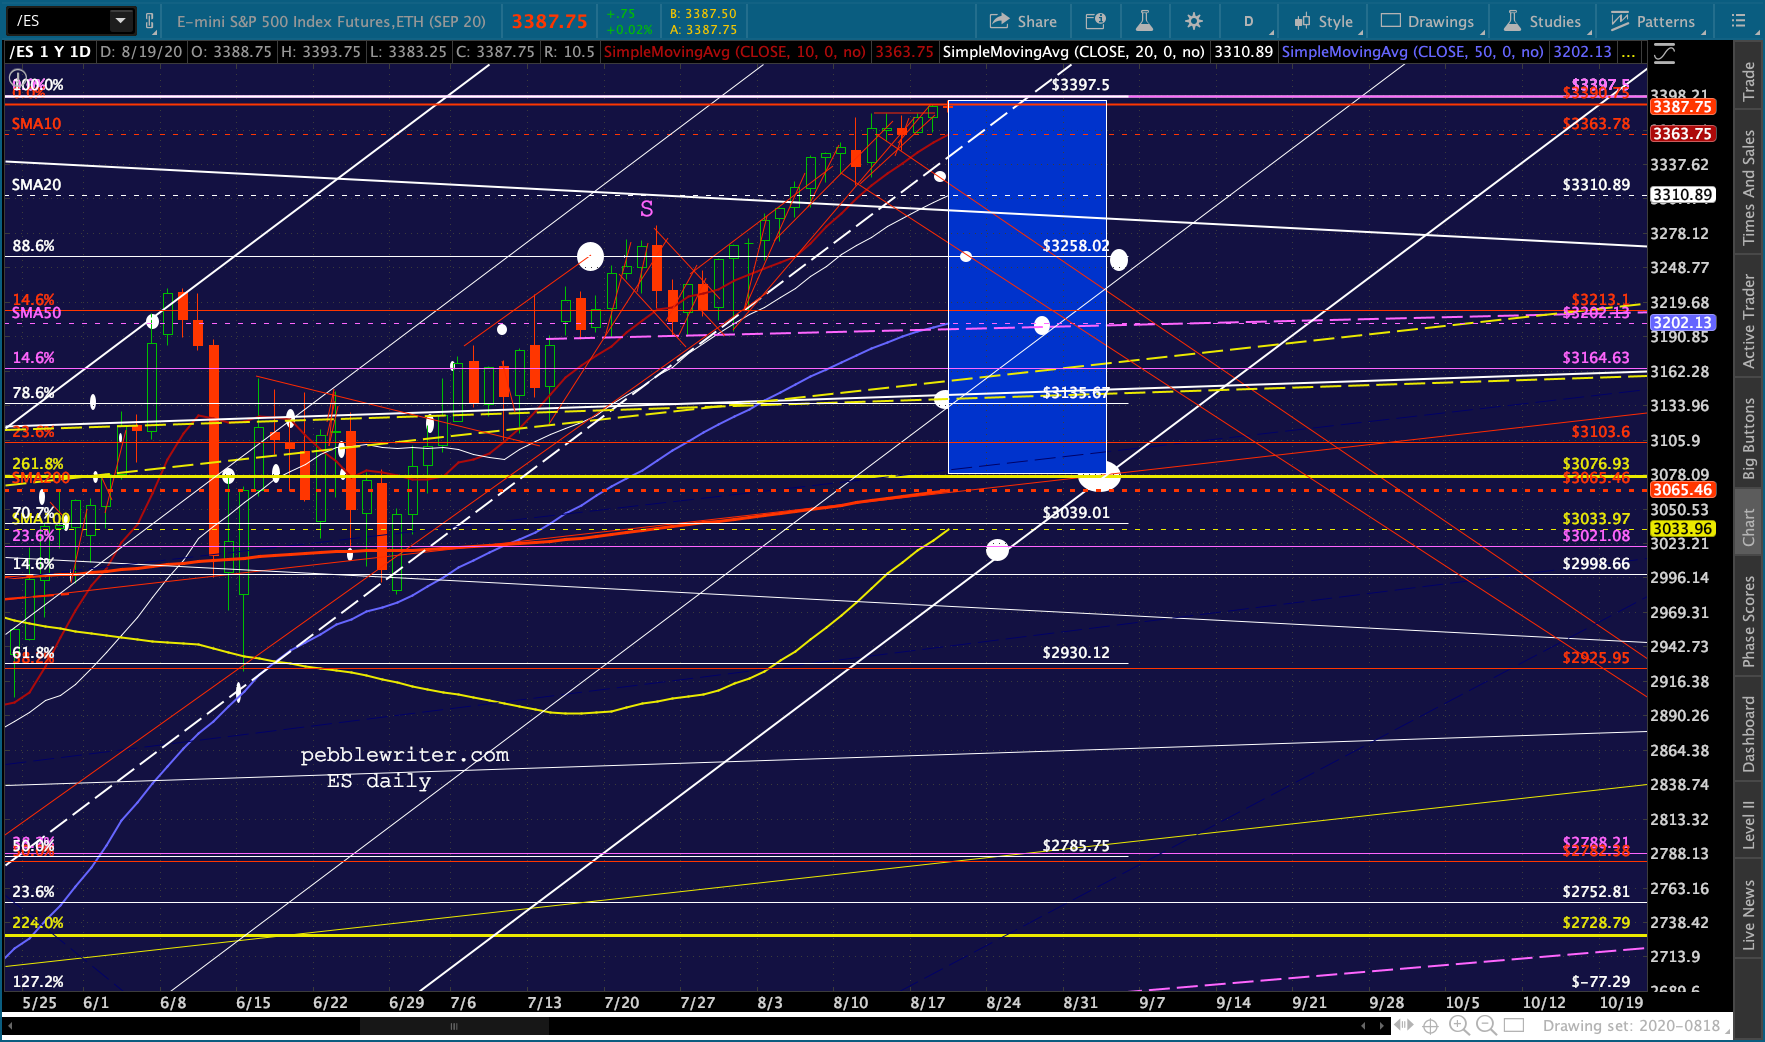
 Note that COMP is back to its channel top, reinforcing the idea that a selloff lies directly ahead.
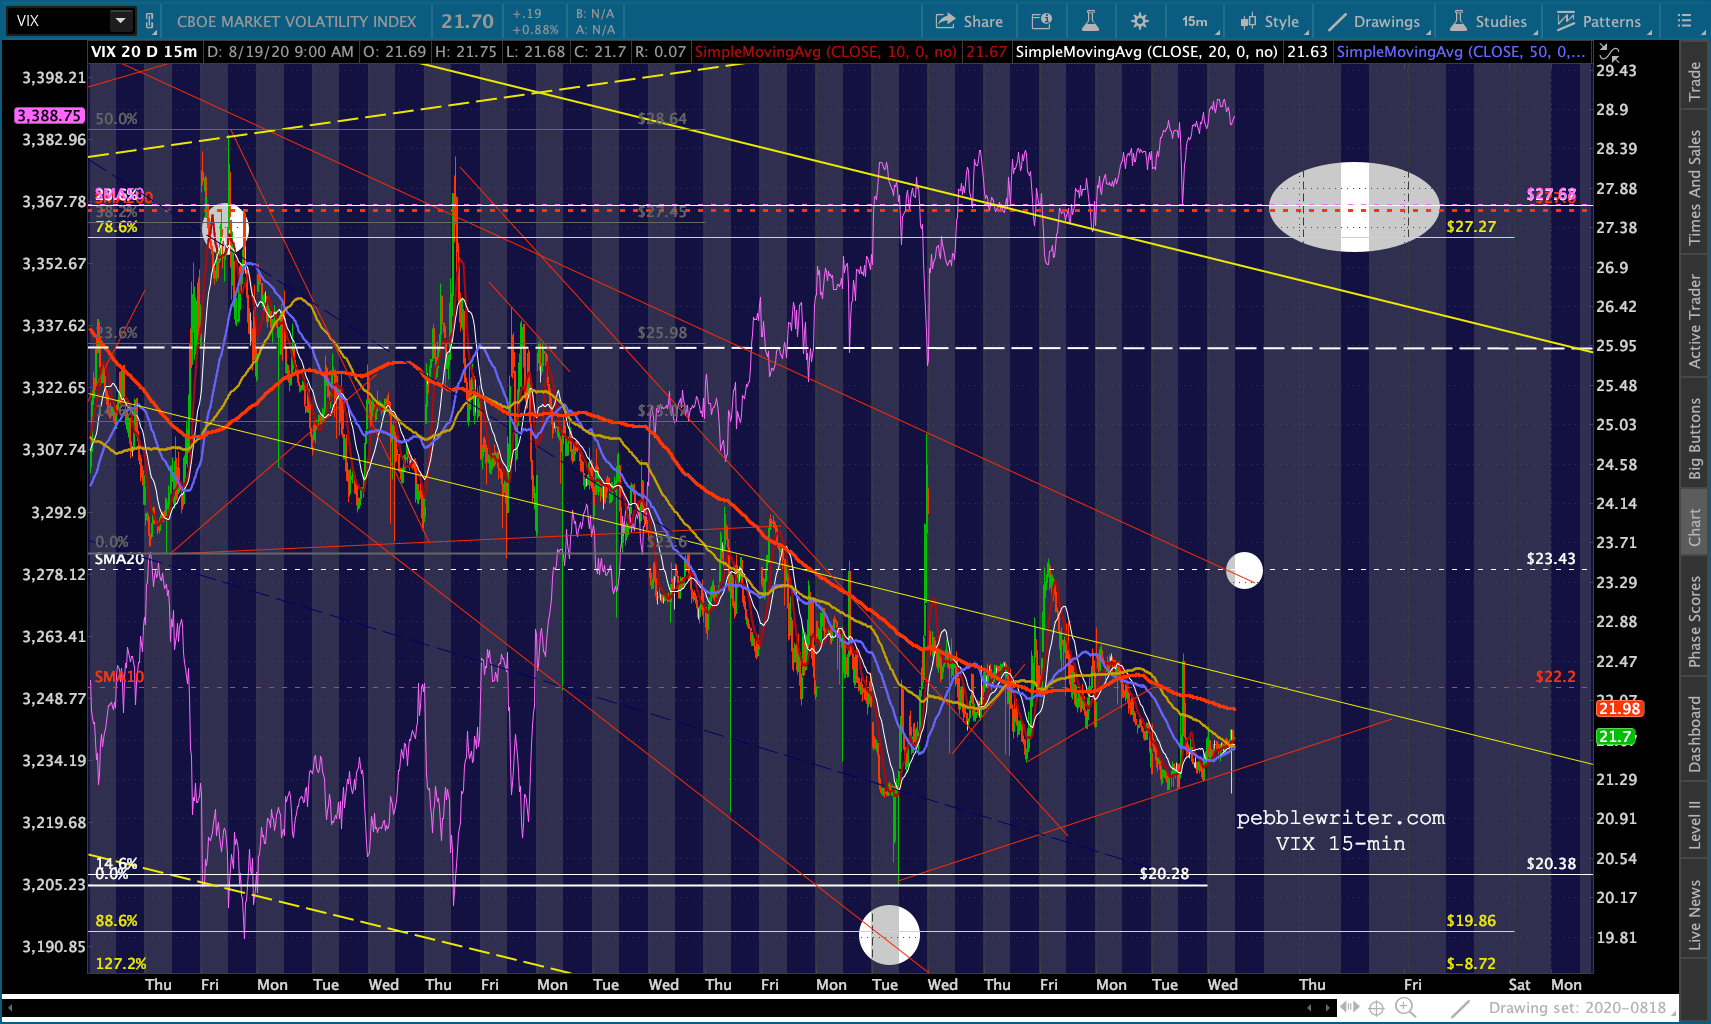
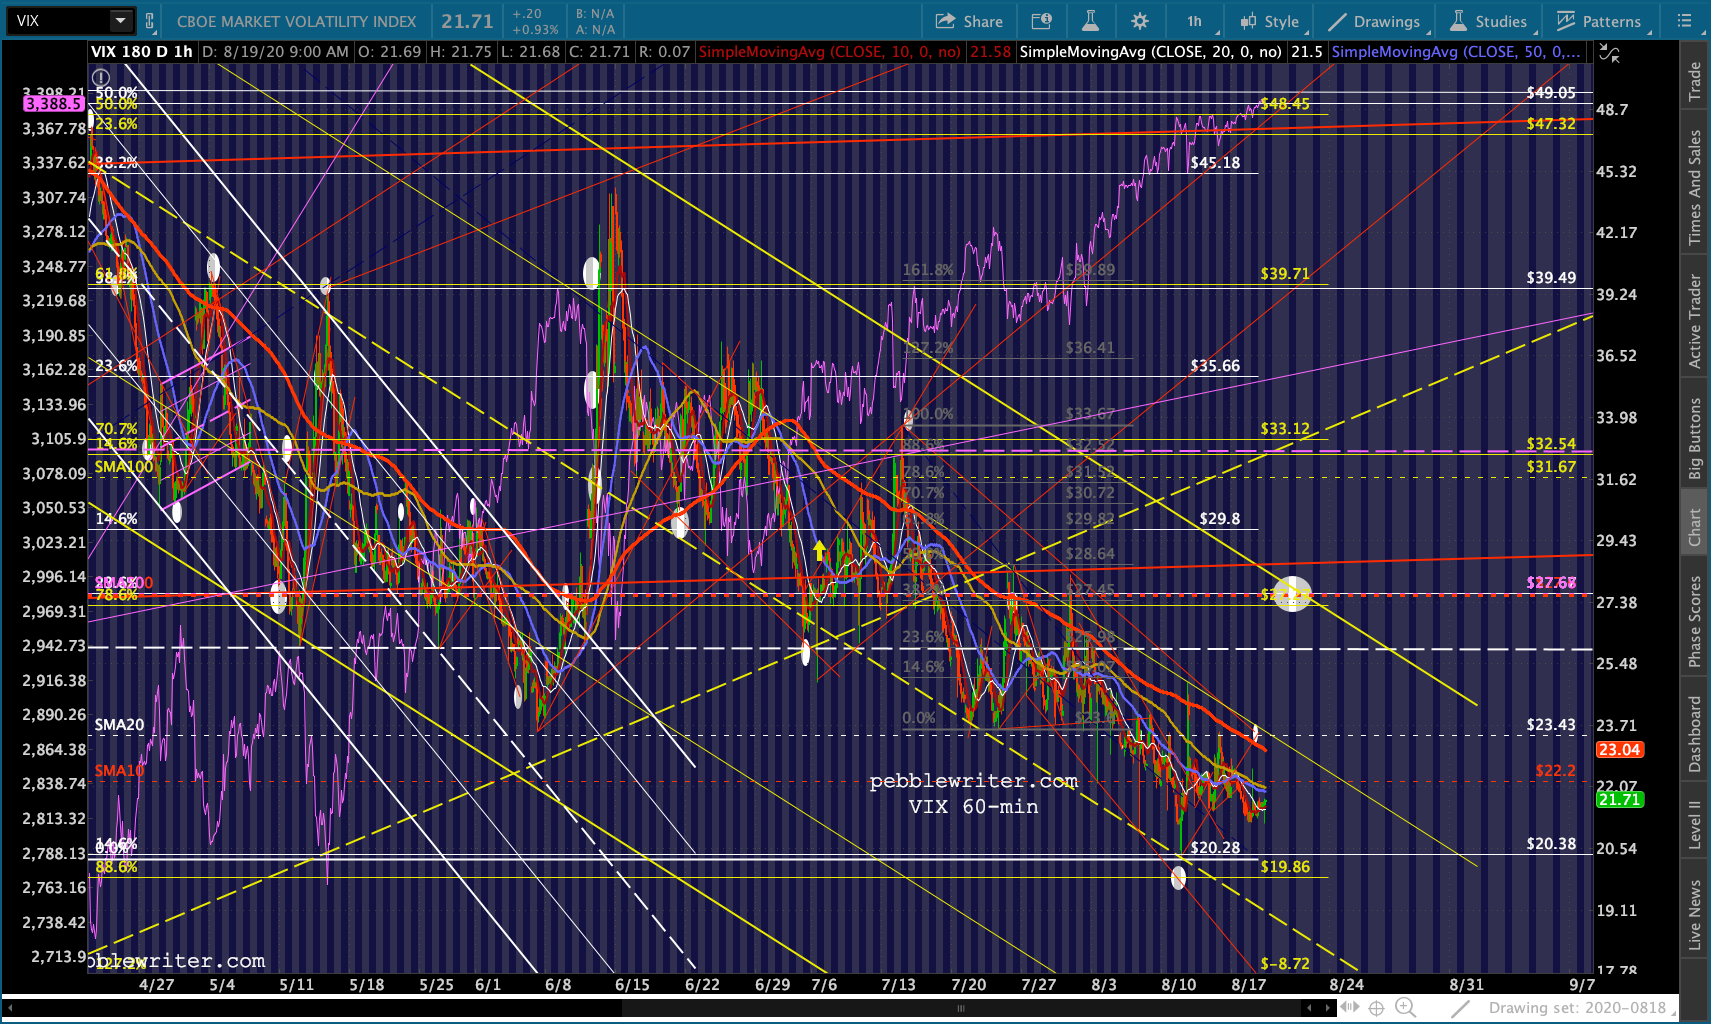
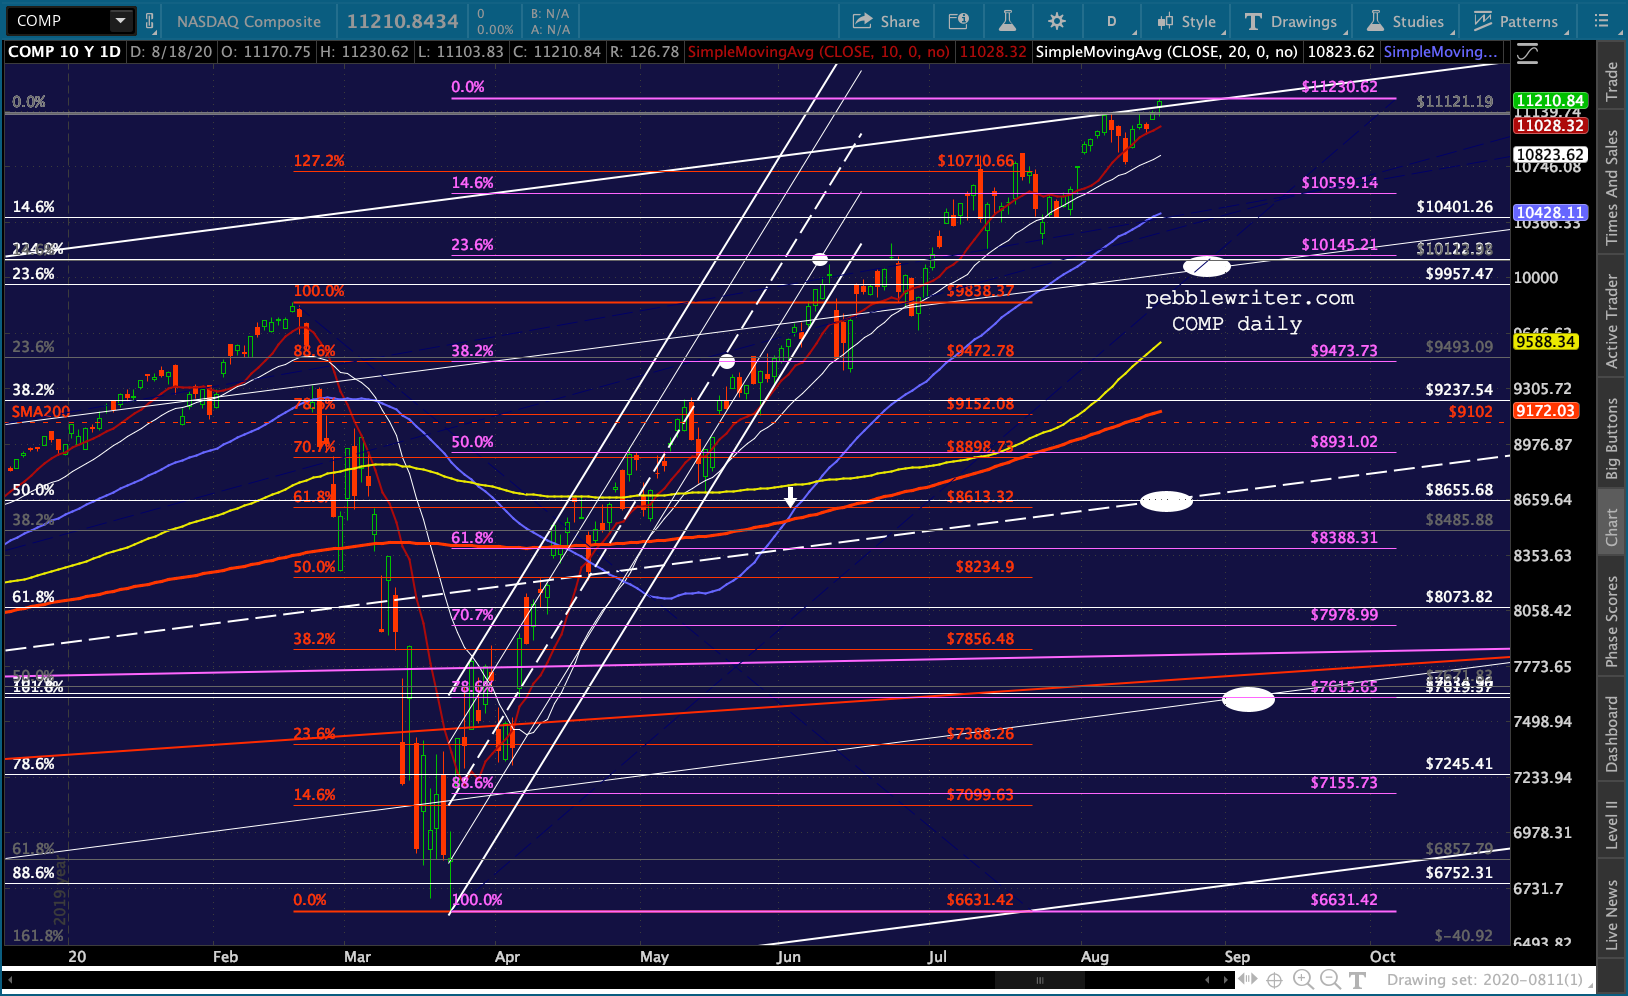 VIX sent another shot across the bow this morning – nothing new.
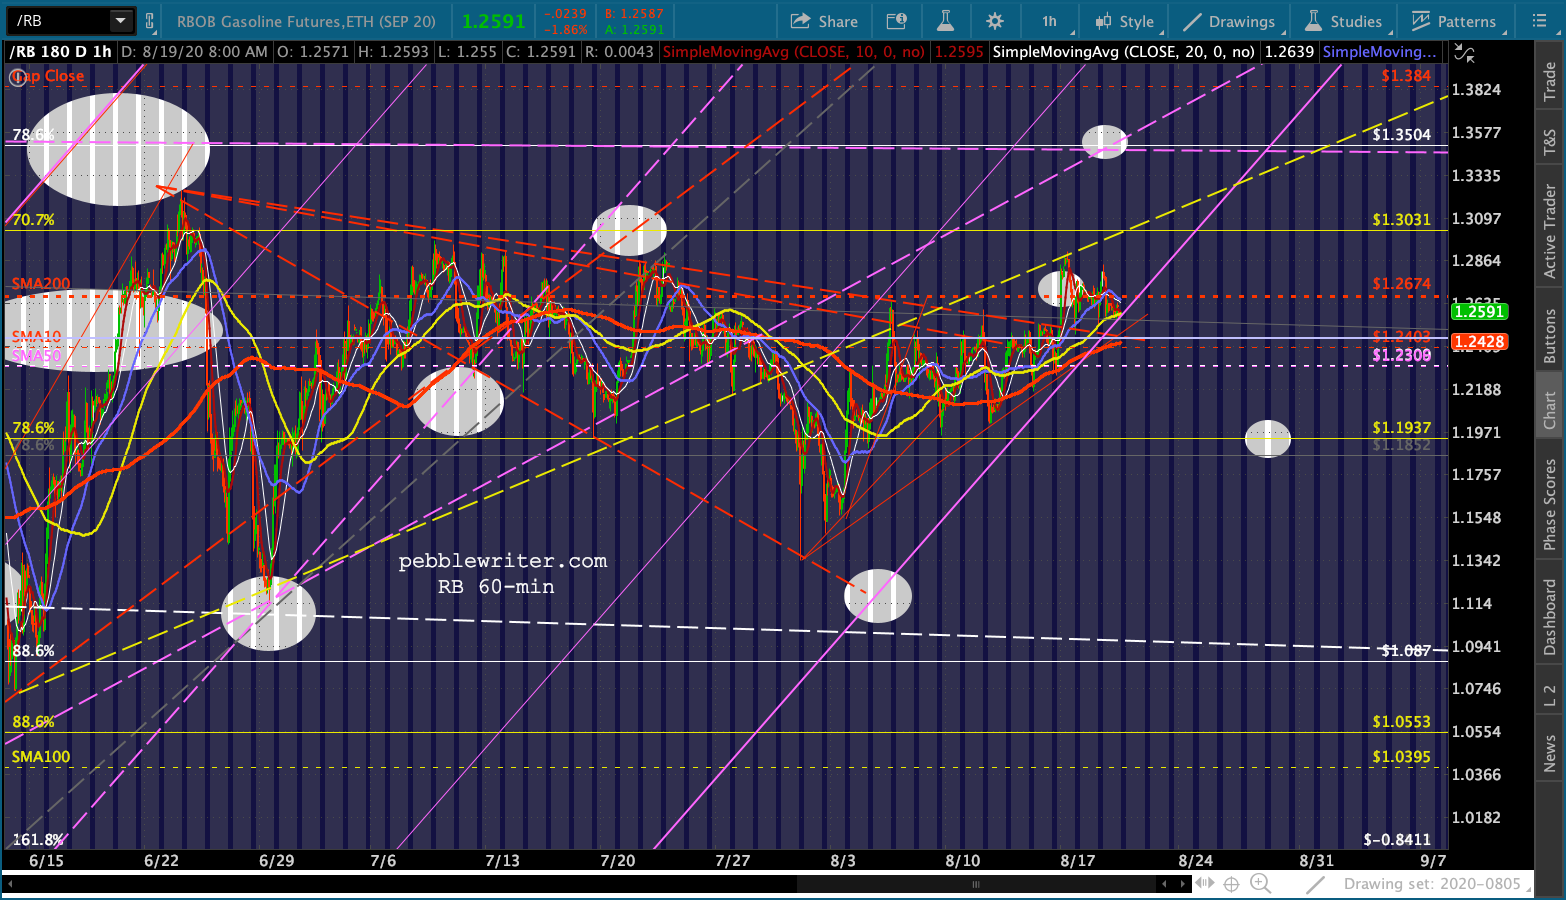
 Oil and gas have extended their sideways shuffle longer and farther than the fundamentals would indicate – triangles giving way to triangles giving way to rising wedges, etc. Clearly the prices have been very effectively manipulated effectively since the April meltdown.
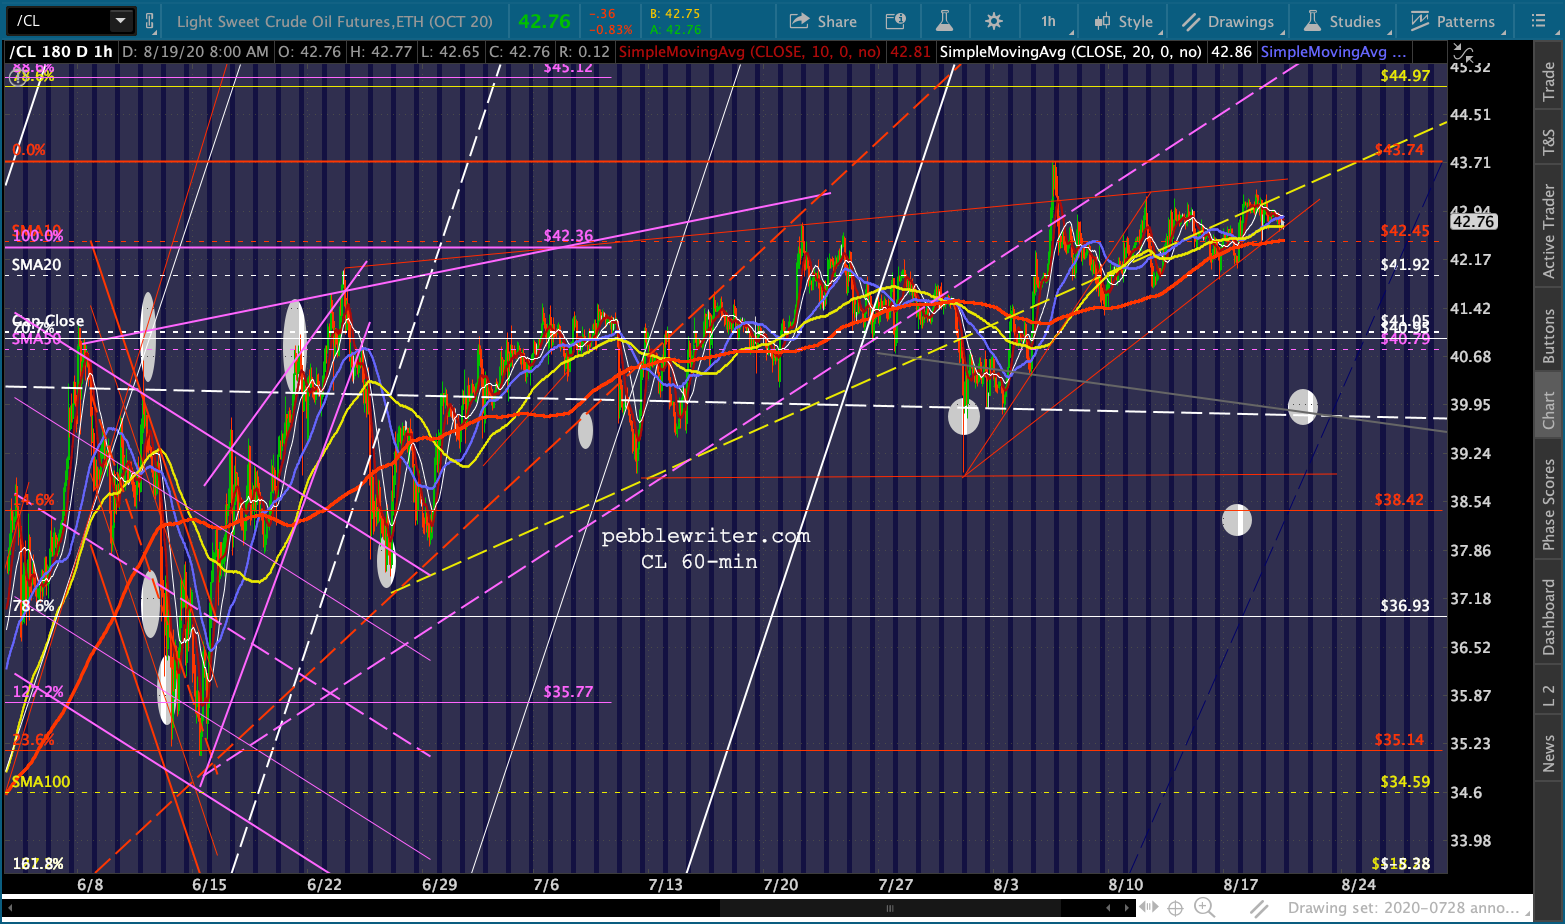
 But, CL’s weekly chart still shows a backtest of the purple midline. Until it breaks above it, I see no reason to turn bullish. Look for EIA inventory data at 10:30 this morning.
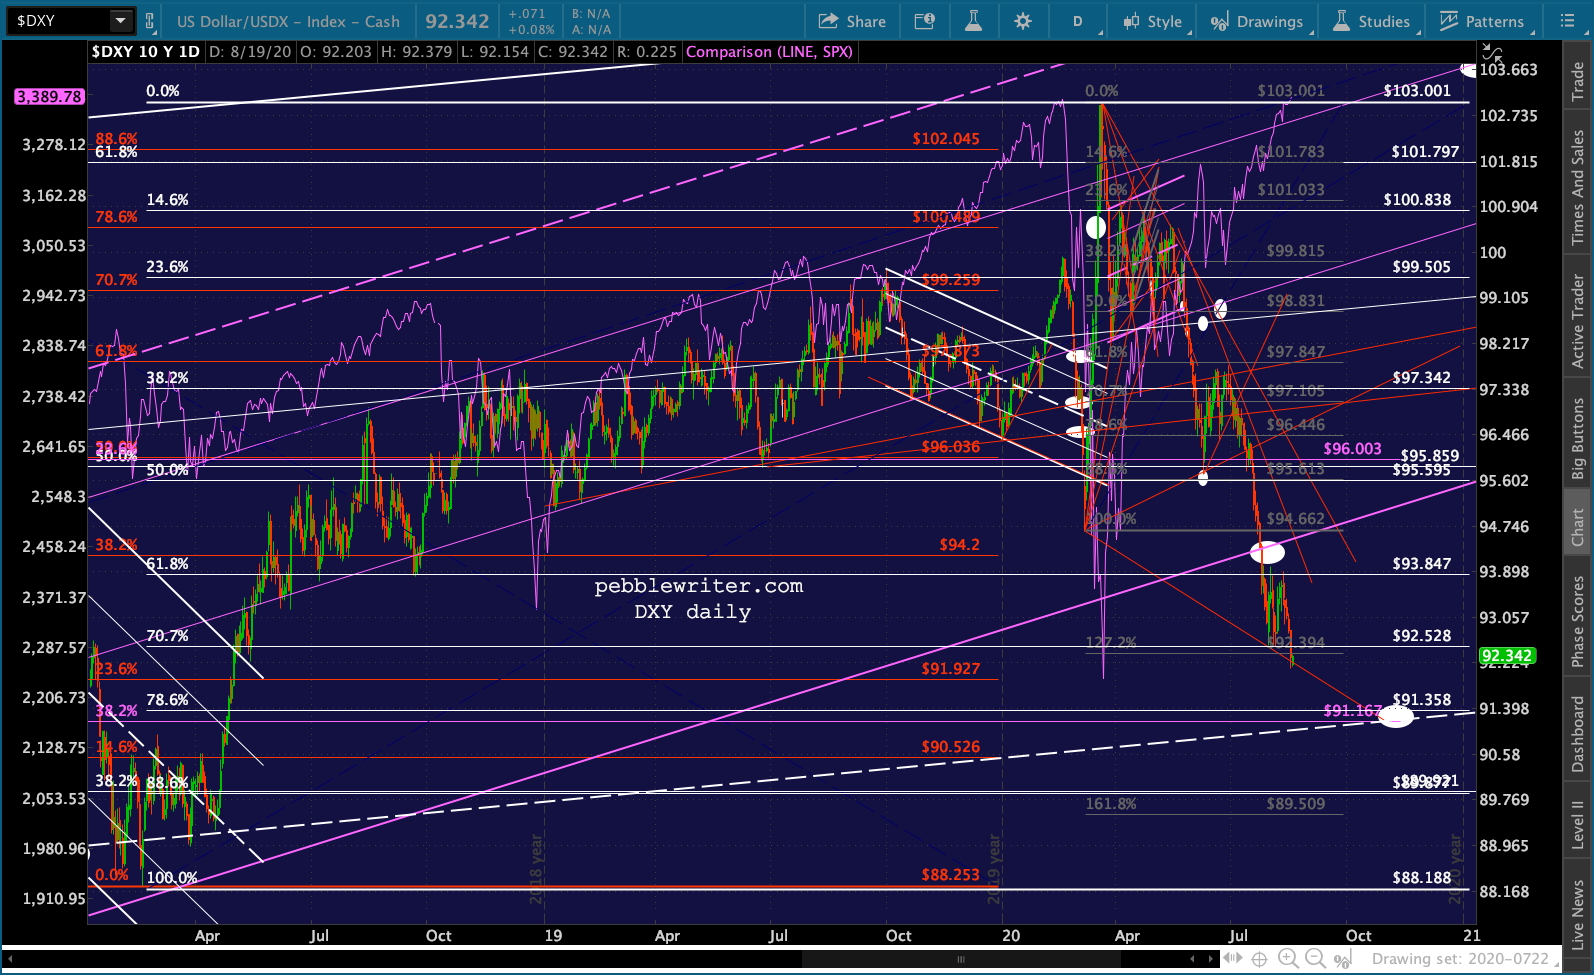
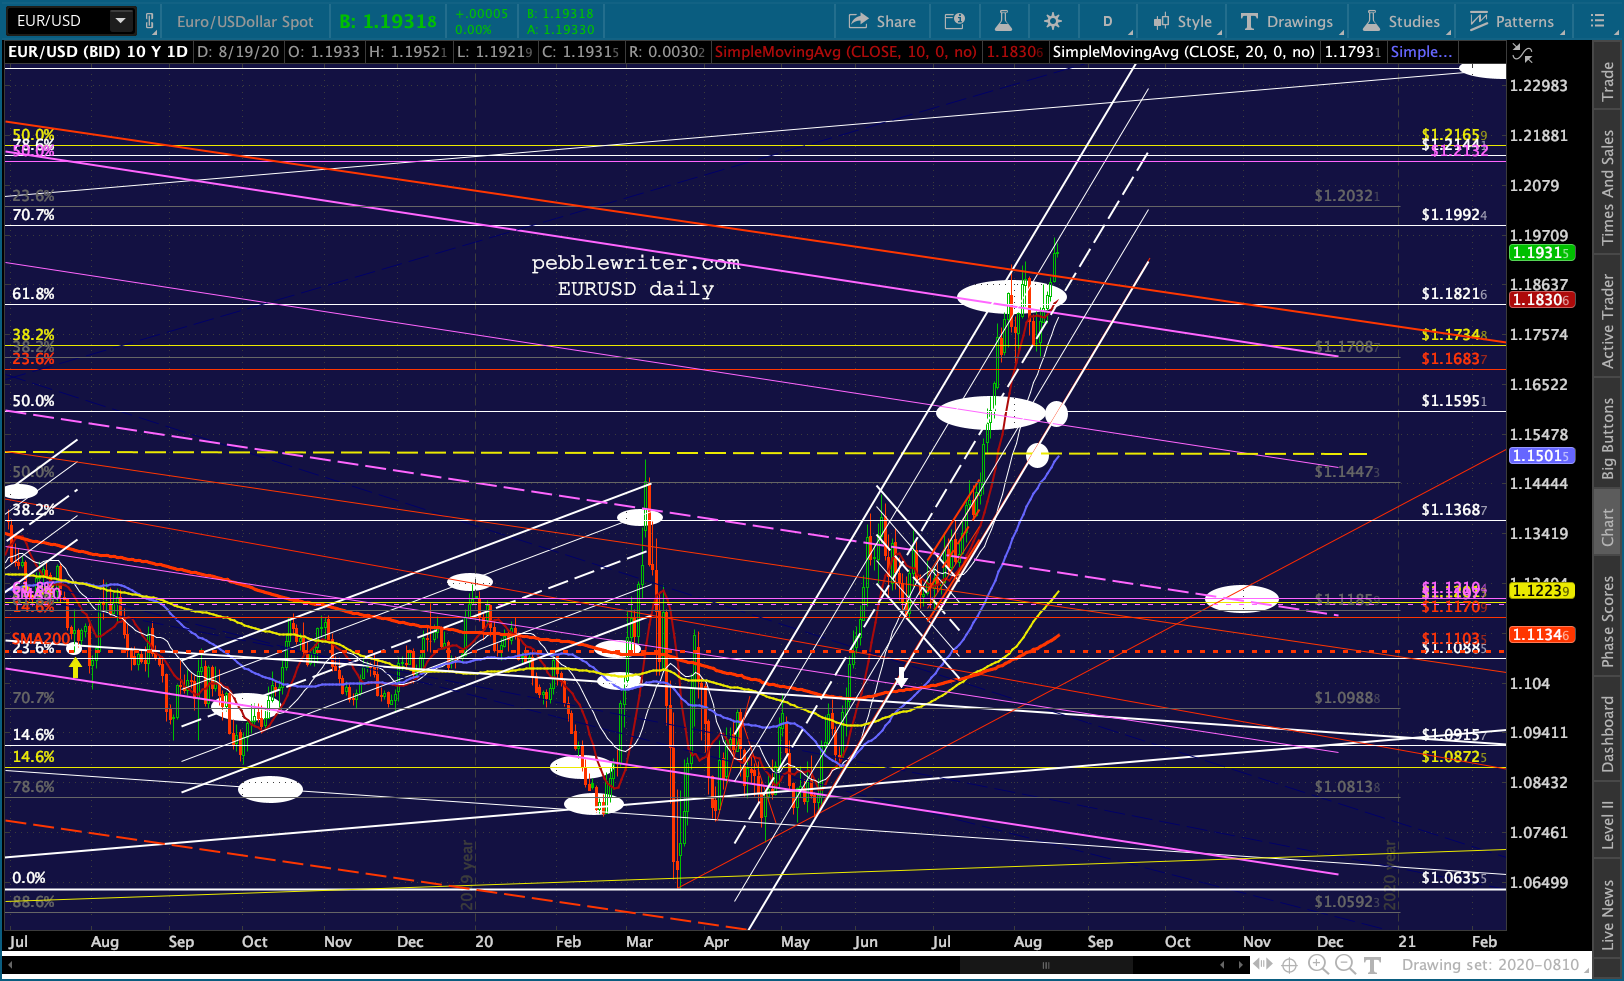
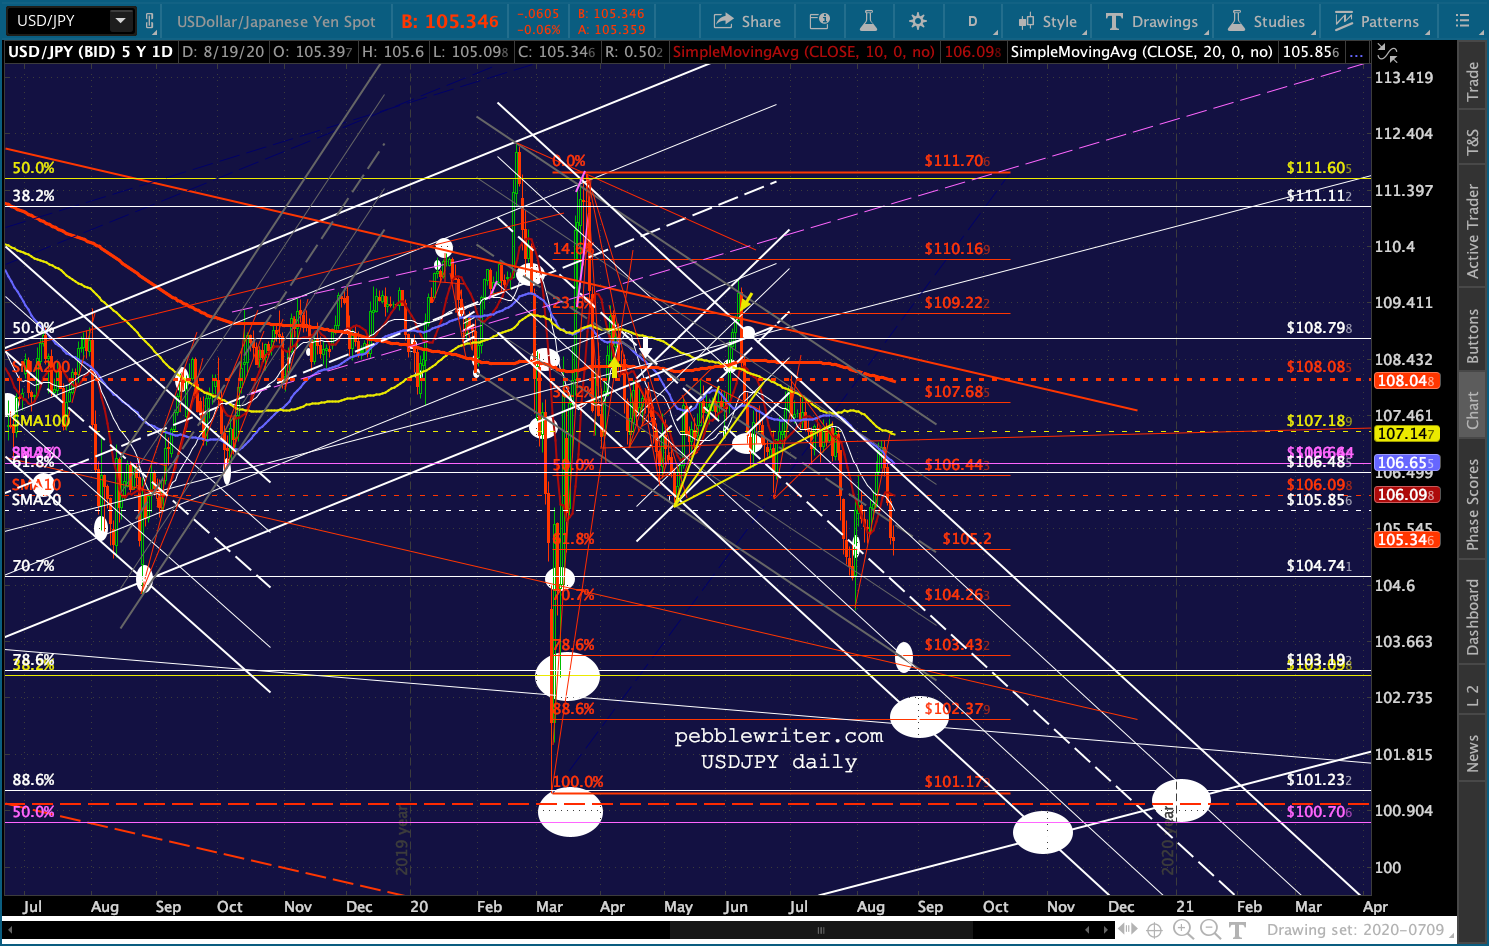
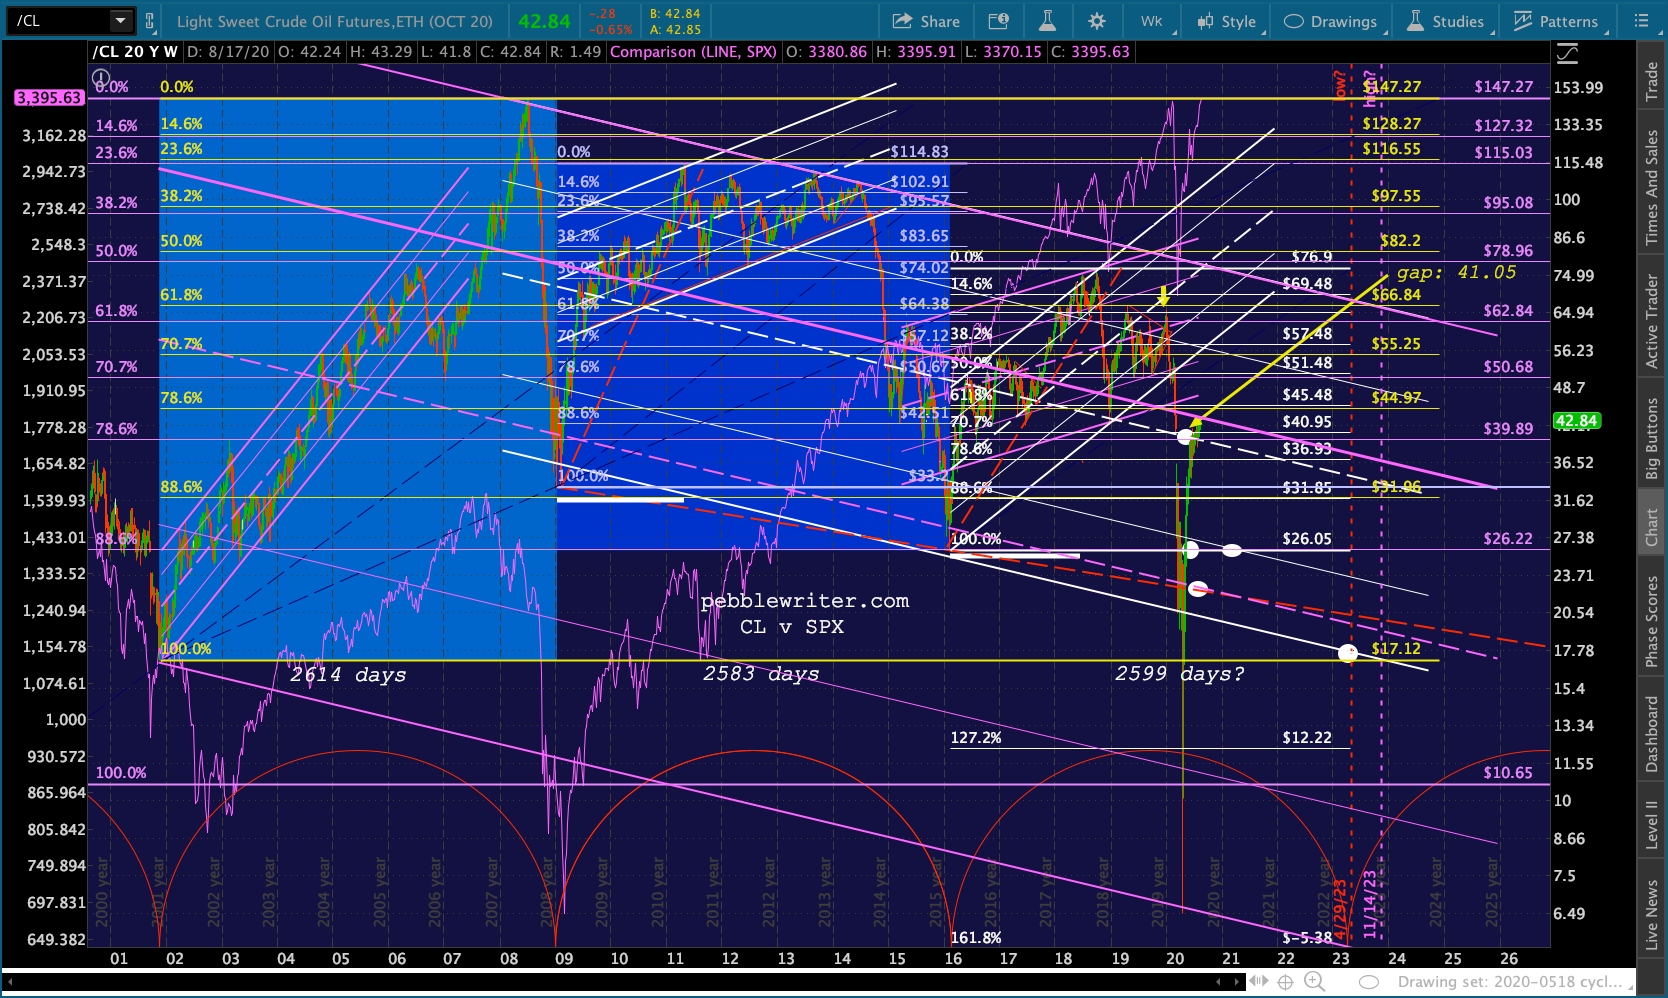 DXY caught down to the little red TL off recent lows. If it continues testing this TL, it will reach our 91.358 target in mid-October. But, it could easily break down and get there in a hurry if EURUSD continues breaking out or USDJPY continues breaking down.
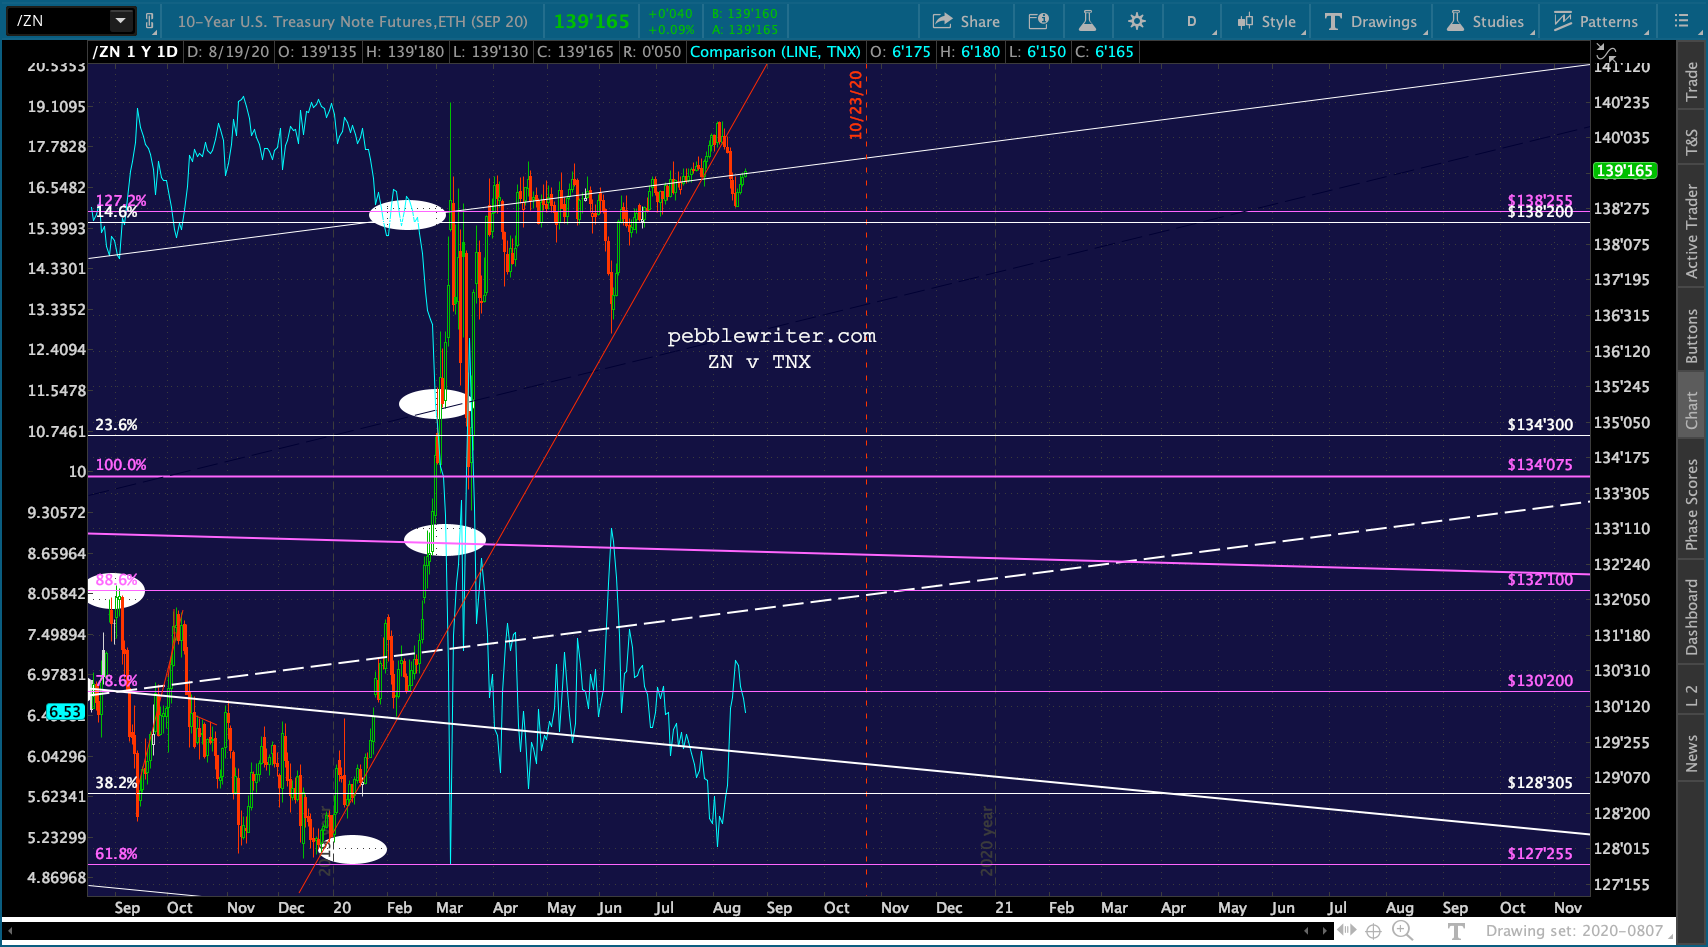
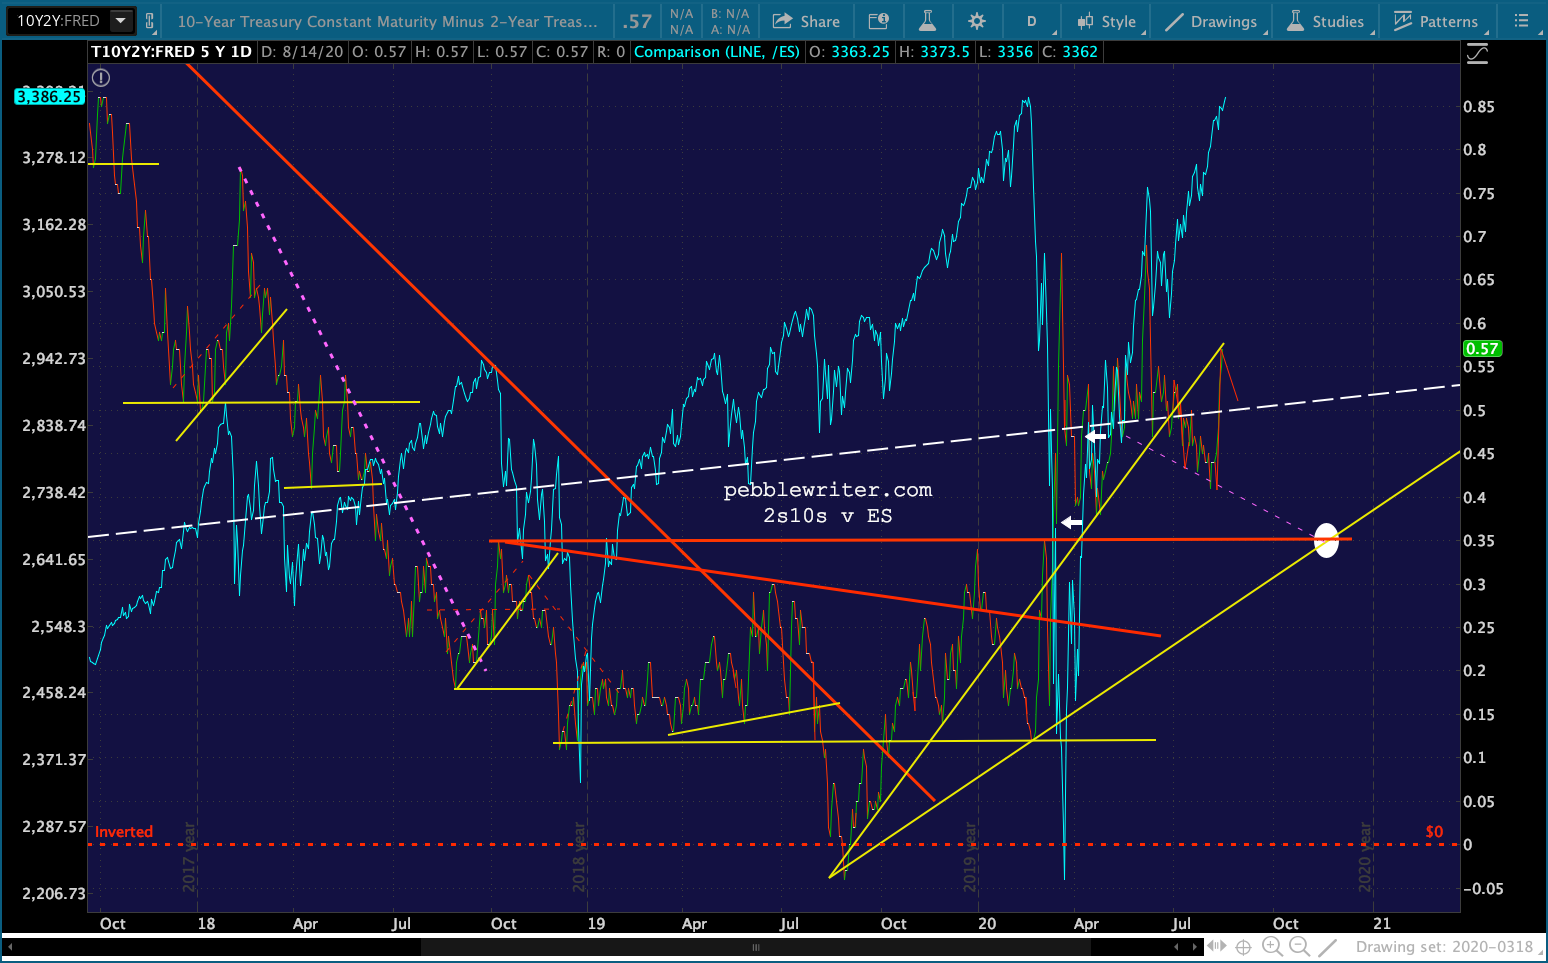
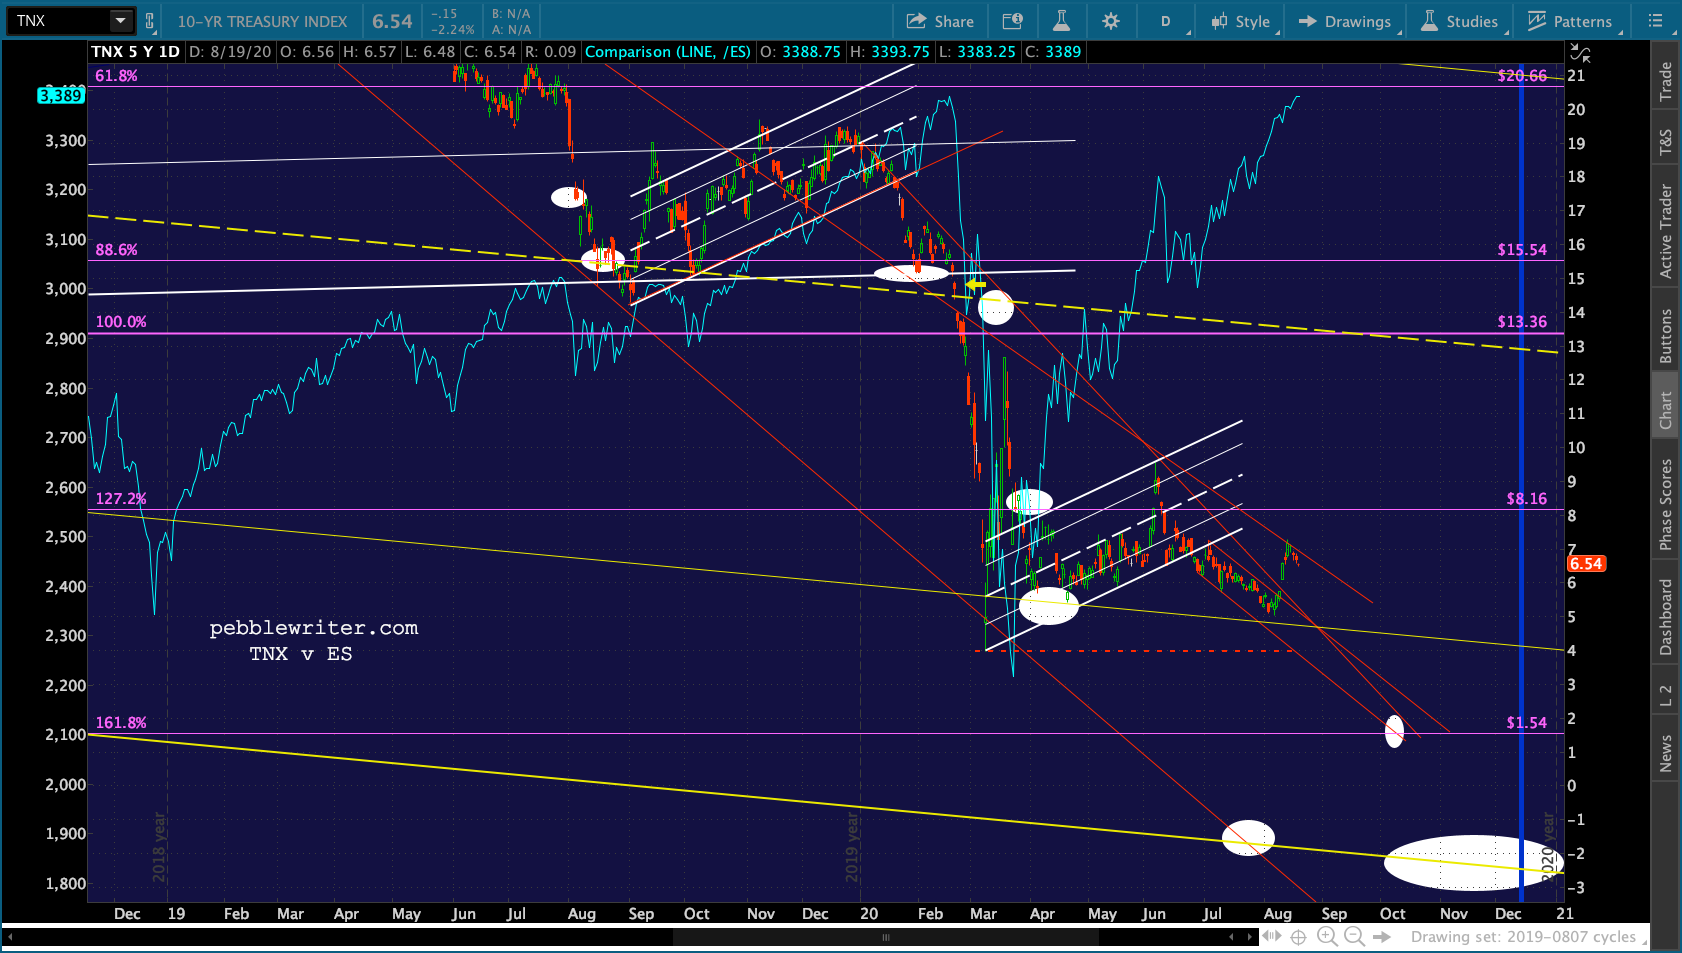
 The bond market continues to indicate trouble.
 I recognize that this outlook will seem overly pessimistic to some. Bottom line, I expect the market is underestimating the likelihood of the coronavirus coming back with a vengeance this Fall. I don’t know if the country has the willpower to go through another shutdown, but it could happen if we get back to March-April conditions nationwide. Many colleges are opening in or reverting to online only status. I believe K-12 will soon follow, as most students, parents and school administrators will not take the necessary steps to reopen safely. As a parent of two students, I hope I’m wrong.
The money side of the equation is, of course, the counterargument. The Fed is doing everything possible to keep the financial system afloat and stocks at their current levels. We might possibly learn more about their intentions going forward from today’s minutes. Like many, I have wondered whether they’ll continue to press so hard once stocks returned to their former highs. It seems unlikely to me, but I’m keeping an open mind.
There are many other wild cards, including oil and gas, currencies, even individual stocks such as AAPL – such a huge part of the S&P and DJIA. AAPL spurted out of its latest rising channel the other day and hasn’t looked back (I’ll post a chart as soon as ToS will accommodate – down again today.) Yet, there are obvious risks such as China retaliating for Huawei, its antitrust issues, its latest slowdown scandal, or a general lack of interest in 5G on the part of beleaguered consumers.
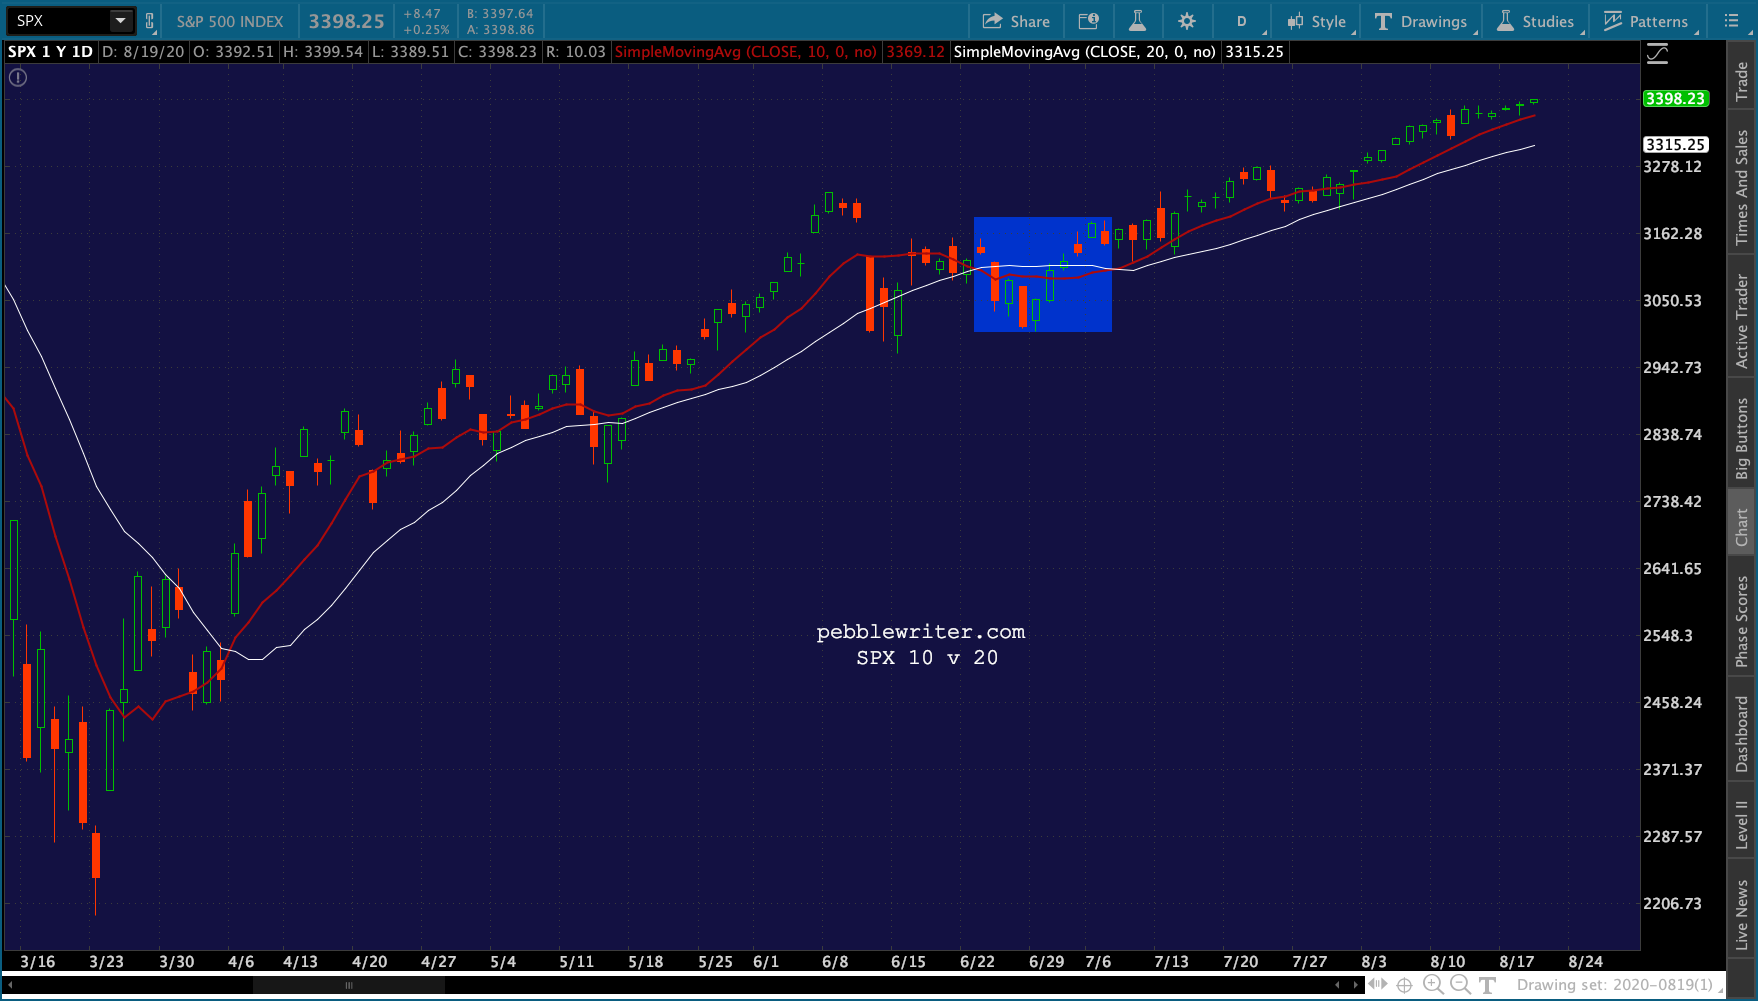
The important thing when we get to a potential turning point such as this is to let the market guide you. Charts and technicals are all about price action – not getting carried away with a particular narrative or forecast. As we’ve discussed many times, simple momentum devices like the 10/20 cross can be incredibly informative. Note that SPX has seen a bearish cross in only 10 sessions since the first bullish cross on Apr 6.
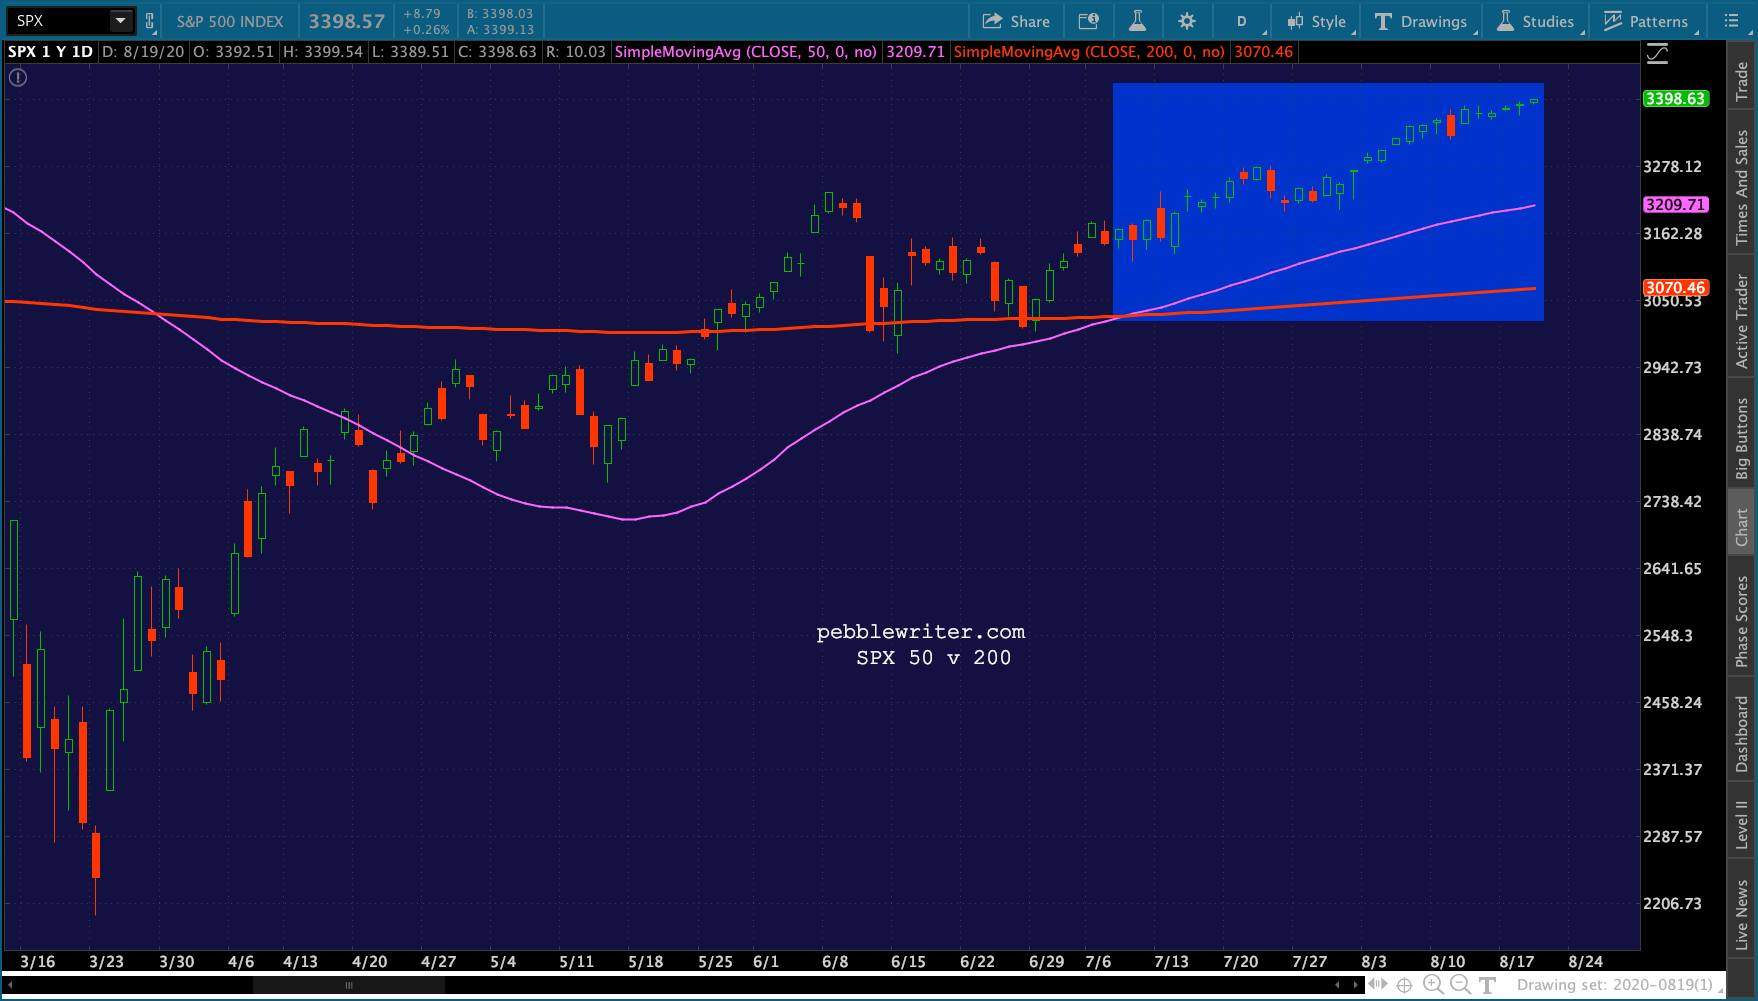
 And, though there was plenty of reason to question whether it would succeed, the golden cross back on Jul 9 was a solid bullish signal.
 My point is to not go nuts trying to trade the market. The trend is up, and will remain so until it isn’t any longer. When it’s over, we’ll know. SPX will drop through its SMA10. Then it’ll drop to or through its SMA20. Then the SMA10 will cross below the SMA20, and so forth.
Those who believe, as I do, that there are going to be some nice shorting opportunities ahead must use stops monitor things 24/7 so you can stay ahead of the many predators and manipulators. If this is a subject of interest, let me know. I’ll write more on trading thoughts in the coming days.
Right now, I have to go get a lovely injection in my shoulder. Apparently I’ve torn my rotator cuff and bicep, probably a few other things as well. While I’m talking schedules, I will be out of the office on Friday morning (21st – OPEX), the afternoon of the 31st, and all day on Sep 3-4.
GLTA.