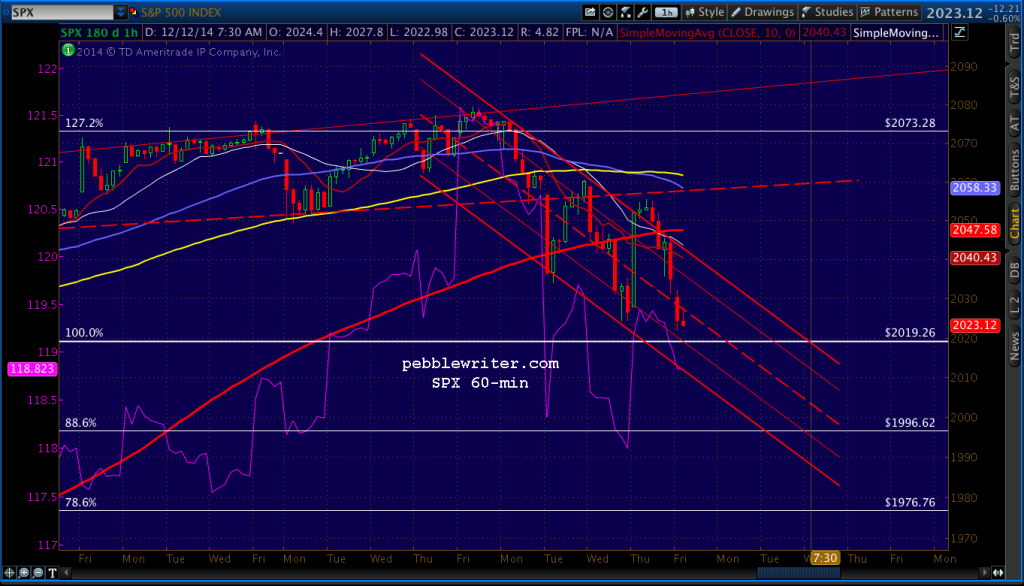
Yesterday’s dramatic moves were certainly In keeping with our call for a choppy end of the year. Our initial read on the situation proved fairly accurate:
Look for an initial strong move back to the red channel top (2049ish) and, if momentum can be maintained, the red TL which is conveniently located at the .618 (2058.38) of the latest decline.
In fact, SPX paused at 2049, reversed a bit, then shot up to 2055.33 to tag the red TL before reversing hard and closing at a 9-pt gain.
Taking a step back, it’s fair to say we’re getting a somewhat normal reaction to a reversal at the 1.272 — even though the 1.272 “tag” was anything but.
The index made initial contact on Nov 25, only to go on to close even higher over the next two sessions. It finally backed off by 25 points, but was saved by the red TL and went on to post four more new highs in excess of the 1.272 before finally giving up on Dec 8.
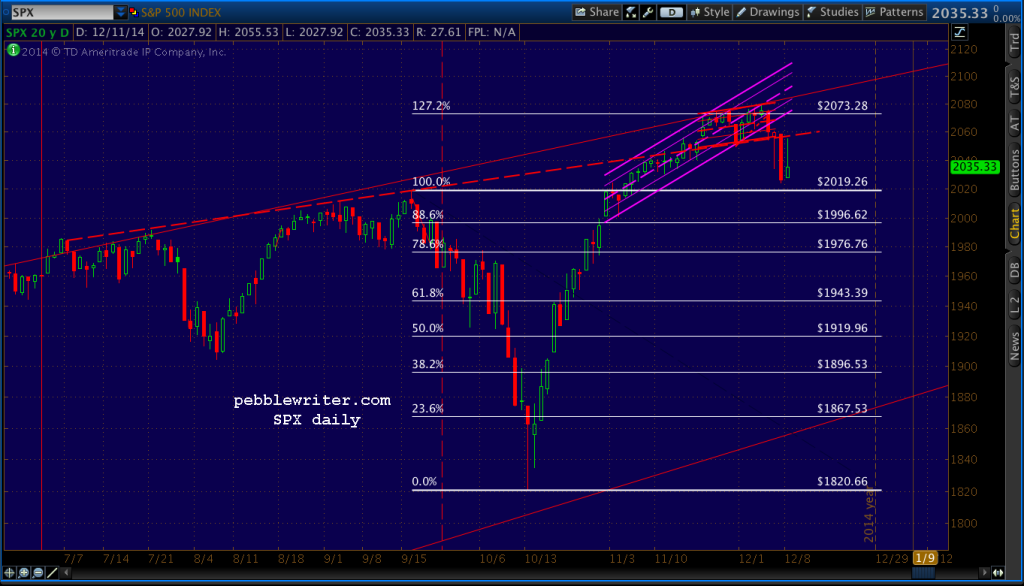 Since then, it’s been a battle to maintain some connection with the rising red TL. The connection turned bearish yesterday: a backtest. The normal next step would be lower prices. And, as the futures are indicating, that’s exactly what we’ll get at this morning’s opening.
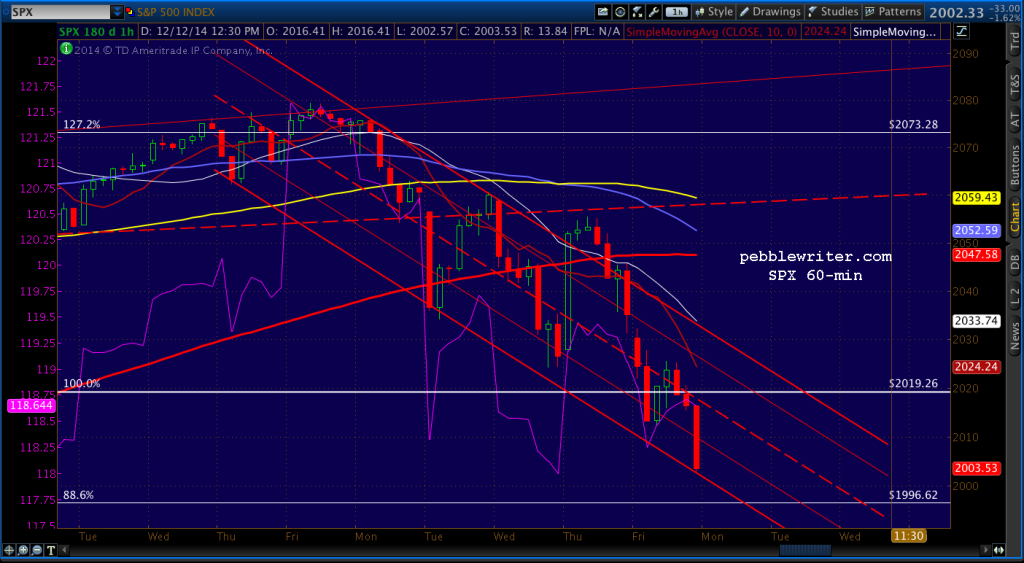
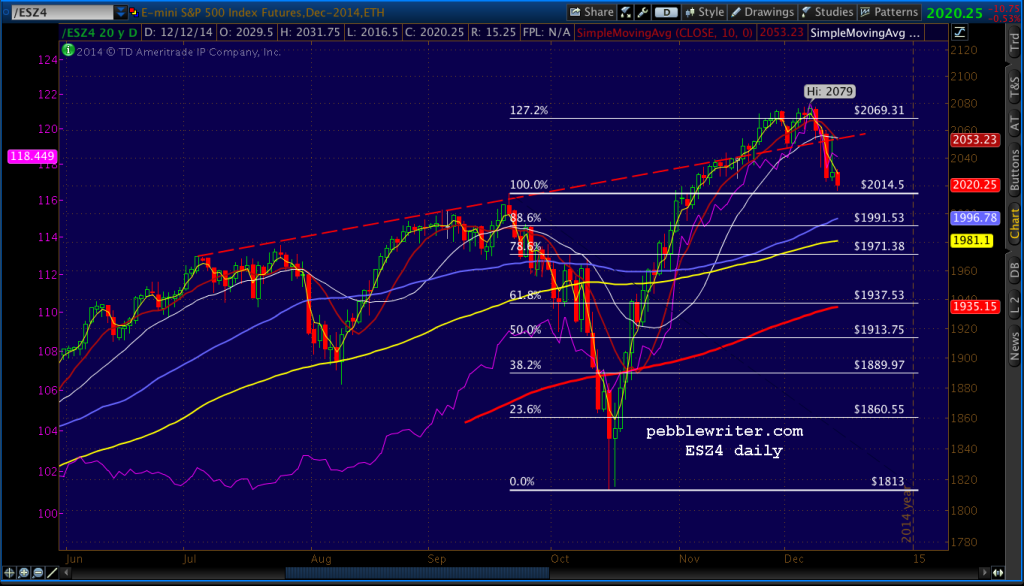 With ES pointing to a tag of the previous high, we should expect SPX to follow suit. We’ll call 2019.26 our initial target. Astute readers may recall this target from this past Tuesday [see: Dec 9 Update]:
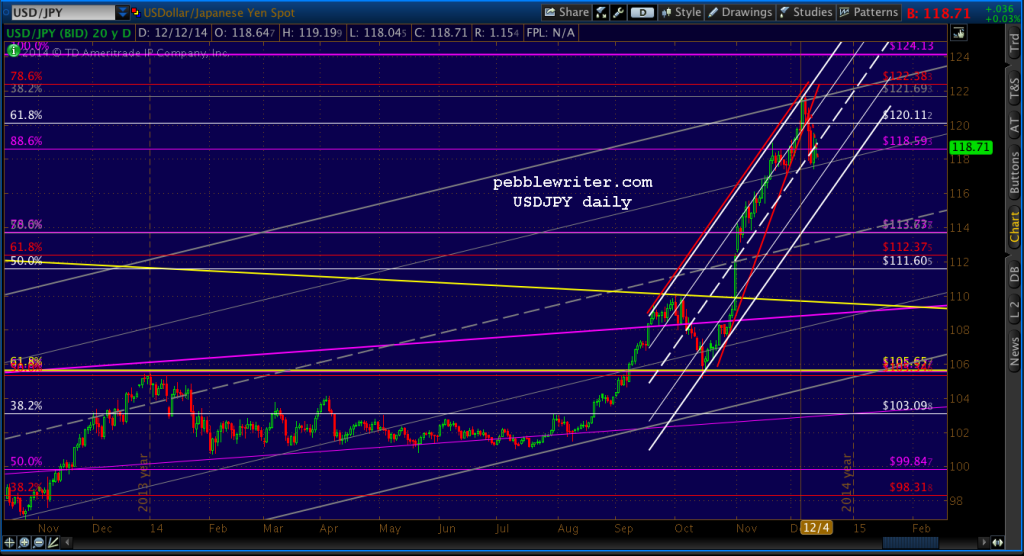
USDJPY has reached a TL of support (purple, below) so we’ll watch to see if it gets a reversal here that allows SPX to bottom out at 2041 (the 1.272). If not, SPX’s next support isn’t until 2031 (1.618) and then the previous high way down at 2019.
USDJPY got that initial bounce, and another than enabled yesterday’s intra-day spurt. But, since then, it has been no help at all to SPX — not even managing a backtest of the broken rising wedge.
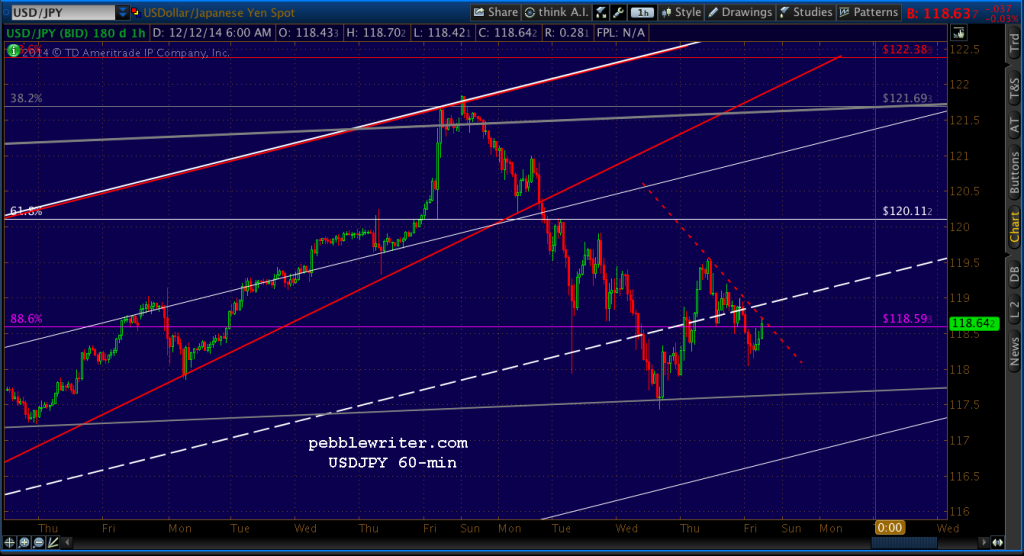 A break through the dashed red line, and especially the white channel midline, would do the trick. But, bulls should keep an eye on that white channel.
It’s not much of one yet, but USDJPY has a habit of converting a long, sideways slide into a lower-bound tag. If so, it could provide additional boosts to stocks that are seemingly out of the blue.
 As to SPX, let’s review the basics of 1.272 tags. 1.272 is the square root of 1.618 — the golden ratio. This makes it important, and it quite often provides decent reversals. The most dramatic ones come when there’s an previous reversal at the .786. We call these Butterfly Patterns [read more about Butterfly Patterns HERE.]
As can be seen from the SPX charts above, there was no reaction at the .786 (or, at any other Fib level for that matter.) That doesn’t preclude a significant reaction at this 1.272; it merely doesn’t suggest one.
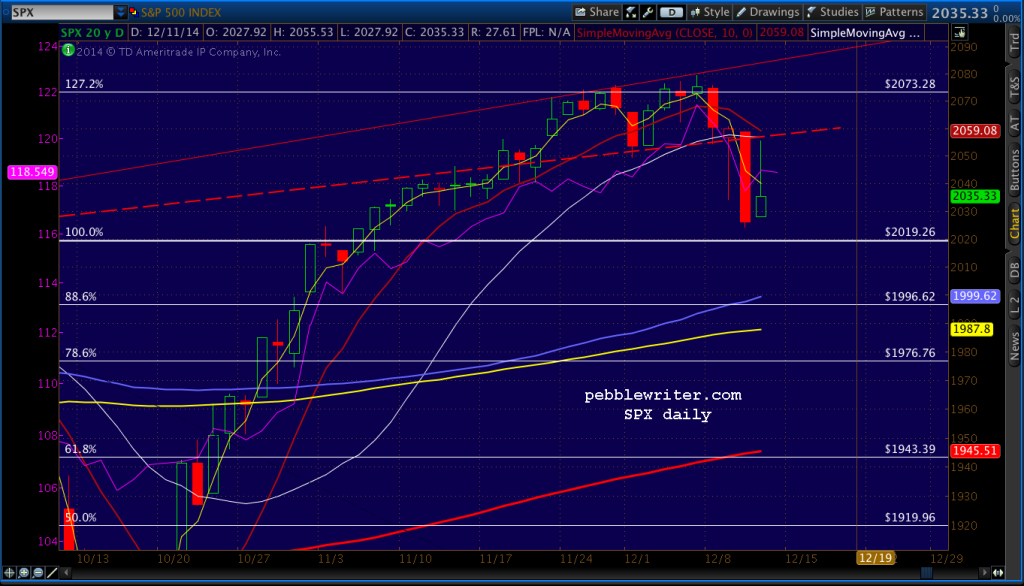 So, while a Butterfly Pattern reaction might normally reach the .886 or .786, I wouldn’t pin my hopes on it this time. Again, it doesn’t mean it won’t happen. If USDJPY continues to slide or even (horrors!) actually declines, SPX is going down. In that event, the SMA50 or SMA100 could team up with the .886 to provide a stop at 1996.
But, as always, the key will be USDJPY, and whether it can continue skyward. Given the latest out of Japan regarding the GPIF’s ludicrous equity investments, I think it will — keeping our year-end forecast alive.
UPDATE: 10:40AM
A mixed bag so far… USDJPY did, indeed, break through the TL. It even broke through the white channel midline.
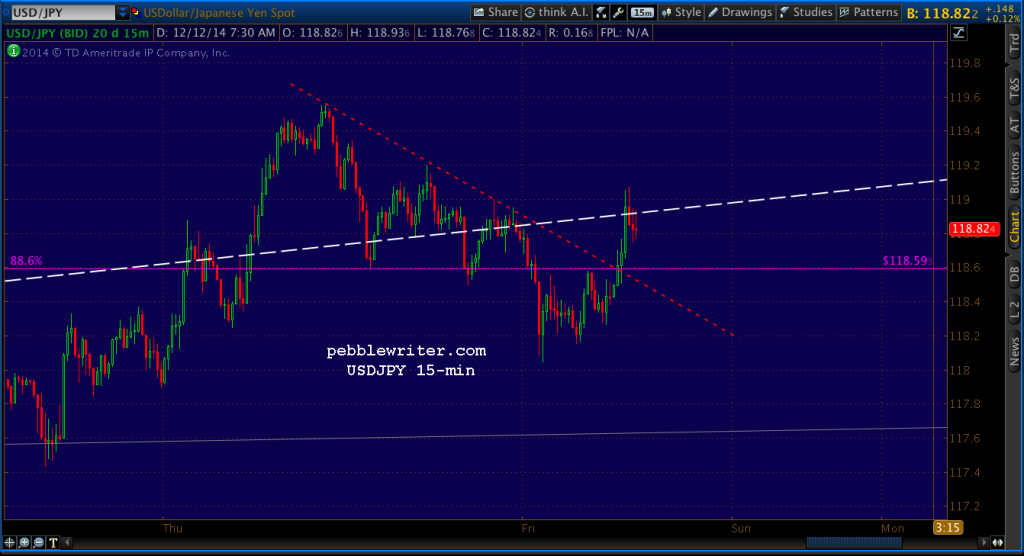 But, it reversed back below it, indicating 6 more weeks of winter — or, we’ll get that 2019 tag — whichever fits. Judging from SPX’s chart, probably the latter.
Pretty wild day. USDJPY couldn’t punch through the white midline, and looks like it might have more downside ahead. But, as with all prices that are set by a committee rather than the markets, we’ll have to see what the BOJ has in mind.
Just eye-balling it, though, the falling red channel argues for further downside — as does the rising purple channel that mostly looks like a flag pattern.
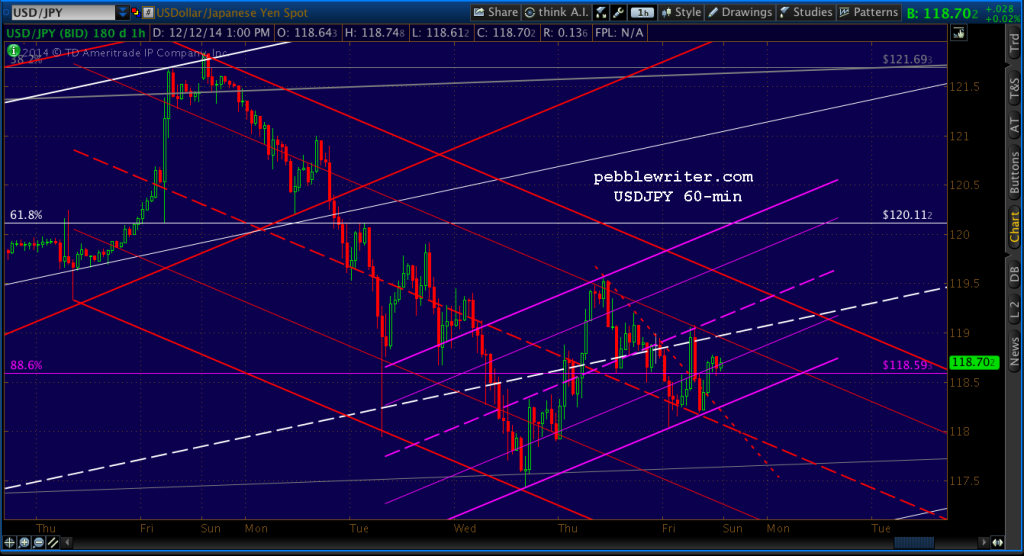 As a result of USDJPY’s weakness, oil’s weakness and lower interest rates (TNX fell to 2.08%), SPX fell through our 2019 target and came awfully close to the 50-day moving average.
 I’ll revisit the year-end picture this weekend.

