
A quick summary of the major charts…
RUT has completed a Crab Pattern (in red) within the last leg of a Bat Pattern (purple) off the 2011 highs. Significantly, it hasn’t been able to clear the TL off the May and July highs. The May 2011 high was a double-top to 2007’s.
 COMP is tagging a trend line off the 2007 highs which is exactly parallel to the line connecting the 2002 and 2009 lows. A reversal here would make for four touches — i.e. a channel.
 While the largest potential Butterfly Pattern 1.272 completion is still some distance away (3295 v current 3071), it completed a small Crab within a small Butterfly at 3062 and 3048 respectively. I think that between the TL and the smaller Butterfly, we should get at least an interim low in the short run — even though there’s more medium-term upside to the 3250-3300 level.
 DJIA peaked at 13,289, completing a Crab Pattern a stone’s throw away from a Butterfly Pattern completion at 13,338.64.
 Zooming out, we see that we’re also bumping up against the .886 of the Oct ’07 to Mar ’09 drop at 13,317.09. Either of these patterns could be considered close enough to be complete, but a small intra-day bump to tag the actual target is very feasible.

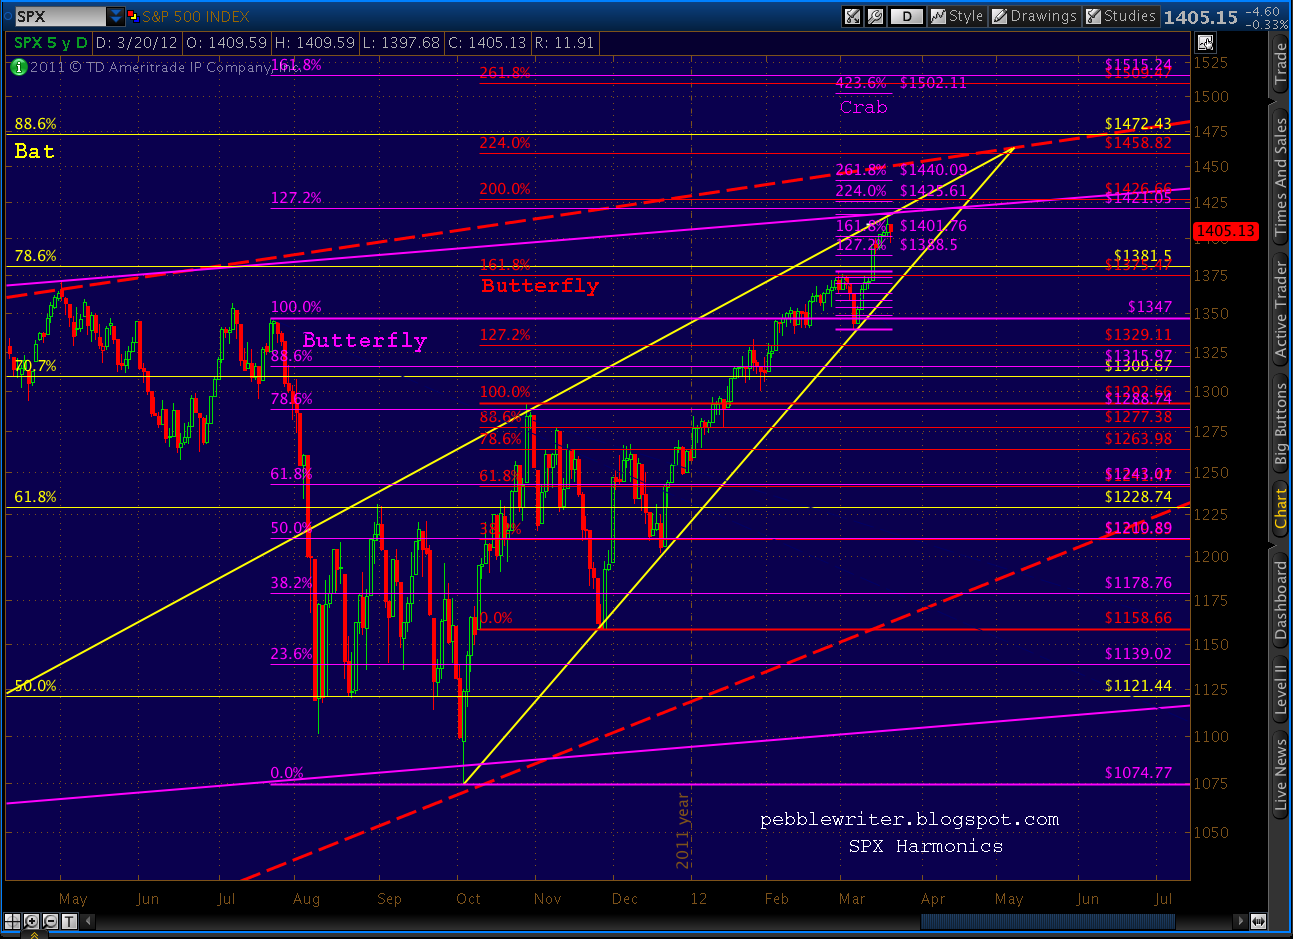
SPX is closing in on the .886 of the Oct 07-Mar 09 drop at 1472.43. But, we’re reaching important resistance levels in the rising wedge — which is getting long in the tooth.

On a smaller scale, the Butterfly pattern from last July is approaching its 1.272 extension at 1421 — assuming a Point X of 1347 on July 21. This is the best fit for the Butterfly pattern, but it could be started at May 2’s 1370 or July 7’s 1356 — resulting in slightly higher 1.272 extensions.
There is ample bearish divergence in every time frame.
More later.